


 Экология
Похожие презентации:


Green buildings waste: waste overview including land issues
1.
GREEN BUILDINGSWaste: Waste Overview including
Land Issues
Alen Amirkhanian, Astghine Pasoyan
College of Science and Engineering
American University of Armenia
2.
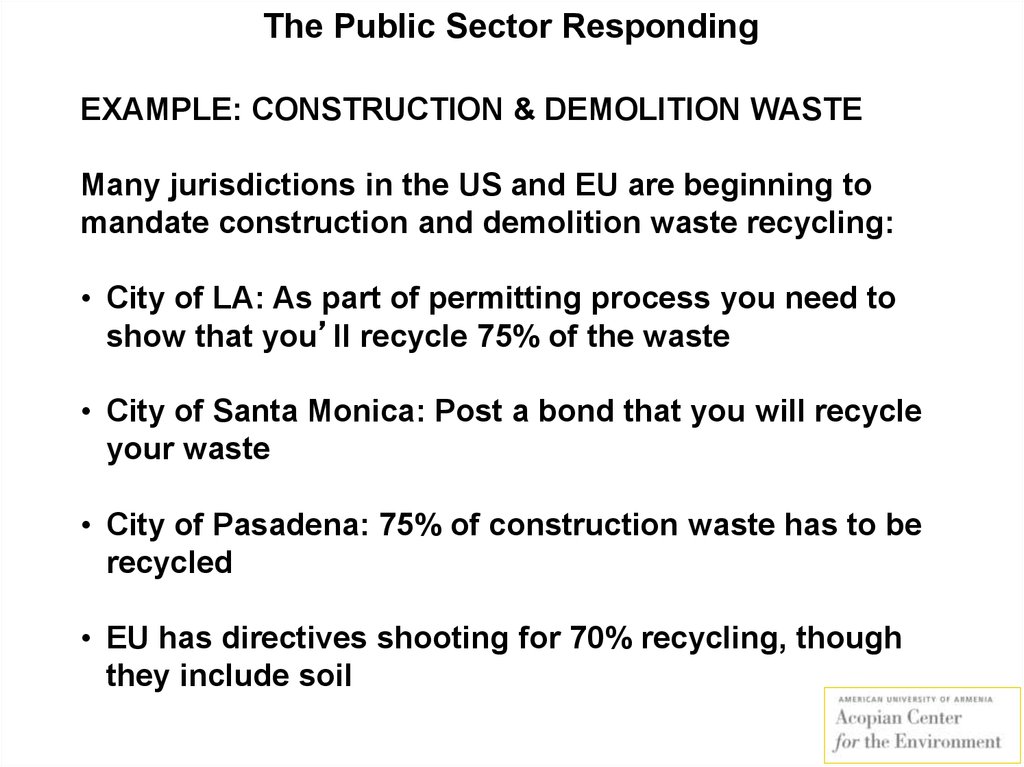
The Public Sector RespondingEXAMPLE: CONSTRUCTION & DEMOLITION WASTE
Many jurisdictions in the US and EU are beginning to
mandate construction and demolition waste recycling:
• City of LA: As part of permitting process you need to
show that you’ll recycle 75% of the waste
• City of Santa Monica: Post a bond that you will recycle
your waste
• City of Pasadena: 75% of construction waste has to be
recycled
• EU has directives shooting for 70% recycling, though
they include soil
3.
Corporations Responding:Example 1
Armstrong Recycling Program
• In operation since 1999
• Armstrong takes back old tiles
(of course select types and no
asbestos)
4.
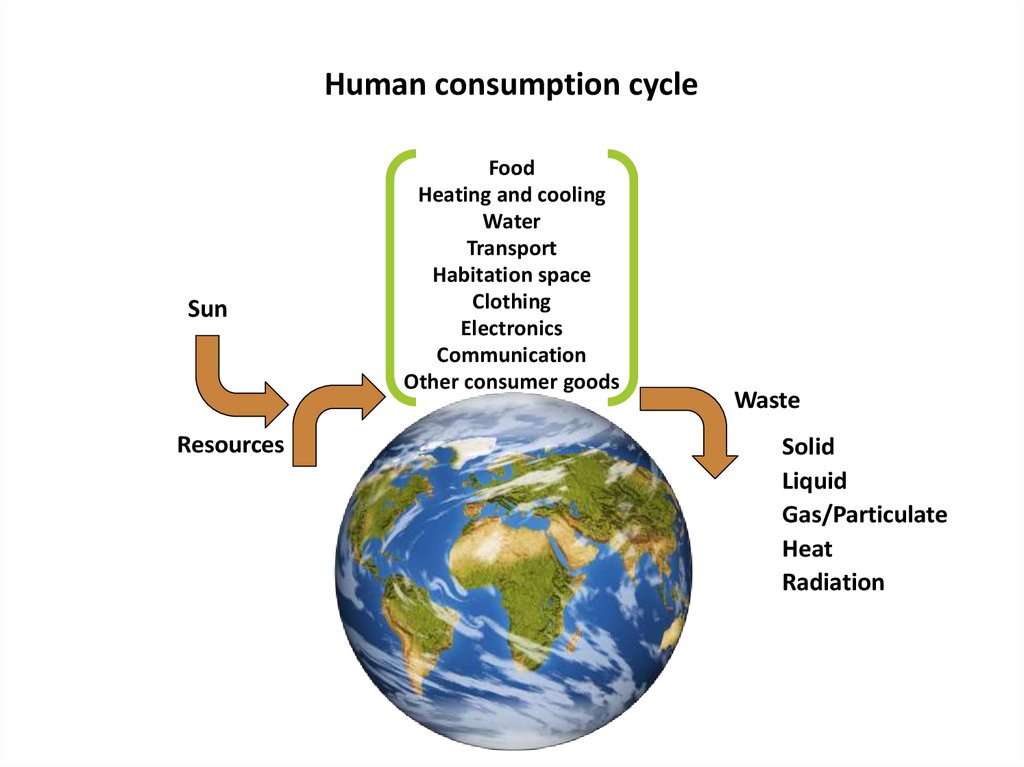
Human consumption cycleSun
Resources
Food
Heating and cooling
Water
Transport
Habitation space
Clothing
Electronics
Communication
Other consumer goods
Waste
Solid
Liquid
Gas/Particulate
Heat
Radiation
5.
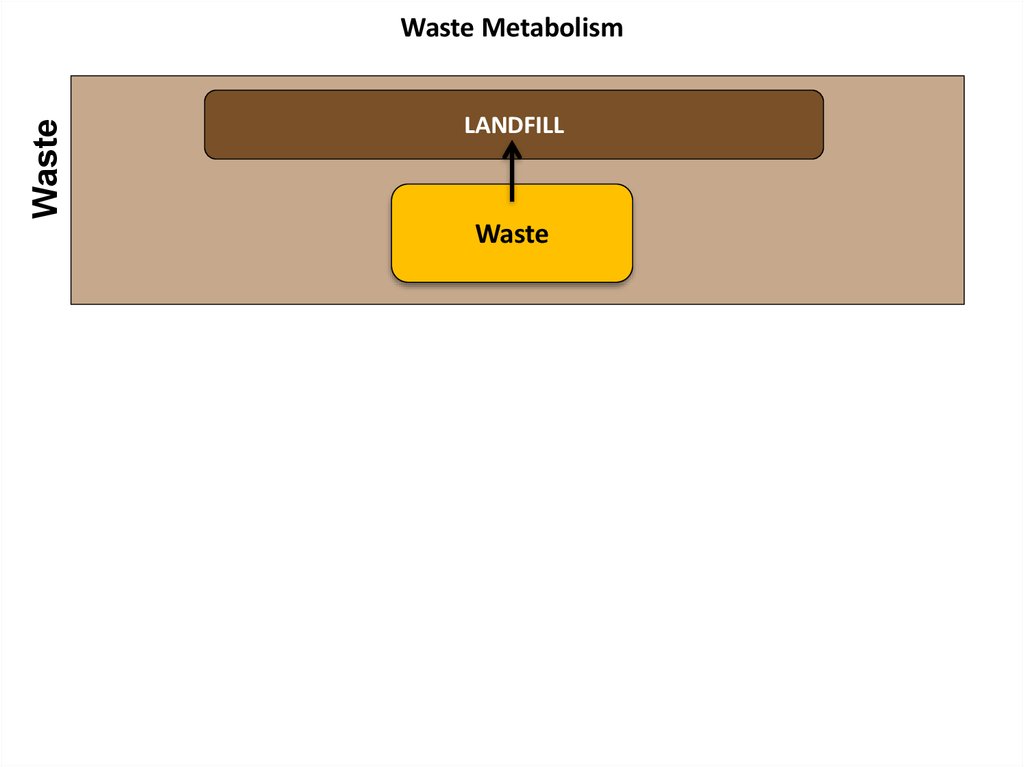
WasteWaste Metabolism
LANDFILL
Waste
6.
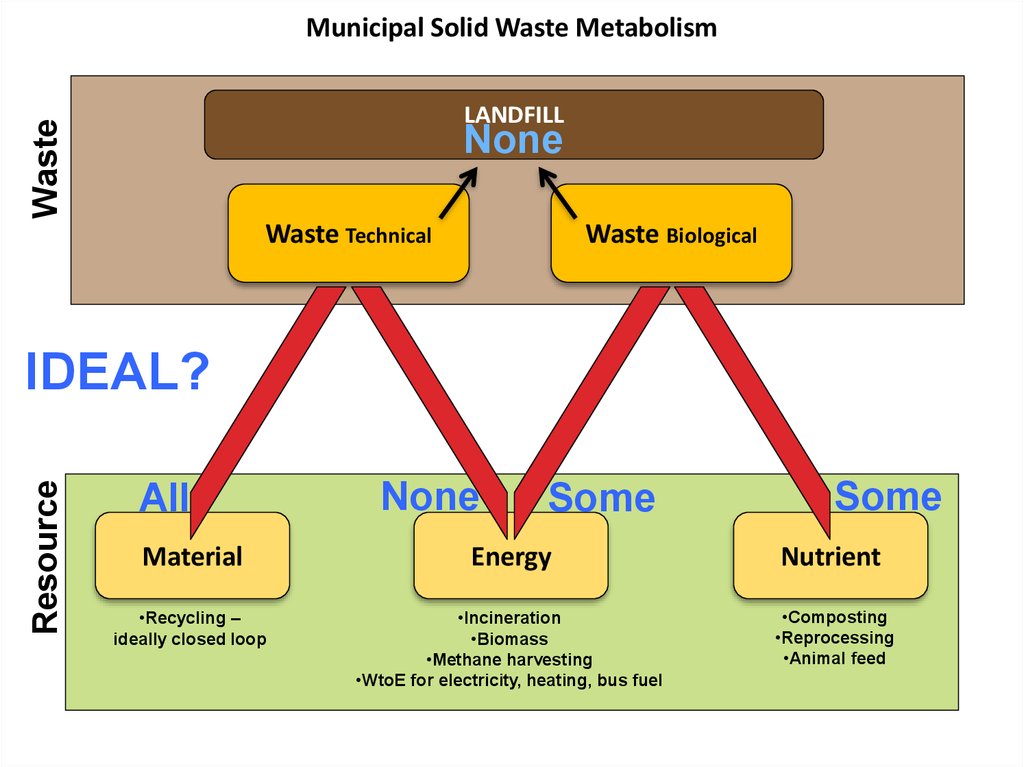
Municipal Solid Waste MetabolismWaste
LANDFILL
None
Waste Technical
Waste Biological
Resource
IDEAL?
All
None
Some
Some
Material
Energy
Nutrient
•Recycling –
ideally closed loop
•Incineration
•Biomass
•Methane harvesting
•WtoE for electricity, heating, bus fuel
•Composting
•Reprocessing
•Animal feed
7.
ResourcesRecommended reading
available online, free of
charge
Sun
8.
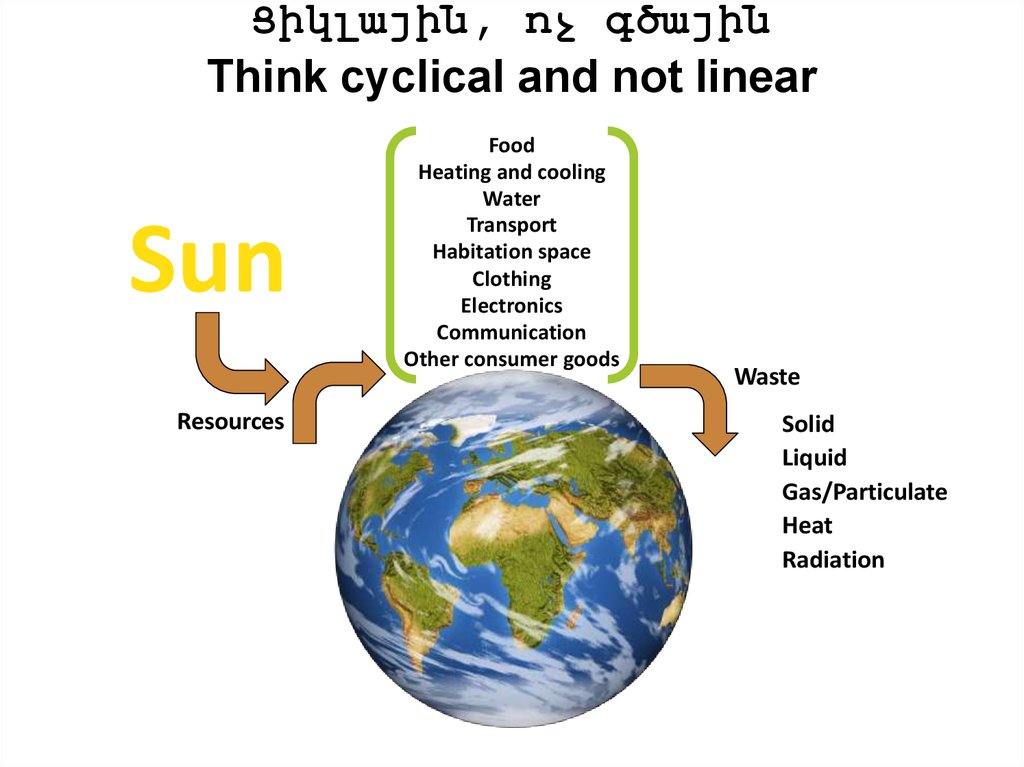
Ցիկլային, ոչ գծայինThink cyclical and not linear
Sun
Resources
Food
Heating and cooling
Water
Transport
Habitation space
Clothing
Electronics
Communication
Other consumer goods
Waste
Solid
Liquid
Gas/Particulate
Heat
Radiation
9.
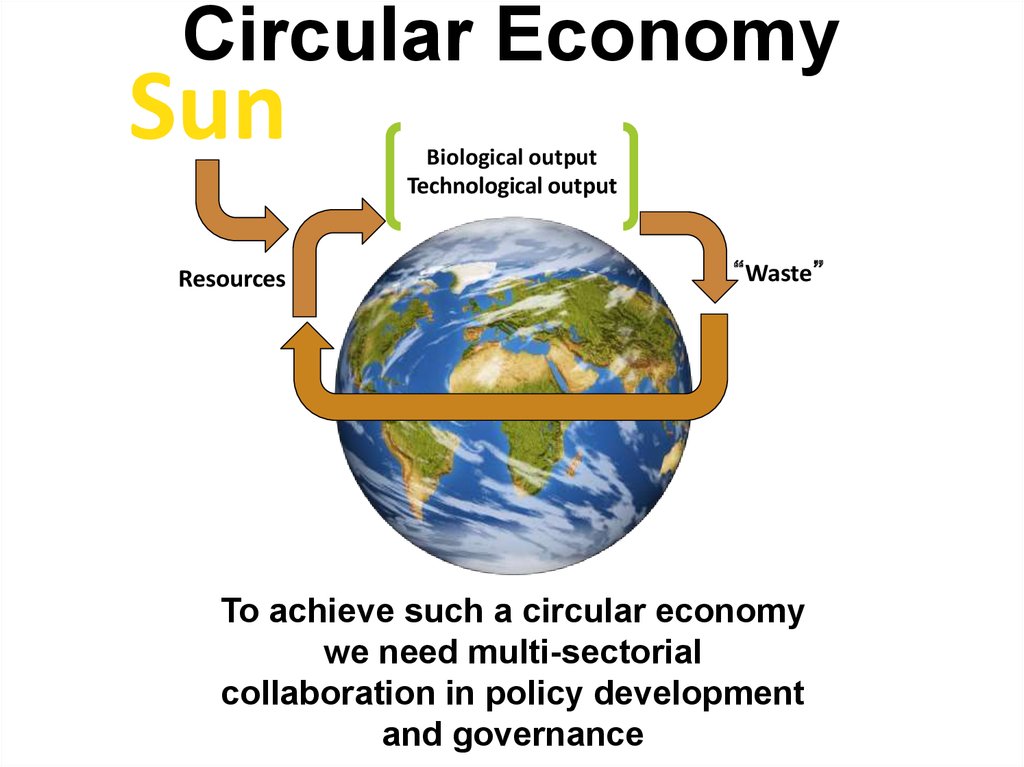
Circular EconomySun
Resources
Biological output
Technological output
“Waste”
To achieve such a circular economy
we need multi-sectorial
collaboration in policy development
and governance
10.
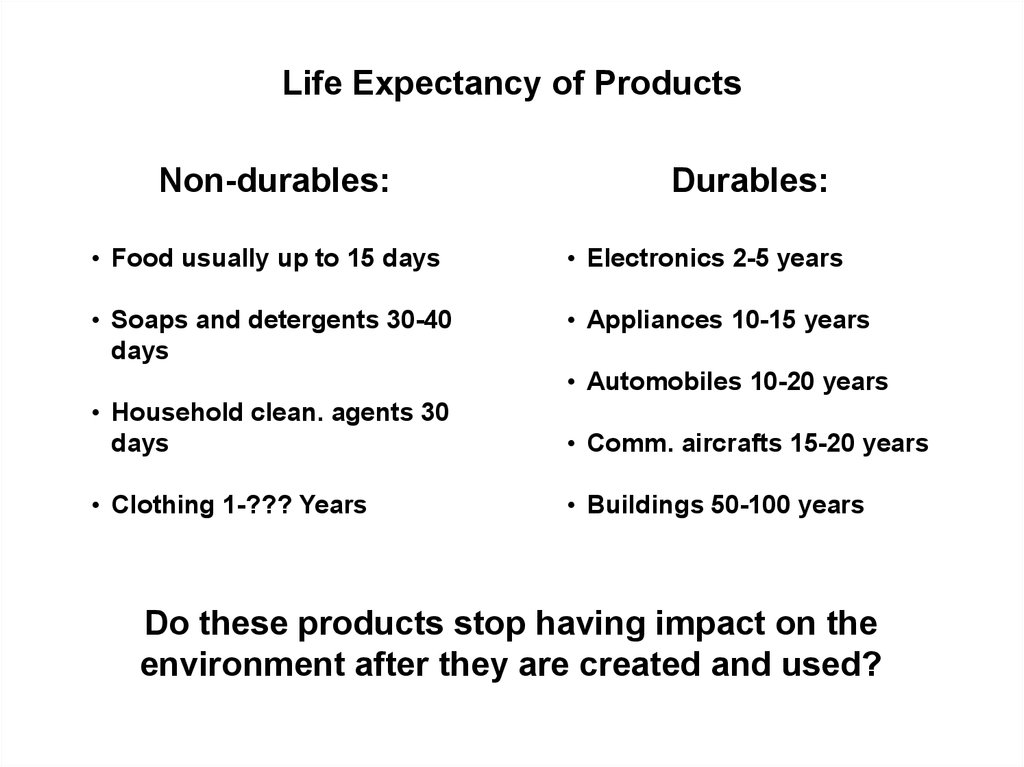
Life Expectancy of ProductsNon-durables:
Durables:
• Food usually up to 15 days
• Electronics 2-5 years
• Soaps and detergents 30-40
days
• Appliances 10-15 years
• Automobiles 10-20 years
• Household clean. agents 30
days
• Comm. aircrafts 15-20 years
• Clothing 1-??? Years
• Buildings 50-100 years
Do these products stop having impact on the
environment after they are created and used?
11.
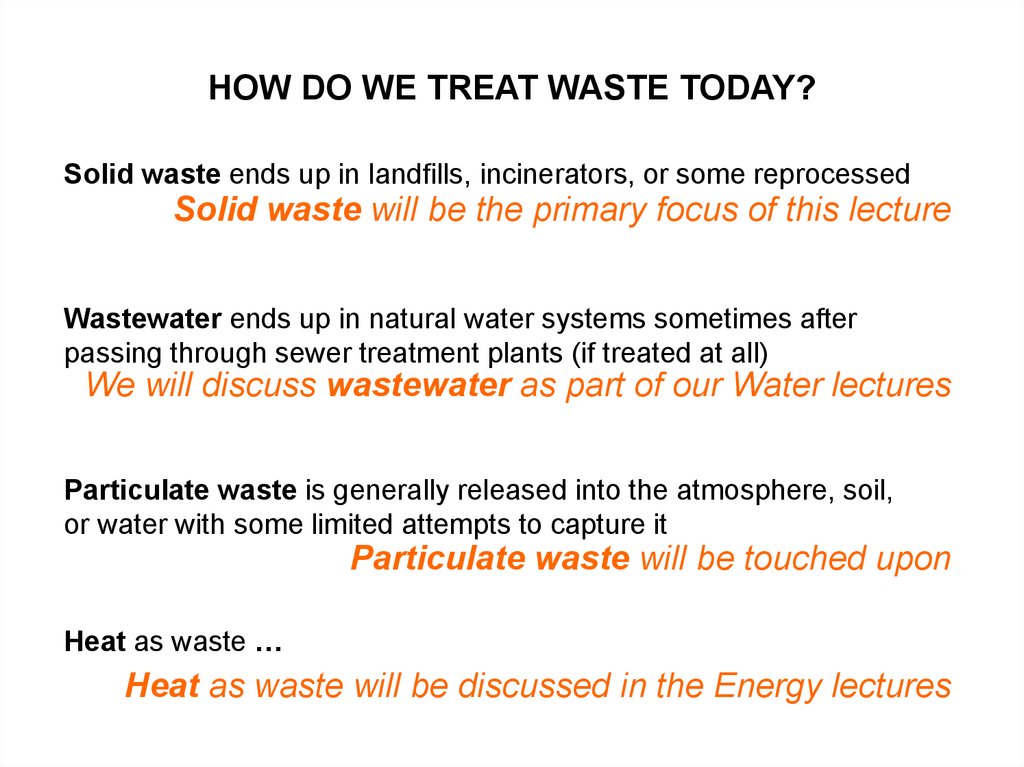
HOW DO WE TREAT WASTE TODAY?Solid waste ends up in landfills, incinerators, or some reprocessed
Solid waste will be the primary focus of this lecture
Wastewater ends up in natural water systems sometimes after
passing through sewer treatment plants (if treated at all)
We will discuss wastewater as part of our Water lectures
Particulate waste is generally released into the atmosphere, soil,
or water with some limited attempts to capture it
Particulate waste will be touched upon
Heat as waste …
Heat as waste will be discussed in the Energy lectures
12.
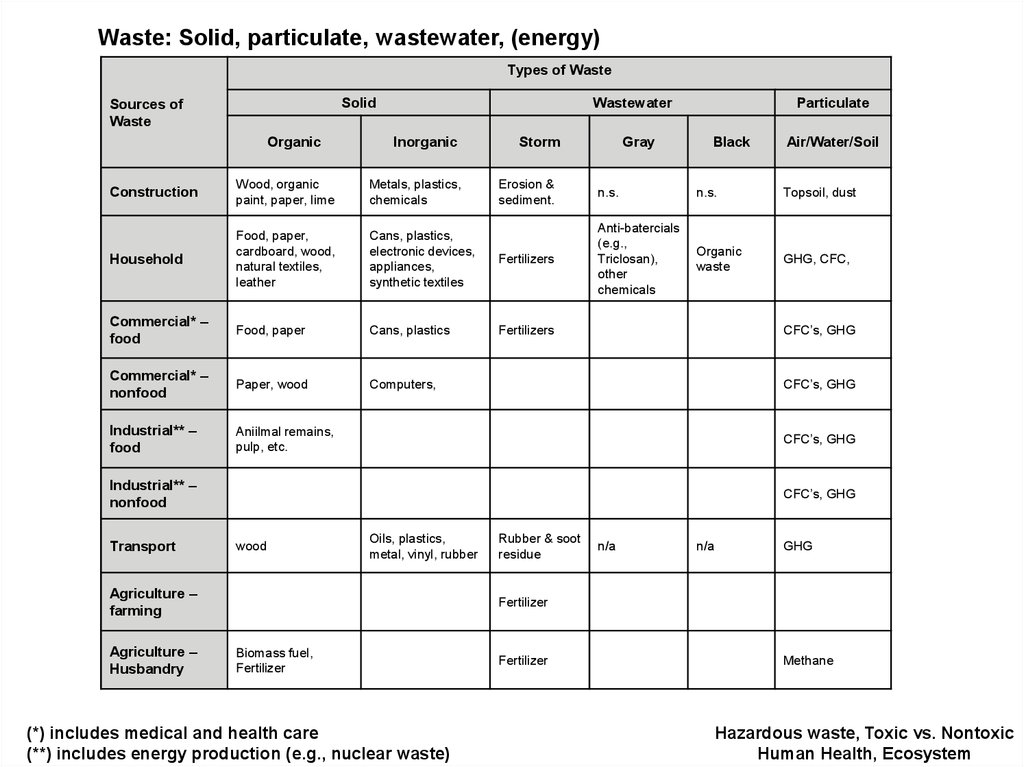
Waste: Solid, particulate, wastewater, (energy)Types of Waste
Solid
Sources of
Waste
Organic
Wastewater
Inorganic
Construction
Wood, organic
paint, paper, lime
Metals, plastics,
chemicals
Household
Food, paper,
cardboard, wood,
natural textiles,
leather
Commercial* –
food
Storm
Gray
Particulate
Black
Air/Water/Soil
Erosion &
sediment.
n.s.
n.s.
Topsoil, dust
Cans, plastics,
electronic devices,
appliances,
synthetic textiles
Fertilizers
Anti-batercials
(e.g.,
Triclosan),
other
chemicals
Organic
waste
GHG, CFC,
Food, paper
Cans, plastics
Fertilizers
Commercial* –
nonfood
Paper, wood
Computers,
Industrial** –
food
Aniilmal remains,
pulp, etc.
CFC’s, GHG
CFC’s, GHG
CFC’s, GHG
Industrial** –
nonfood
Transport
CFC’s, GHG
wood
Oils, plastics,
metal, vinyl, rubber
Agriculture –
farming
Agriculture –
Husbandry
Rubber & soot
residue
n/a
n/a
GHG
Fertilizer
Biomass fuel,
Fertilizer
(*) includes medical and health care
(**) includes energy production (e.g., nuclear waste)
Fertilizer
Methane
Hazardous waste, Toxic vs. Nontoxic
Human Health, Ecosystem
13.
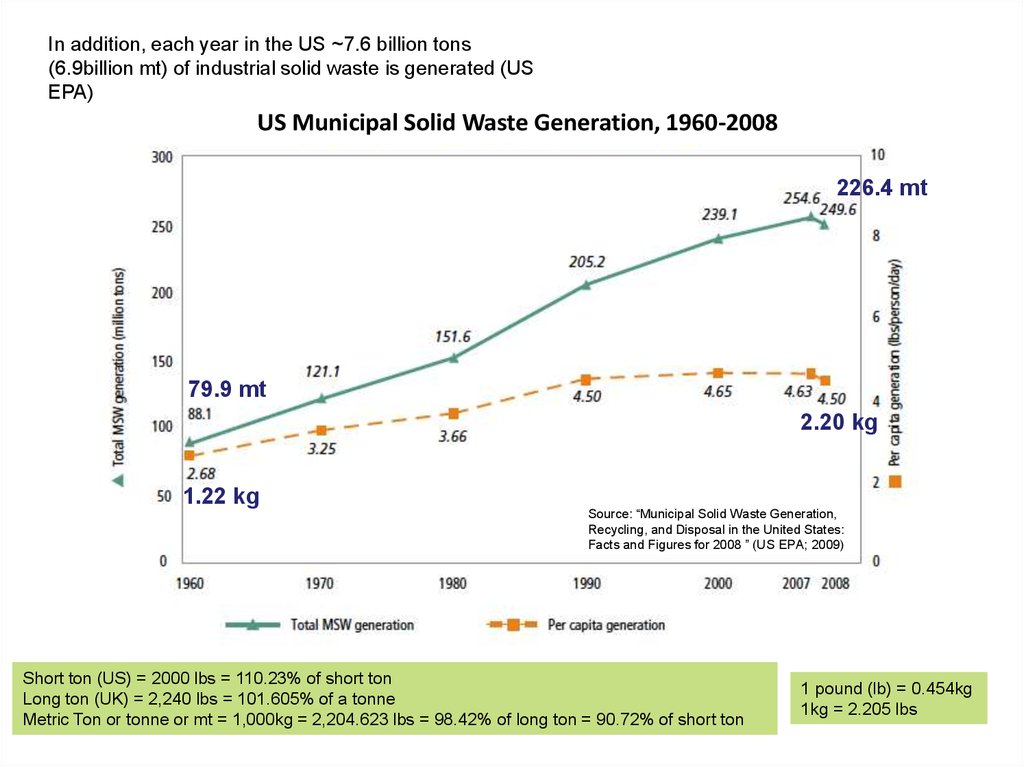
In addition, each year in the US ~7.6 billion tons(6.9billion mt) of industrial solid waste is generated (US
EPA)
US Municipal Solid Waste Generation, 1960-2008
226.4 mt
79.9 mt
2.20 kg
1.22 kg
Source: “Municipal Solid Waste Generation,
Recycling, and Disposal in the United States:
Facts and Figures for 2008 ” (US EPA; 2009)
Short ton (US) = 2000 lbs = 110.23% of short ton
Long ton (UK) = 2,240 lbs = 101.605% of a tonne
Metric Ton or tonne or mt = 1,000kg = 2,204.623 lbs = 98.42% of long ton = 90.72% of short ton
1 pound (lb) = 0.454kg
1kg = 2.205 lbs
14.
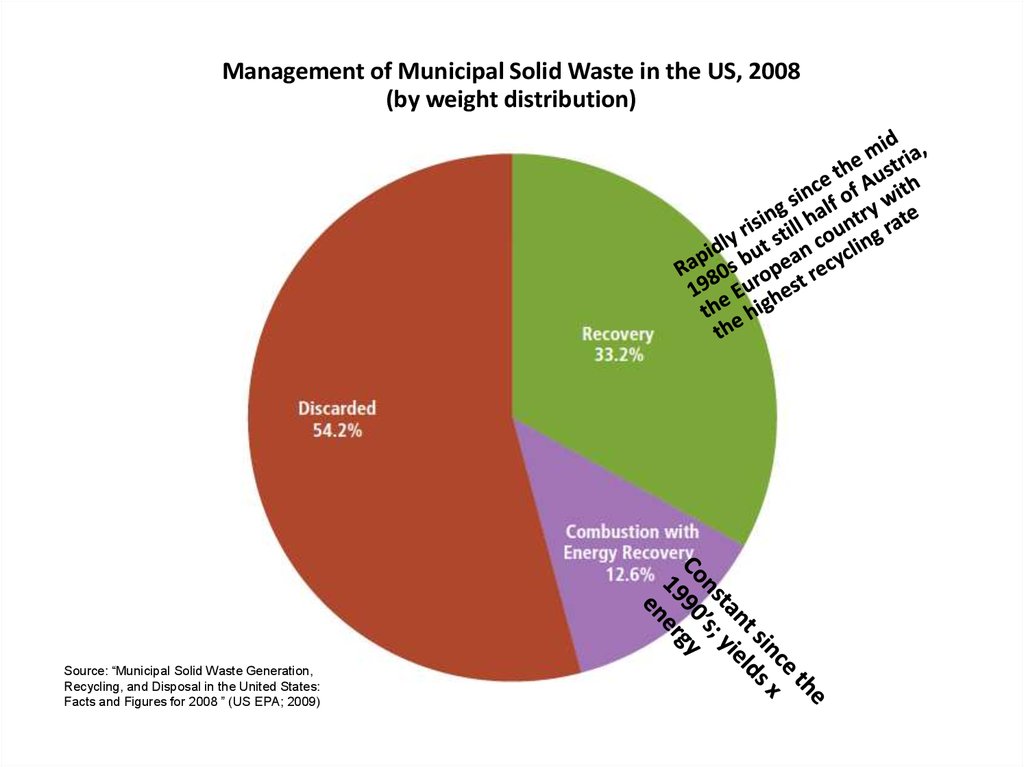
Management of Municipal Solid Waste in the US, 2008(by weight distribution)
Source: “Municipal Solid Waste Generation,
Recycling, and Disposal in the United States:
Facts and Figures for 2008 ” (US EPA; 2009)
15.
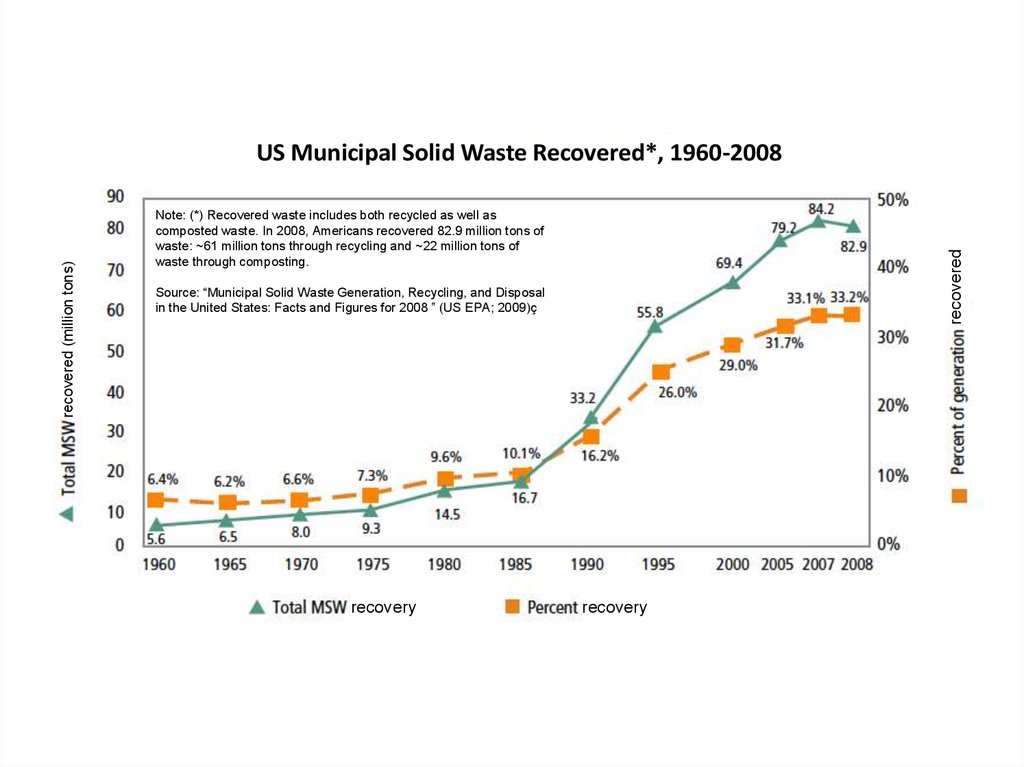
Note: (*) Recovered waste includes both recycled as well ascomposted waste. In 2008, Americans recovered 82.9 million tons of
waste: ~61 million tons through recycling and ~22 million tons of
waste through composting.
recovered
recovered (million tons)
US Municipal Solid Waste Recovered*, 1960-2008
Source: “Municipal Solid Waste Generation, Recycling, and Disposal
in the United States: Facts and Figures for 2008 ” (US EPA; 2009)ç
recovery
recovery
16.
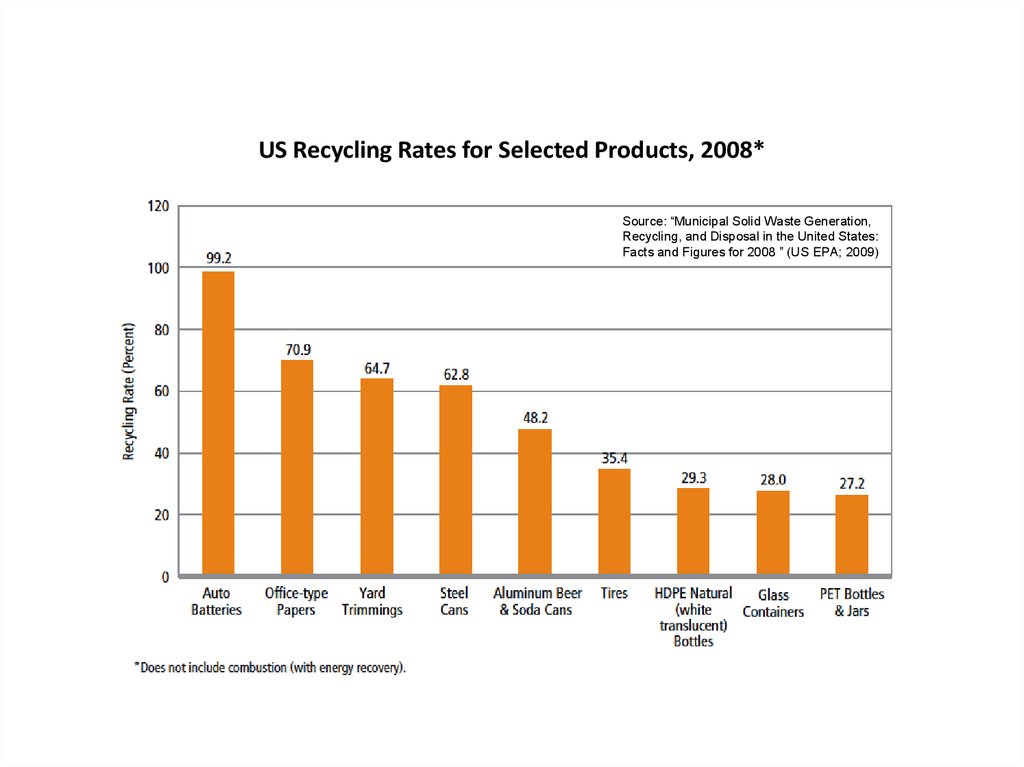
US Recycling Rates for Selected Products, 2008*Source: “Municipal Solid Waste Generation,
Recycling, and Disposal in the United States:
Facts and Figures for 2008 ” (US EPA; 2009)
17.
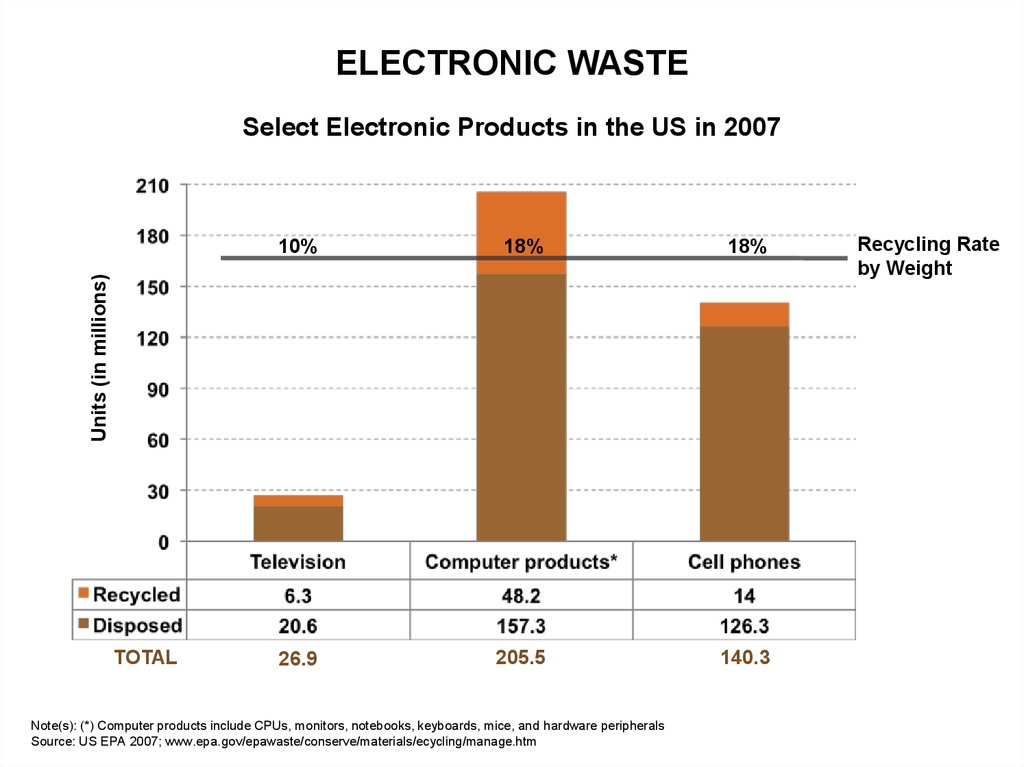
ELECTRONIC WASTESelect Electronic Products in the US in 2007
18%
18%
26.9
205.5
140.3
Units (in millions)
10%
TOTAL
Note(s): (*) Computer products include CPUs, monitors, notebooks, keyboards, mice, and hardware peripherals
Source: US EPA 2007; www.epa.gov/epawaste/conserve/materials/ecycling/manage.htm
Recycling Rate
by Weight
18.
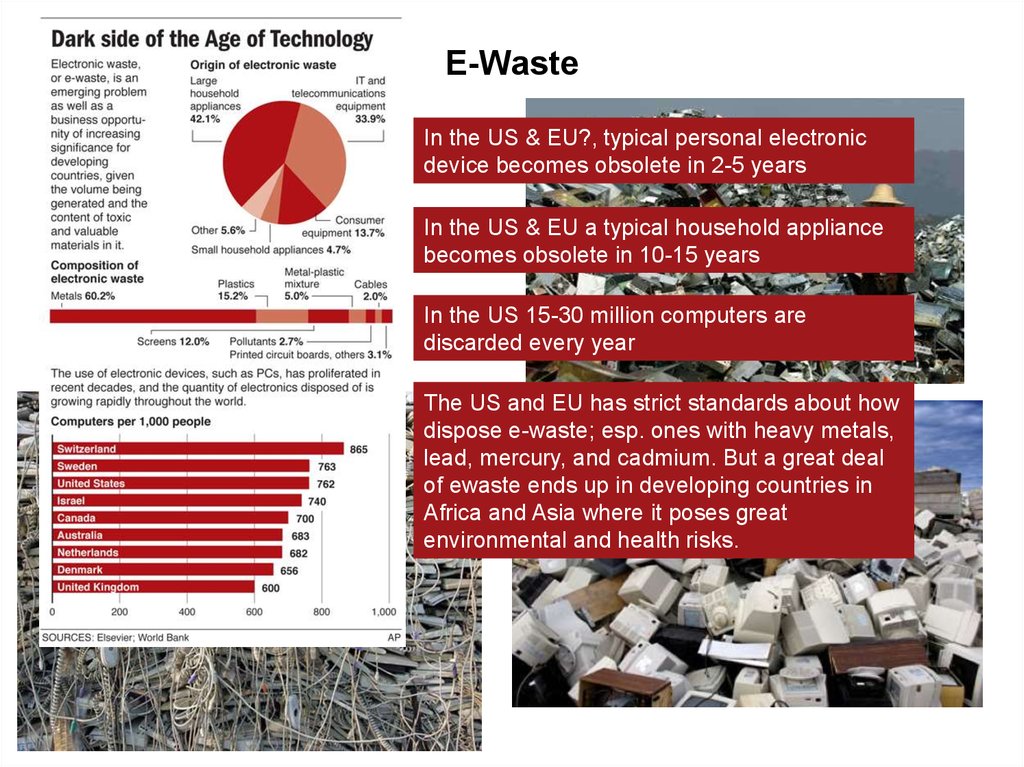
E-WasteIn the US & EU?, typical personal electronic
device becomes obsolete in 2-5 years
In the US & EU a typical household appliance
becomes obsolete in 10-15 years
In the US 15-30 million computers are
discarded every year
The US and EU has strict standards about how
dispose e-waste; esp. ones with heavy metals,
lead, mercury, and cadmium. But a great deal
of ewaste ends up in developing countries in
Africa and Asia where it poses great
environmental and health risks.
19.
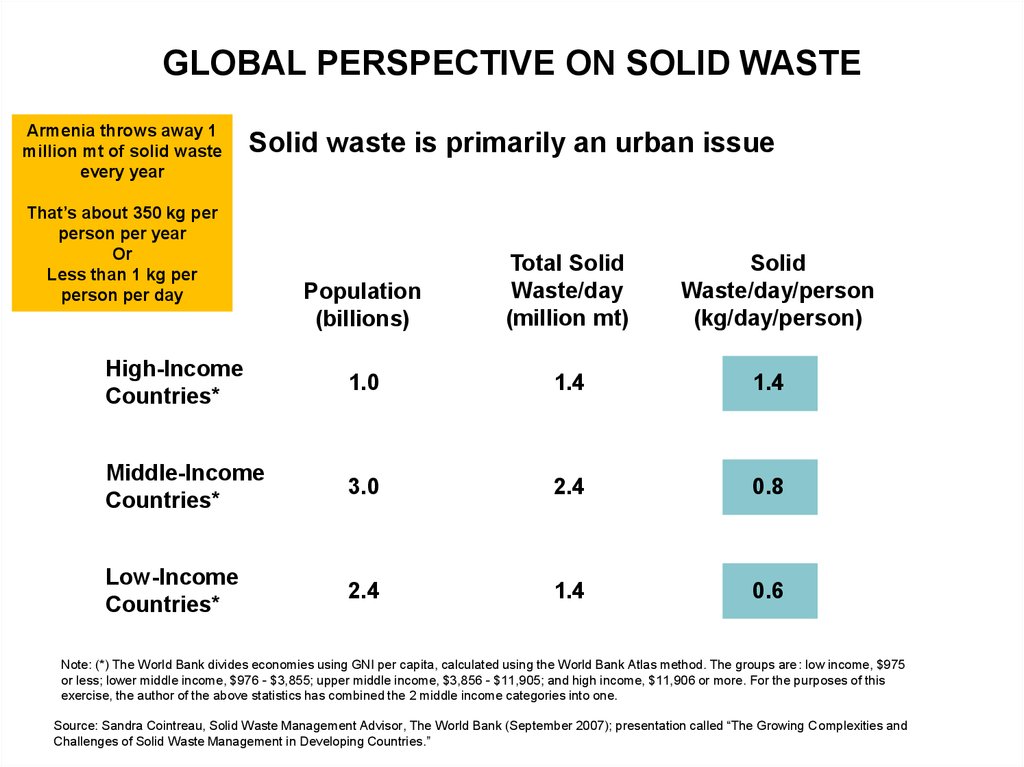
GLOBAL PERSPECTIVE ON SOLID WASTEArmenia throws away 1
million mt of solid waste
every year
Solid waste is primarily an urban issue
That’s about 350 kg per
person per year
Or
Less than 1 kg per
person per day
Population
(billions)
Total Solid
Waste/day
(million mt)
Solid
Waste/day/person
(kg/day/person)
High-Income
Countries*
1.0
1.4
1.4
Middle-Income
Countries*
3.0
2.4
0.8
Low-Income
Countries*
2.4
1.4
0.6
Note: (*) The World Bank divides economies using GNI per capita, calculated using the World Bank Atlas method. The groups are: low income, $975
or less; lower middle income, $976 - $3,855; upper middle income, $3,856 - $11,905; and high income, $11,906 or more. For the purposes of this
exercise, the author of the above statistics has combined the 2 middle income categories into one.
Source: Sandra Cointreau, Solid Waste Management Advisor, The World Bank (September 2007); presentation called “The Growing Complexities and
Challenges of Solid Waste Management in Developing Countries.”
20.
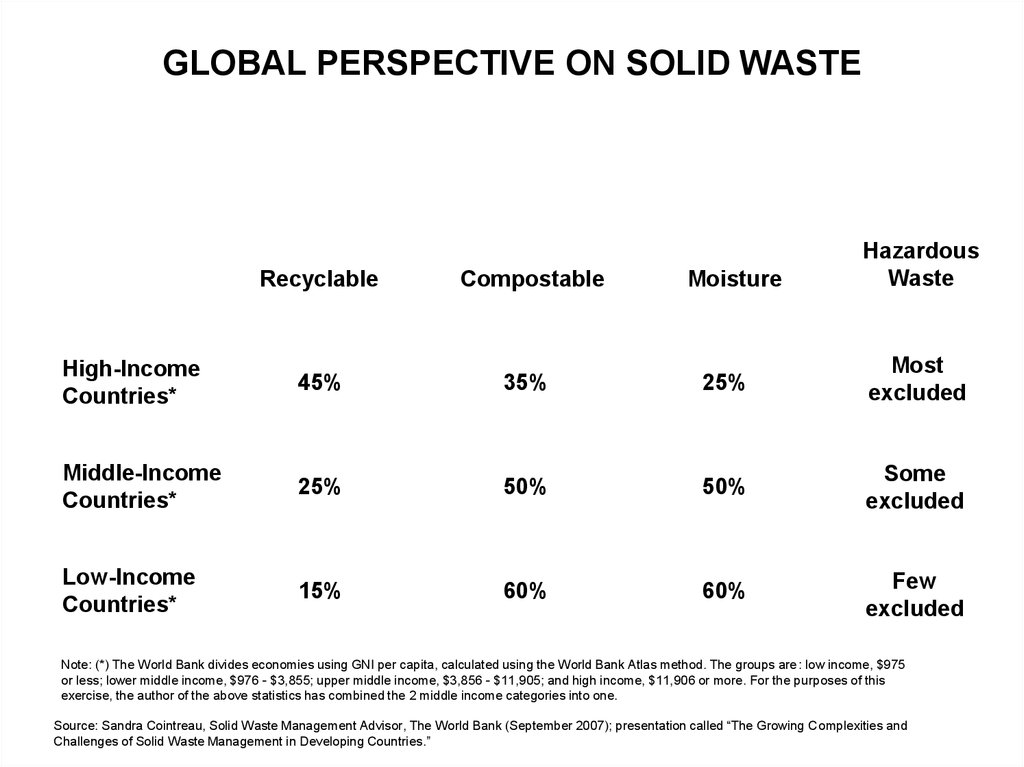
GLOBAL PERSPECTIVE ON SOLID WASTEMoisture
Hazardous
Waste
Recyclable
Compostable
High-Income
Countries*
45%
35%
25%
Most
excluded
Middle-Income
Countries*
25%
50%
50%
Some
excluded
Low-Income
Countries*
15%
60%
60%
Few
excluded
Note: (*) The World Bank divides economies using GNI per capita, calculated using the World Bank Atlas method. The groups are: low income, $975
or less; lower middle income, $976 - $3,855; upper middle income, $3,856 - $11,905; and high income, $11,906 or more. For the purposes of this
exercise, the author of the above statistics has combined the 2 middle income categories into one.
Source: Sandra Cointreau, Solid Waste Management Advisor, The World Bank (September 2007); presentation called “The Growing Complexities and
Challenges of Solid Waste Management in Developing Countries.”
21.
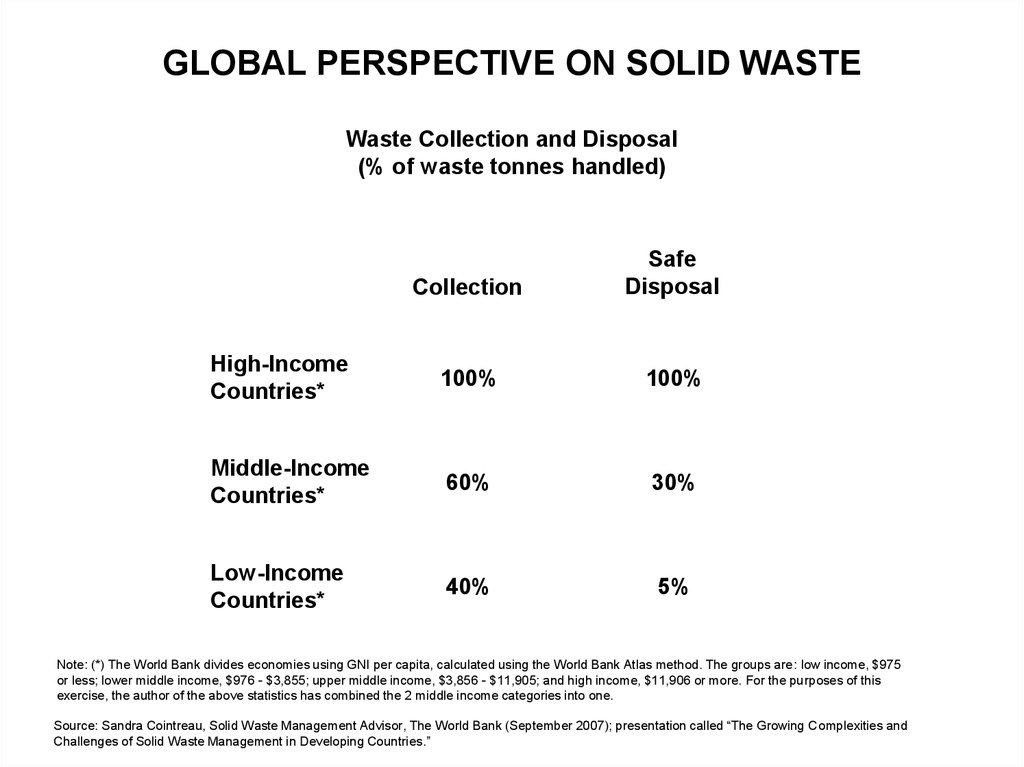
GLOBAL PERSPECTIVE ON SOLID WASTEWaste Collection and Disposal
(% of waste tonnes handled)
Collection
Safe
Disposal
High-Income
Countries*
100%
100%
Middle-Income
Countries*
60%
30%
Low-Income
Countries*
40%
5%
Note: (*) The World Bank divides economies using GNI per capita, calculated using the World Bank Atlas method. The groups are: low income, $975
or less; lower middle income, $976 - $3,855; upper middle income, $3,856 - $11,905; and high income, $11,906 or more. For the purposes of this
exercise, the author of the above statistics has combined the 2 middle income categories into one.
Source: Sandra Cointreau, Solid Waste Management Advisor, The World Bank (September 2007); presentation called “The Growing Complexities and
Challenges of Solid Waste Management in Developing Countries.”
22.
INCOME AND SOLID WASTECOLLECTION & RECYCLING IN A DEVELOPING COUNTRY CONTEXT
Curitiba's citizens separate their trash into just two categories, organic and inorganic, for pick-up by two kinds of
trucks. Poor families in squatter settlements that are unreachable by trucks bring their trash bags to neighborhood
centers, where they can exchange them for bus tickets or for eggs, milk, oranges and potatoes, all bought from
outlying farms.
The trash goes to a plant (itself built of recycled materials) that
employs people to separate bottles from cans from plastic.
The workers are handicapped people, recent immigrants,
alcoholics.
Recovered materials are sold to local industries. Styrofoam is
shredded to stuff quilt for the poor. The recycling program
costs no more than the old landfill, but the city is cleaner,
there are more jobs, farmers are supported and the poor get
food and transportation. Curitiba recycles two-thirds of it
garbage - one of the highest rates of any city, north or south.
Source: http://www.globalideasbank.org/site/bank/idea.php?ideaId=2236:
23.
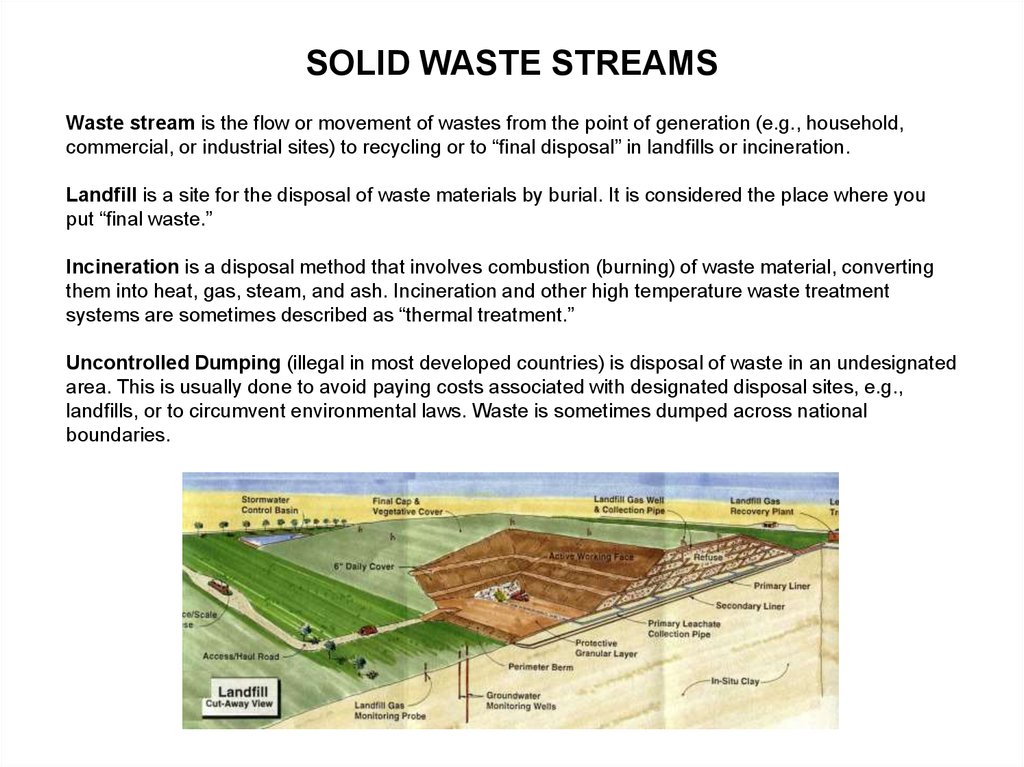
SOLID WASTE STREAMSWaste stream is the flow or movement of wastes from the point of generation (e.g., household,
commercial, or industrial sites) to recycling or to “final disposal” in landfills or incineration.
Landfill is a site for the disposal of waste materials by burial. It is considered the place where you
put “final waste.”
Incineration is a disposal method that involves combustion (burning) of waste material, converting
them into heat, gas, steam, and ash. Incineration and other high temperature waste treatment
systems are sometimes described as “thermal treatment.”
Uncontrolled Dumping (illegal in most developed countries) is disposal of waste in an undesignated
area. This is usually done to avoid paying costs associated with designated disposal sites, e.g.,
landfills, or to circumvent environmental laws. Waste is sometimes dumped across national
boundaries.
24.
SOLID WASTE STREAMSMost waste disposal systems identify various waste streams and regulate each stream
using different rules.
Examples:
• Daily household & commercial waste
• Construction and demolition
• Industrial
• Biodegradable waste
• Hazardous Waste (Chemical waste; Biomedical waste)
• Bulky waste
• Food service grease waste
• Nuclear
• Etc.
Many countries have laws governing hazardous waste streams. Most countries are also
signatories to the Basel Convention.
25.
WASTEDOMAIN
NON-WASTE
DOMAIN
PRODUCTION & WASTE
Raw
material
extraction
Raw
materials
Waste
Production
of
intermediate
goods
Products,
materials &
components
Production
of final
goods
Waste
Final
consumption
/use directly
in the
environment
Products
Waste
COMPOSTING
Secondary
products/materials
Waste
Operations for
reuse and
recycle
Waste
products/
materials
Collection and sorting
Final
Waste
DUMPING
Methane
Thermal
treatment
Final Waste
Landfill
Leachate
Source: “Study on the Selection of Waste Streams for End of Waste Assessment: Final Report” (IPTS, Joint Research Centre, European Commission;
2009); modified by Alen Amirkhanian for educational purposes
26.
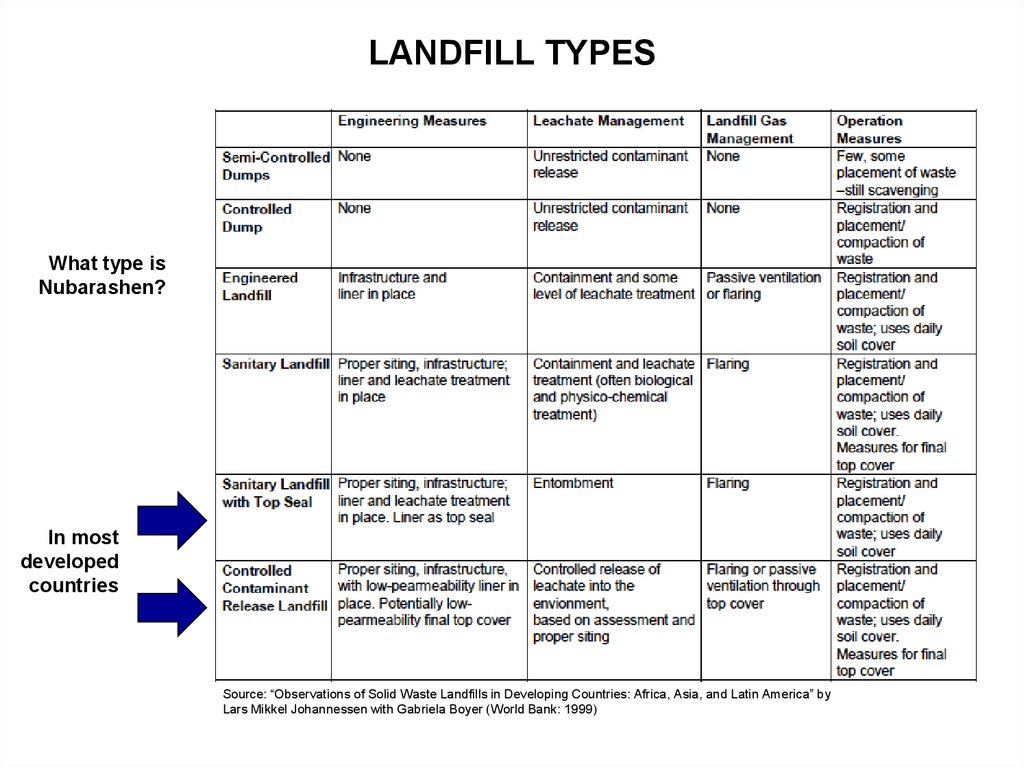
LANDFILL TYPESWhat type is
Nubarashen?
In most
developed
countries
Source: “Observations of Solid Waste Landfills in Developing Countries: Africa, Asia, and Latin America” by
Lars Mikkel Johannessen with Gabriela Boyer (World Bank: 1999)
27.
Landfill Environmental Issues (Overview)Five environmental issues with landfill:
1. Almost always we burn fossil fuel to get the waste to the landfill
2. Landfills generate greenhouse gases (GHGs), including methane, …
3. Landfills generate leachate, liquid that drains or 'leaches' from a
landfill; its composition varies depending on the age of the landfill
and the type of waste that the landfill contains. It can usually contain
both dissolved and suspended materials.
4. Landfills take up land that is difficult to restore it to its original
condition after the landfill is closed.
5. Landfills do a very poor job of returning natural resources back to
nature.
28.
Landfill Environmental Issues (1)We burn fossil fuel (usually diesel fuel) to get the waste to landfills
GARBAGE TRUCK FACTS1
An estimated 136,000 garbage trucks, 12,000 transfer vehicles, and 31,000 dedicated
recycling vehicles haul away America’s garbage (179,000 vehicles in total).
An average garbage truck travels 25,000 miles (40,000 km) annually, gets less than 3 miles
per gallon (79 liters per 100km), and uses approximately 8,600 gallons of fuel each year.
Over 40% of garbage trucks are over 10 years old, making it the oldest fleet in the US.
The average diesel-powered garbage truck costs over $170,000 and is not retired for 12 years.
The garbage truck sector alone is responsible for consuming approximately 1 billion gallons
(or 3.8 billion liters) of diesel fuel annually, representing nearly 3% of total diesel fuel
consumed in the US.
CO2 emissions from a gallon of diesel =
2,778 grams x 0.99 x (44/12) = 10.1 kg/gallon = 22.2 pounds/gallon
US garbage fleet generates 10 billion kg (10 million mt) of CO2 every year
Sources:
(1)Cannon, James, S., “Greening Garbage Trucks: Trends in Alternative Fuel Use, 2002 – 2005 (INFORM Inc., 2006)
(2)US EPA citing Intergovernmental Panel on Climate Change (IPCC) methodology: http://www.epa.gov/oms/climate/420f05001.htm
29.
Landfill Environmental Issues (2)Landfills generate greenhouse gases (GHGs):
• The GHG most associated with landfills is methane (CH4), although some CO2 is also
generated.
• This happens because of the anaerobic digestion of the deposits by micro-organisms.
• There have been a few cases of explosions at landfills but these have been very rare
because most landfills manage their methane emissions by:
− Venting
− Flaring
− Generating energy
• Of these methane mitigation measures, venting is the worst option. Methane is 20+
times more damaging as a GHG than CO2.
30.
Landfill Environmental Issues (3)• Landfills generate LEACHATE, liquid that drains or 'leaches' from a landfill;
• Its composition varies depending on the age of the landfill and the type of
waste that the landfill contains.
• It can usually contain both dissolved and suspended materials.
The greatest environmental risks occur in the discharges
from older sites constructed before modern engineering
standards became mandatory and also from sites in the
developing world where modern standards have not been
applied.
There are also substantial risks from illegal sites and adhoc sites used by criminal gangs to dispose of waste
materials.
Leachate streams running directly into the aquatic
environment have both an acute and chronic impact on
the environment which may be very severe and can
severely diminish bio-diversity and greatly reduce
populations of sensitive species. Where toxic metals and
organics are present this can lead to chronic toxin
accumulation in both local and far distant populations.
Rivers impacted by leachate are often yellow in
appearance and often support severe overgrowths of
sewage fungus.
Example of modern leachate
management in Cancun, Mexcio
31.
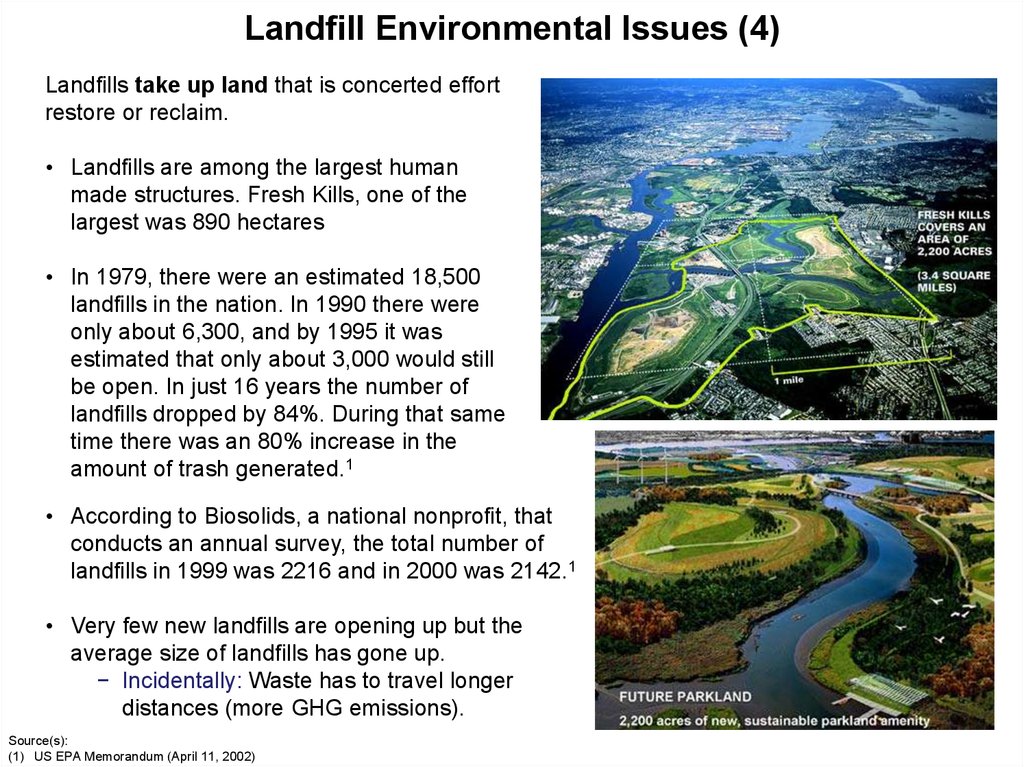
Landfill Environmental Issues (4)Landfills take up land that is concerted effort
restore or reclaim.
• Landfills are among the largest human
made structures. Fresh Kills, one of the
largest was 890 hectares
• In 1979, there were an estimated 18,500
landfills in the nation. In 1990 there were
only about 6,300, and by 1995 it was
estimated that only about 3,000 would still
be open. In just 16 years the number of
landfills dropped by 84%. During that same
time there was an 80% increase in the
amount of trash generated.1
• According to Biosolids, a national nonprofit, that
conducts an annual survey, the total number of
landfills in 1999 was 2216 and in 2000 was 2142.1
• Very few new landfills are opening up but the
average size of landfills has gone up.
− Incidentally: Waste has to travel longer
distances (more GHG emissions).
Source(s):
(1) US EPA Memorandum (April 11, 2002)
32.
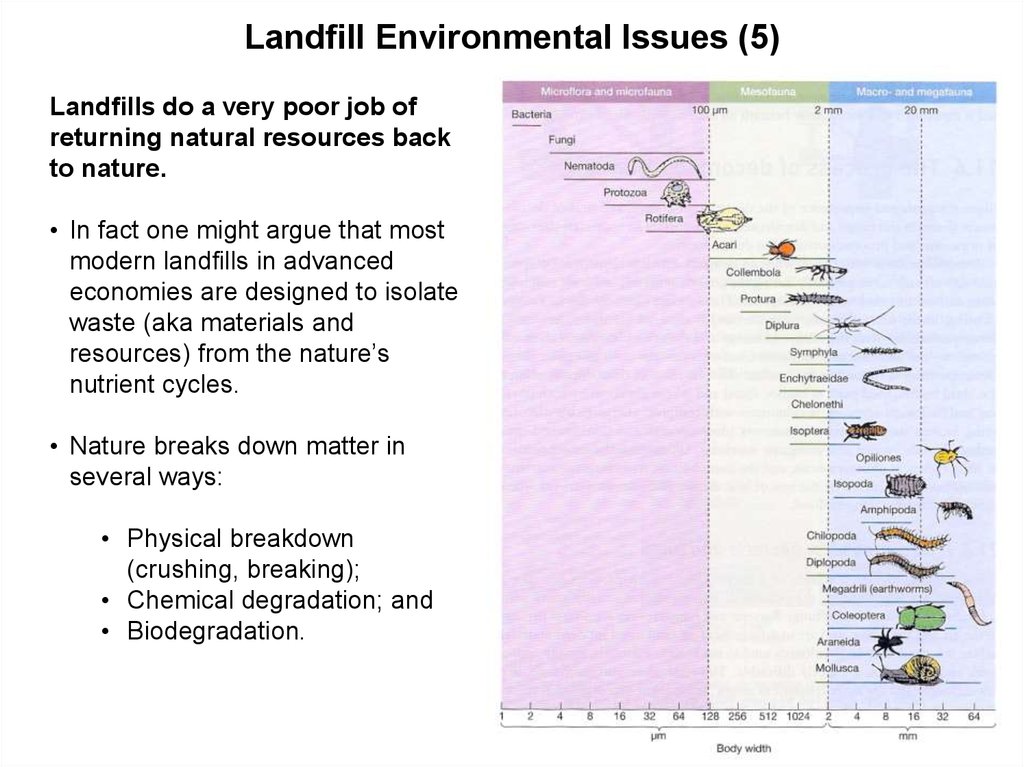
Landfill Environmental Issues (5)Landfills do a very poor job of
returning natural resources back
to nature.
• In fact one might argue that most
modern landfills in advanced
economies are designed to isolate
waste (aka materials and
resources) from the nature’s
nutrient cycles.
• Nature breaks down matter in
several ways:
• Physical breakdown
(crushing, breaking);
• Chemical degradation; and
• Biodegradation.
33.
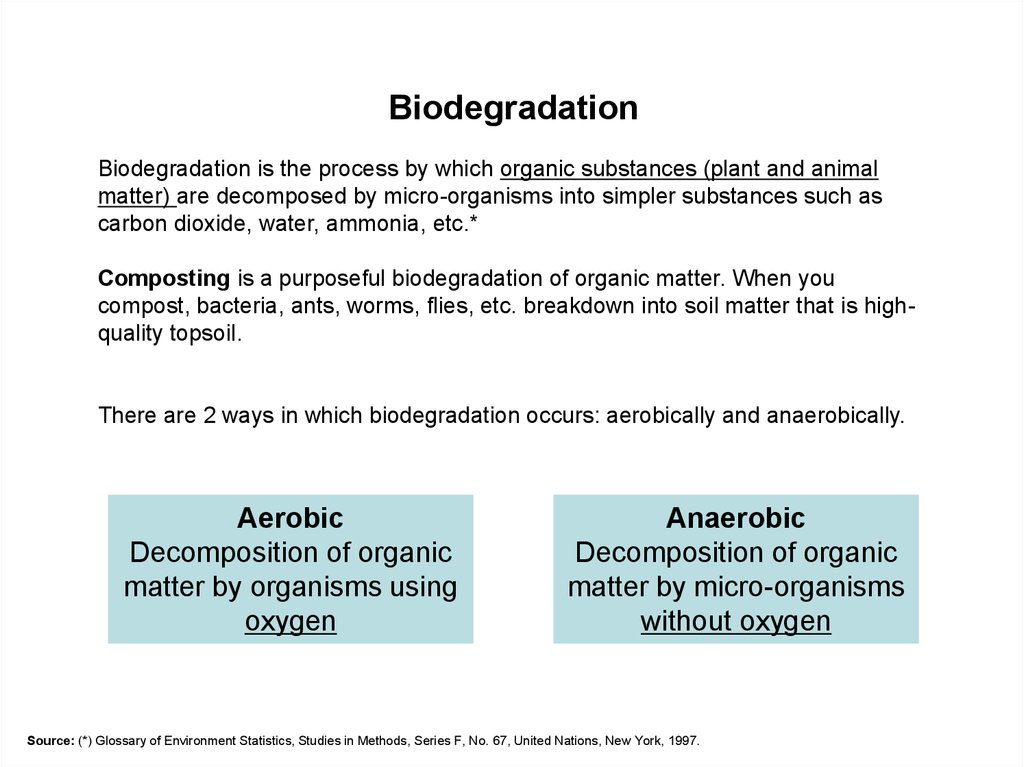
BiodegradationBiodegradation is the process by which organic substances (plant and animal
matter) are decomposed by micro-organisms into simpler substances such as
carbon dioxide, water, ammonia, etc.*
Composting is a purposeful biodegradation of organic matter. When you
compost, bacteria, ants, worms, flies, etc. breakdown into soil matter that is highquality topsoil.
There are 2 ways in which biodegradation occurs: aerobically and anaerobically.
Aerobic
Decomposition of organic
matter by organisms using
oxygen
Anaerobic
Decomposition of organic
matter by micro-organisms
without oxygen
Source: (*) Glossary of Environment Statistics, Studies in Methods, Series F, No. 67, United Nations, New York, 1997.
34.
The Garbage Project• The Garbage Project, was established by archeologist William Rathje in 1973 at the University
of Arizona.
• Rathje began applying archeological techniques to waste either in the form of fresh household
discards or as placed in a landfill. He called this field “garbology.”
• The Garbage Project explored fresh garbage and landfills across the United States and in
Canada, Mexico City and Sydney, Australia.
• His decades-long work on garbage has yielded some interesting findings:
− In times of shortages, people actually waste more of the food in short supply than
in normal times; he and his team were able to observe this in the early 70s with
meat and sugar shortages
− But most directly related to our current discussion, he came to realize that very
little biodegradation is taking place in the landfills:
He found newspapers that were intact after 30 years or so
Pretty well preserved steaks with fat, bone, and lean that were 15 years old
Overall, the volume of organic material recovered from US landfills by the Project
were very high: 32.5% of 15 year old garbage from Naples, Florida; 50% of 15 year
old garbage from Mallard North in Illinois; and 66% of the 15 year old garbage from
Rio Saldo in Arizona. The main exception was Fresh Kills in NY.
Source: Rathje, William and Cullen Murphy; “Rubbish!: The Archeology of Garbage” (2001)
35.
The Garbage Project• So there’s hardly any biodegradation going on in the landfills;
• With the bottom layers being compacted and covered you are creating
sealed conditions so aerobic degradation was ruled out.
• But not even anaerobic biodegradation was taking place!
• So much for biodegradable plastics; corn based utensils, bags, etc.
• All becomes marketing fluff if the biodegradables aren’t sorted and
composted properly
• And once composted, the question of where it should be finally
disposed is still open
36.
The Garbage Project• In Rathje’s re-telling of this story he points out to a fascinating aspect of their discovery:
It took them a long time to come to this conclusion and only when an outsider asked
an unsuspecting, innocent question did it occur to them what is happening.
“Casting his eyes over a stack of newspapers [the visitor] said ‘I though
newspapers were supposed to biodegrade.”
“Once broached, the subject of biodegradability became the topic of a major
research program.” (Rathje, p. 113) …
− This shows how a group of very intelligent and informed people can miss the obvious.
• This delay in thinking is even more interesting when considering all the corroborating evidence that
the researchers did already know:
− Environmental consultants reported that even though more than half of municipal waste was
theoretically biodegradable even after 20-30 years of a landfill closing, the soil settled no
more than a few feet
− Another clue: the methane production at a landfill in most cases no more than 50% of the
theoretical amount expected
− Rodolfo Lanciani, an archeologist in the 1880’s found and excavated an Ancient Roman
landfill and after 20 centuries “the smell from that polluted ground … was absolutely
unbearable …”
− People were sure it was happening, they would even add sludge to expedite the process
Source: Rathje, William and Cullen Murphy; “Rubbish!: The Archeology of Garbage” (2001)
37.
Living Organism Consumption CycleNutrients
Water
Sun
Air
Resource
Resources
Solid
Liquid
Gas/Particulate
Heat
38.
Now let’s get deeper into waste.Let’s think about the concept of Waste
It is very human.
Human metabolism has been, for the most part,
“linear.”
Nature, on the other hand, has “circular
metabolism”
Nature has no waste.
39.
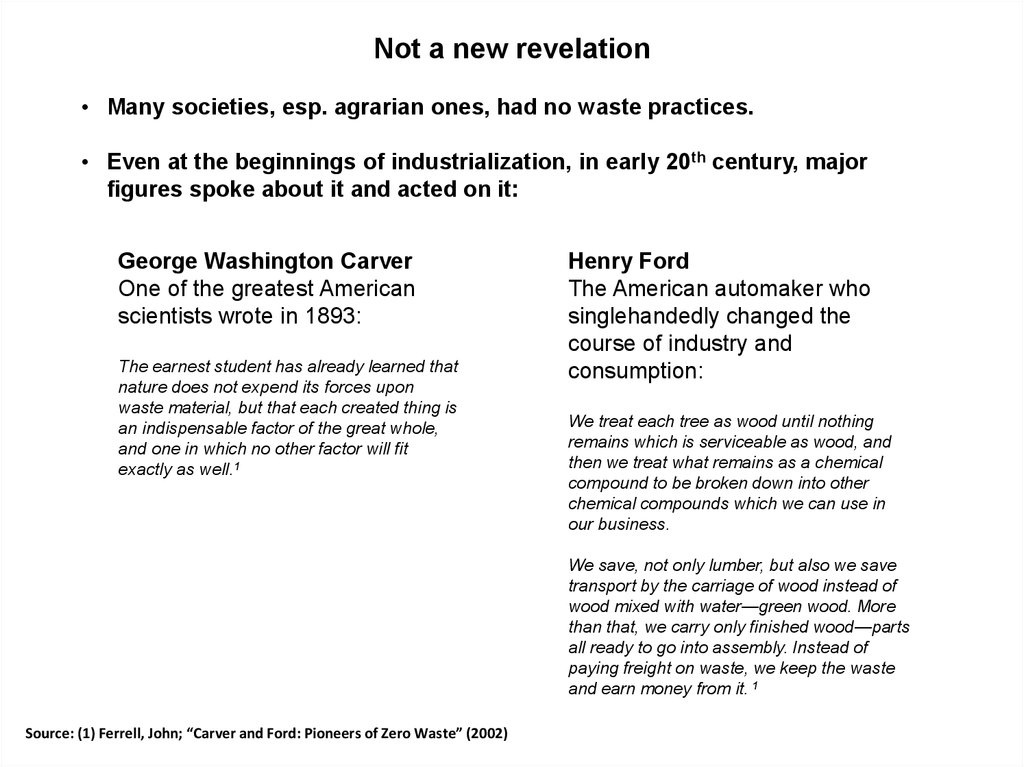
Not a new revelation• Many societies, esp. agrarian ones, had no waste practices.
• Even at the beginnings of industrialization, in early 20th century, major
figures spoke about it and acted on it:
George Washington Carver
One of the greatest American
scientists wrote in 1893:
The earnest student has already learned that
nature does not expend its forces upon
waste material, but that each created thing is
an indispensable factor of the great whole,
and one in which no other factor will fit
exactly as well.1
Henry Ford
The American automaker who
singlehandedly changed the
course of industry and
consumption:
We treat each tree as wood until nothing
remains which is serviceable as wood, and
then we treat what remains as a chemical
compound to be broken down into other
chemical compounds which we can use in
our business.
We save, not only lumber, but also we save
transport by the carriage of wood instead of
wood mixed with water—green wood. More
than that, we carry only finished wood—parts
all ready to go into assembly. Instead of
paying freight on waste, we keep the waste
and earn money from it. 1
Source: (1) Ferrell, John; “Carver and Ford: Pioneers of Zero Waste” (2002)
40.
How did we end up with this linearity?• THE WAY WE END THE LIFE OF OUR CONSUMED MATERIALS: In the first half of today’s
session we talked about landfills and how they take materials out of the planet’s circular
metabolism.
• OUR CREATED WORLD OF SYNTHETIC MATERIALS, WHICH WE DON’T EVEN FULLY
UNDERSTAND: We’ve also achieved this linearity by the way we have manipulated natural
materials to forms that damage nature or nature does not have evolved ways of re-integrating it
into its cycles fast enough before a lot of damage is done.
− “Of the approximately 80,000 defined chemical substances and technical mixes that are
produced and used by industry today …, only about 3,000 has so far been studied for
their effects on living systems.”1
− POP problem
− Recycling doesn’t address this issue; it simply transforms the problem from one product
to another p. 56
• WE HAVE MOVED AWAY FROM DESIGNING WITH NATURE; WE DESIGN AGAINST
NATURE: ….
• BY THE WAY, NATURAL DOES NOT MEAN “GOOD” ESP. GIVEN OUR POPULATION
GROWTH RATES
41.
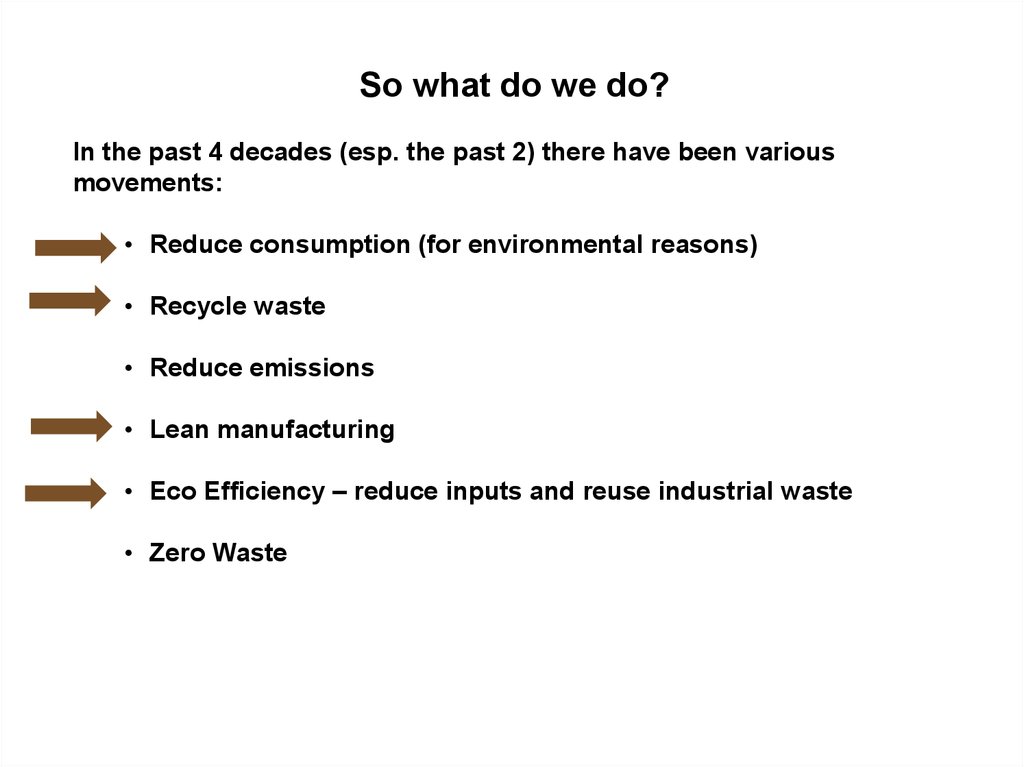
So what do we do?In the past 4 decades (esp. the past 2) there have been various
movements:
• Reduce consumption (for environmental reasons)
• Recycle waste
• Reduce emissions
• Lean manufacturing
• Eco Efficiency – reduce inputs and reuse industrial waste
• Zero Waste
42.
Action directions1. Changes in Consumer Behavior
- Three R’s: Reduce, Reuse, Recycle …
- plus a 4th R … Redesign
43.
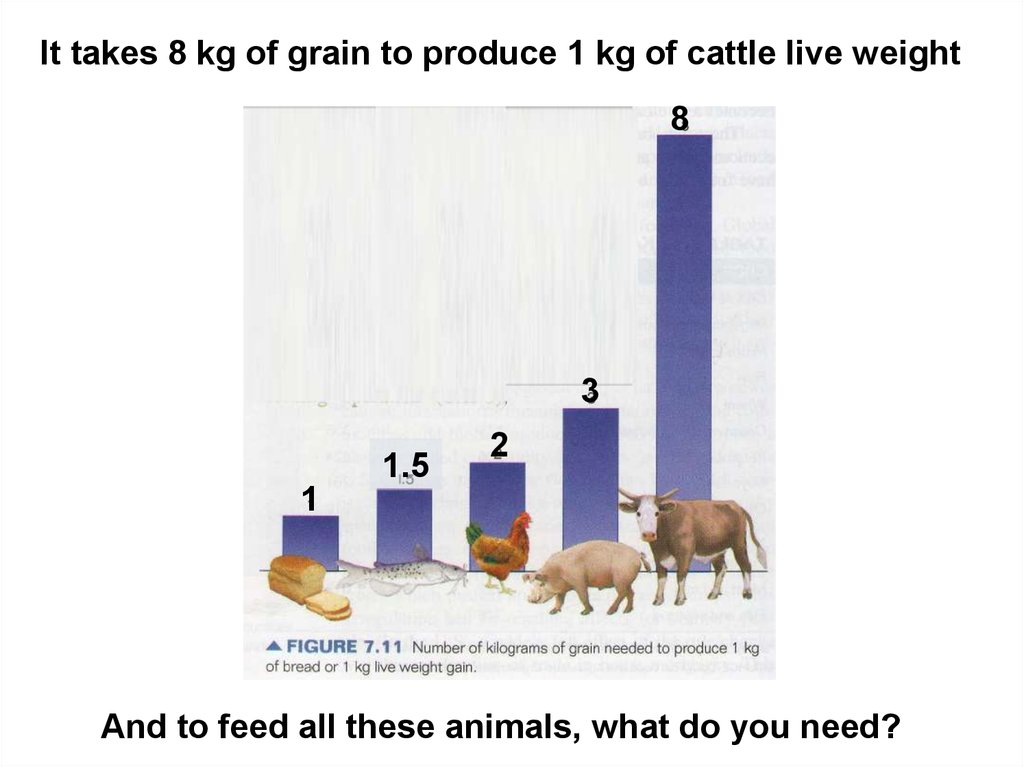
It takes 8 kg of grain to produce 1 kg of cattle live weight8
3
1.5
2
1
And to feed all these animals, what do you need?
44.
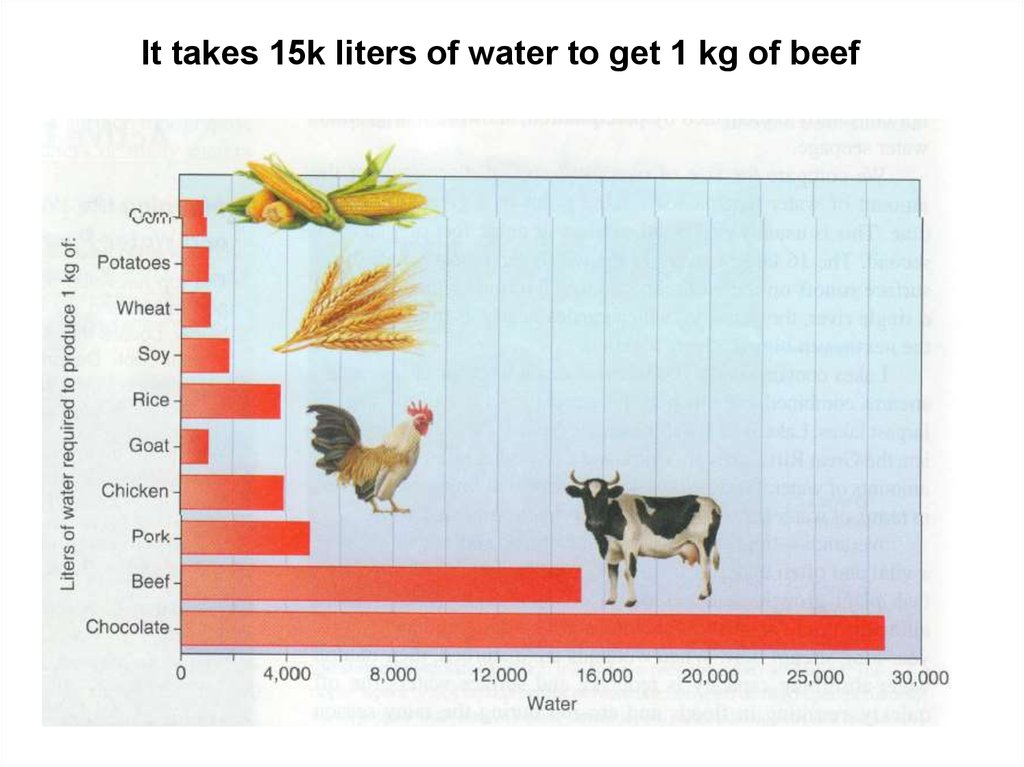
It takes 15k liters of water to get 1 kg of beef45.
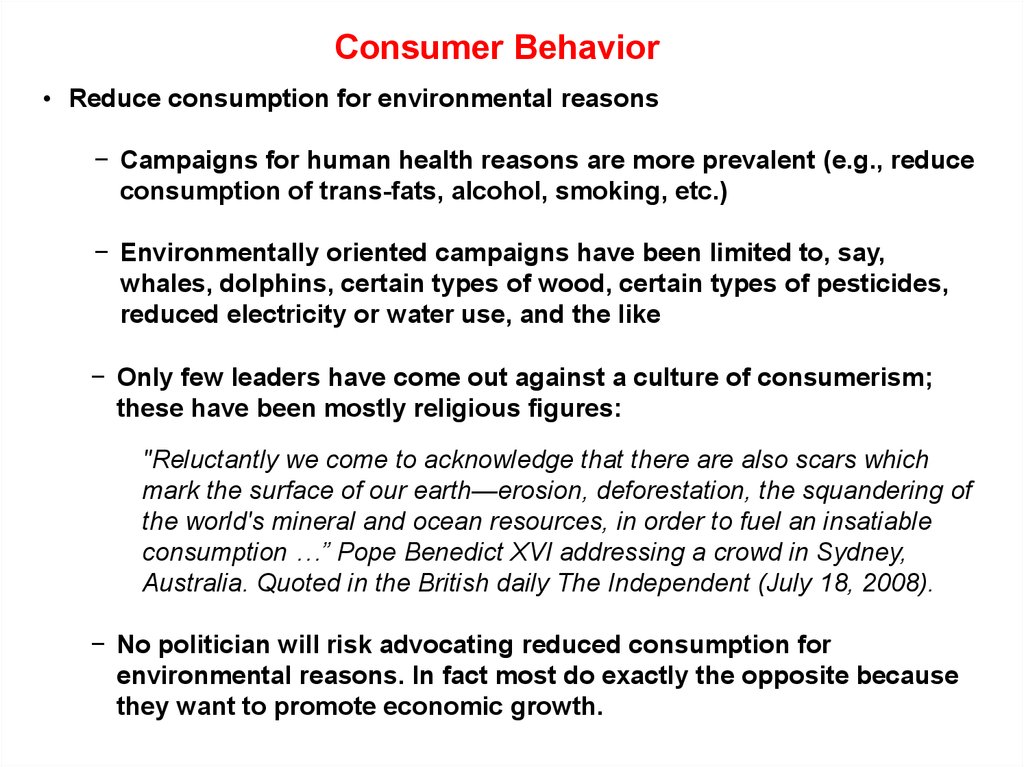
Consumer Behavior• Reduce consumption for environmental reasons
− Campaigns for human health reasons are more prevalent (e.g., reduce
consumption of trans-fats, alcohol, smoking, etc.)
− Environmentally oriented campaigns have been limited to, say,
whales, dolphins, certain types of wood, certain types of pesticides,
reduced electricity or water use, and the like
− Only few leaders have come out against a culture of consumerism;
these have been mostly religious figures:
"Reluctantly we come to acknowledge that there are also scars which
mark the surface of our earth—erosion, deforestation, the squandering of
the world's mineral and ocean resources, in order to fuel an insatiable
consumption …” Pope Benedict XVI addressing a crowd in Sydney,
Australia. Quoted in the British daily The Independent (July 18, 2008).
− No politician will risk advocating reduced consumption for
environmental reasons. In fact most do exactly the opposite because
they want to promote economic growth.
46.
Consumer BehaviorWhat is the relationship between consumption, economic growth, and
happiness (which is after all what we’re after).
47.
ELECTRONIC WASTEHow many have iPhones?
The gold in 30 iPhones is
extracted from 1 ton of ore
48.
Recycle waste• There are 3 important distinctions to
make when discussing recycling:
- Organic vs. inorganic
- Pre-consumer vs. post consumer
- Open-loop vs. closed-loop recycling
49.
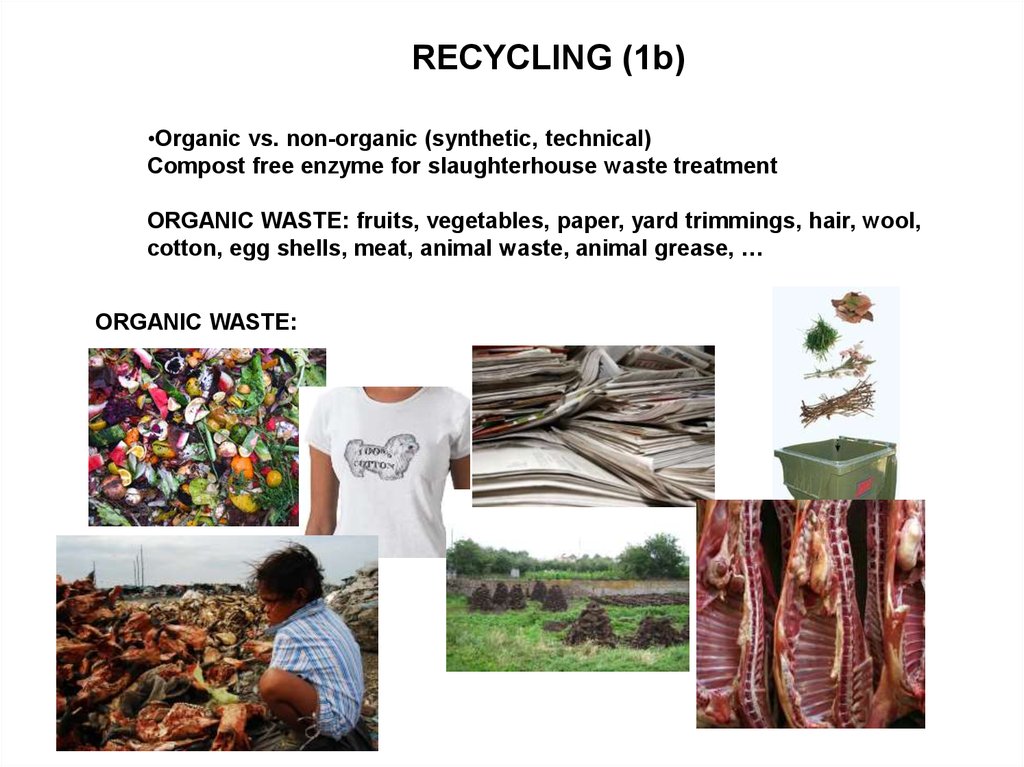
RECYCLING (1b)•Organic vs. non-organic (synthetic, technical)
Compost free enzyme for slaughterhouse waste treatment
ORGANIC WASTE: fruits, vegetables, paper, yard trimmings, hair, wool,
cotton, egg shells, meat, animal waste, animal grease, …
ORGANIC WASTE:
50.
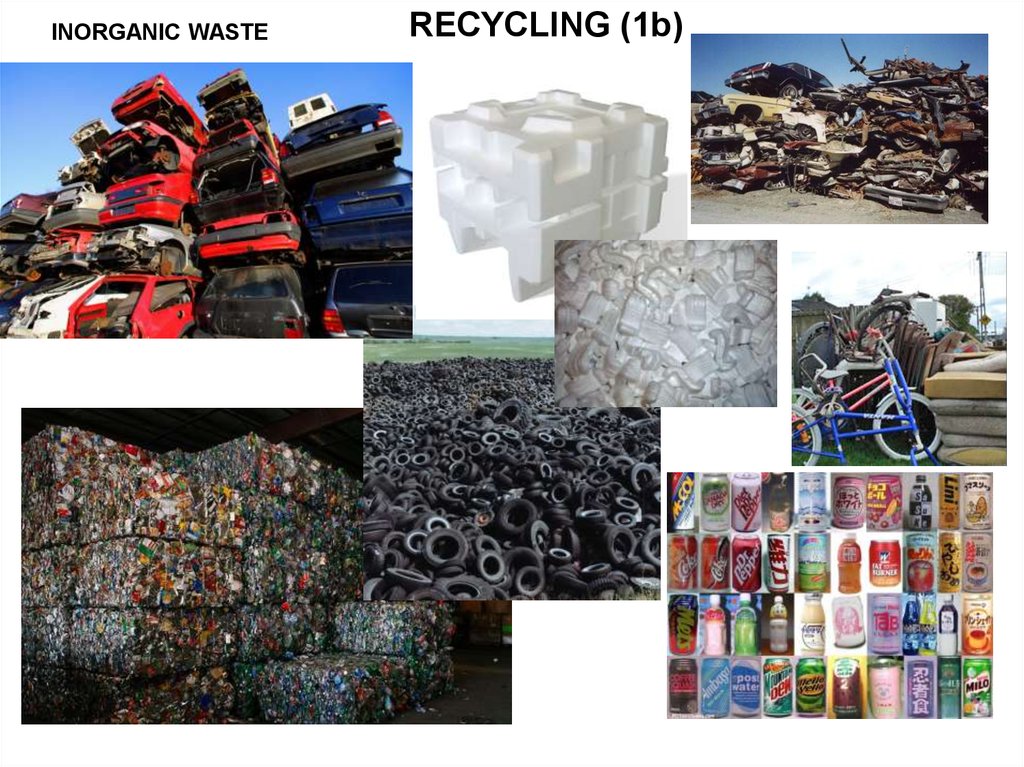
INORGANIC WASTERECYCLING (1b)
51.
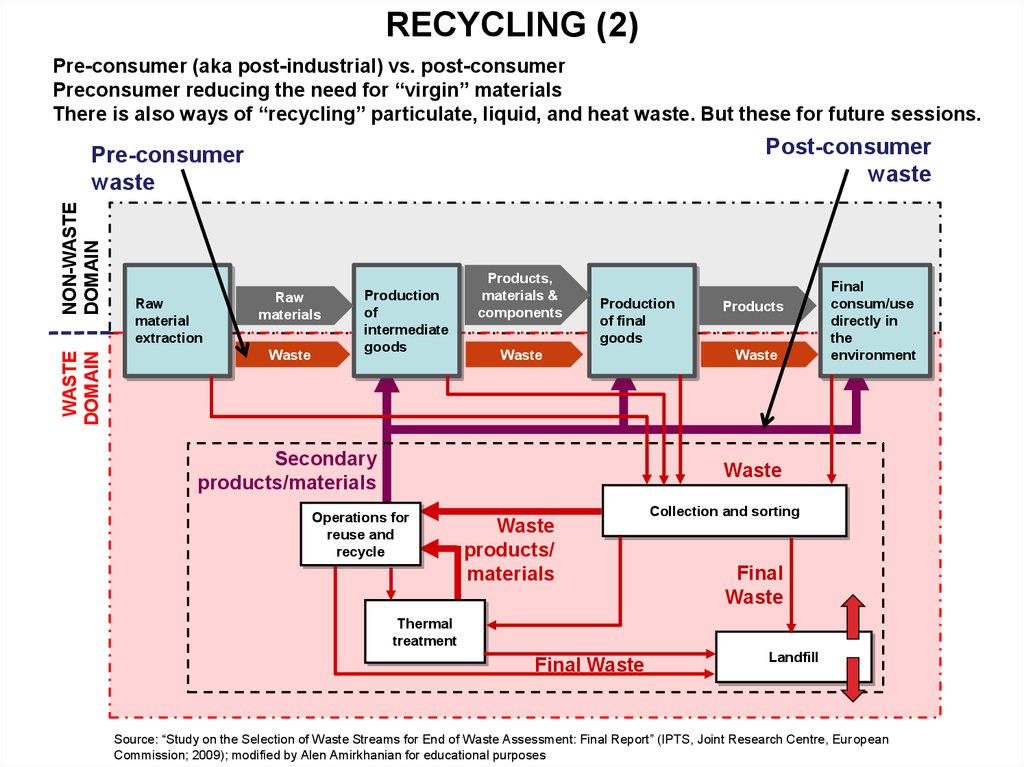
RECYCLING (2)Pre-consumer (aka post-industrial) vs. post-consumer
Preconsumer reducing the need for “virgin” materials
There is also ways of “recycling” particulate, liquid, and heat waste. But these for future sessions.
Post-consumer
waste
WASTE
DOMAIN
NON-WASTE
DOMAIN
Pre-consumer
waste
Raw
material
extraction
Raw
materials
Waste
Production
of
intermediate
goods
Products,
materials &
components
Production
of final
goods
Waste
Secondary
products/materials
Products
Waste
Final
consum/use
directly in
the
environment
Waste
Operations for
reuse and
recycle
Waste
products/
materials
Collection and sorting
Final
Waste
Thermal
treatment
Final Waste
Landfill
Source: “Study on the Selection of Waste Streams for End of Waste Assessment: Final Report” (IPTS, Joint Research Centre, European
Commission; 2009); modified by Alen Amirkhanian for educational purposes
52.
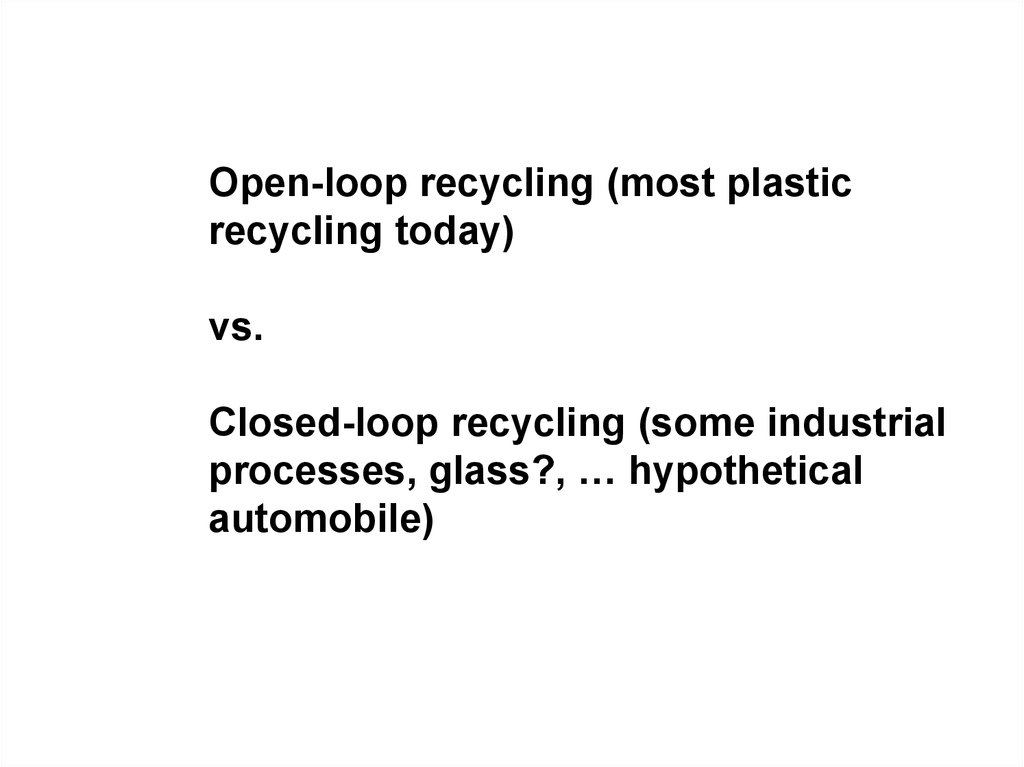
Open-loop recycling (most plasticrecycling today)
vs.
Closed-loop recycling (some industrial
processes, glass?, … hypothetical
automobile)
53.
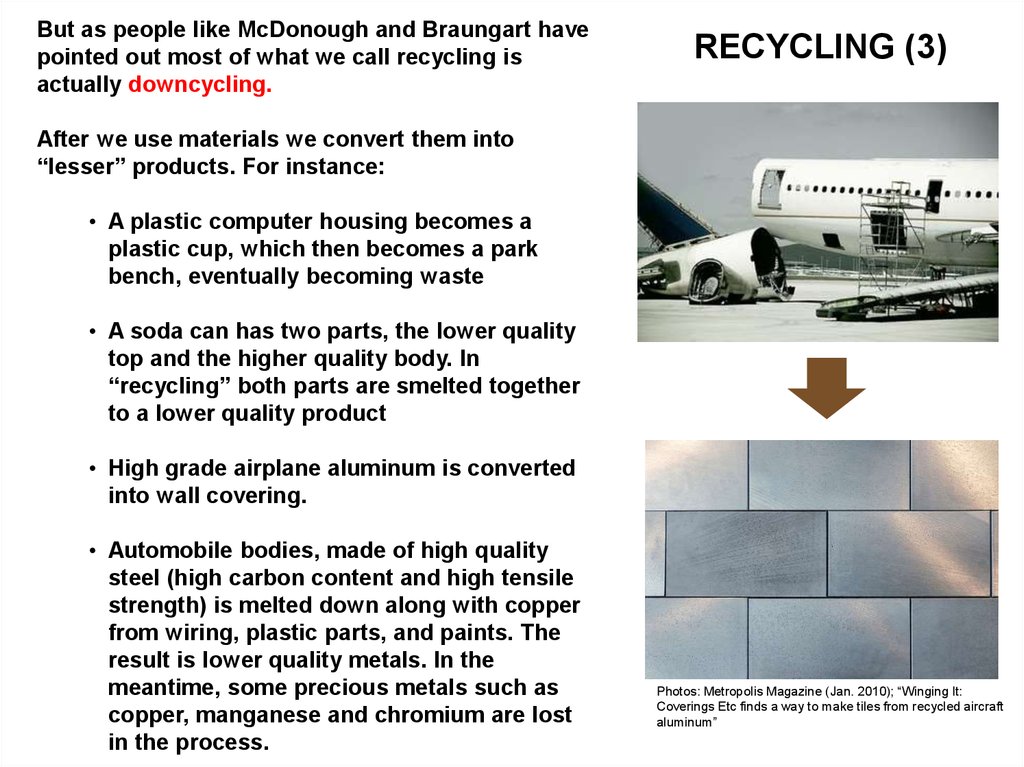
But as people like McDonough and Braungart havepointed out most of what we call recycling is
actually downcycling.
RECYCLING (3)
After we use materials we convert them into
“lesser” products. For instance:
• A plastic computer housing becomes a
plastic cup, which then becomes a park
bench, eventually becoming waste
• A soda can has two parts, the lower quality
top and the higher quality body. In
“recycling” both parts are smelted together
to a lower quality product
• High grade airplane aluminum is converted
into wall covering.
• Automobile bodies, made of high quality
steel (high carbon content and high tensile
strength) is melted down along with copper
from wiring, plastic parts, and paints. The
result is lower quality metals. In the
meantime, some precious metals such as
copper, manganese and chromium are lost
in the process.
Photos: Metropolis Magazine (Jan. 2010); “Winging It:
Coverings Etc finds a way to make tiles from recycled aircraft
aluminum”
54.
But are these enough?Thinkers like McDonough and Braungart argue that adopting these practices
only makes us “less bad.” We need to be 100% good.
These incremental strategies e.g., pollution control, source reduction of waste,
recycling (even if downcycling) are important …
a) They buy us time and
b) They allow for learning
We have to redesign our products and practices so that we eliminate the
concept of waste.
They posit that there are two types of metabolisms on the planet:
•Biological metabolism
•Technical metabolism
“With the right design all of the products and materials manufactured by industry will
feed into one of these two metabolisms …” (c2c, p.104)
THERE HAS BEEN A FAILURE OF DESIGN:
Not intelligence, Not knowledge, but Design
55.
But to reach true “eco effectiveness,” we have to redesign our highlycomplex system of industry, finance, mobility, and energy we’ve created.
We have to reengineer the process and the products. This will take time
but needs concerted focus.
McDonough and Braungart have interesting things to say about this:
We should do away with the concept of “waste.” Our activities
should create “biological and technical nutrients.”
Our goal should not be to build products/materials that have very
long useful life. We don’t necessarily want “intergenerational
tyranny.” (c2c, p 112)
Products can be designed to have limited life.
But it means designing products/materials that can be taken apart
and used and reused without downcycling.
Examples of downcycling: writing paper to paper bag; plastic
bottles to park benches, airplane aluminum to wall covering
56.
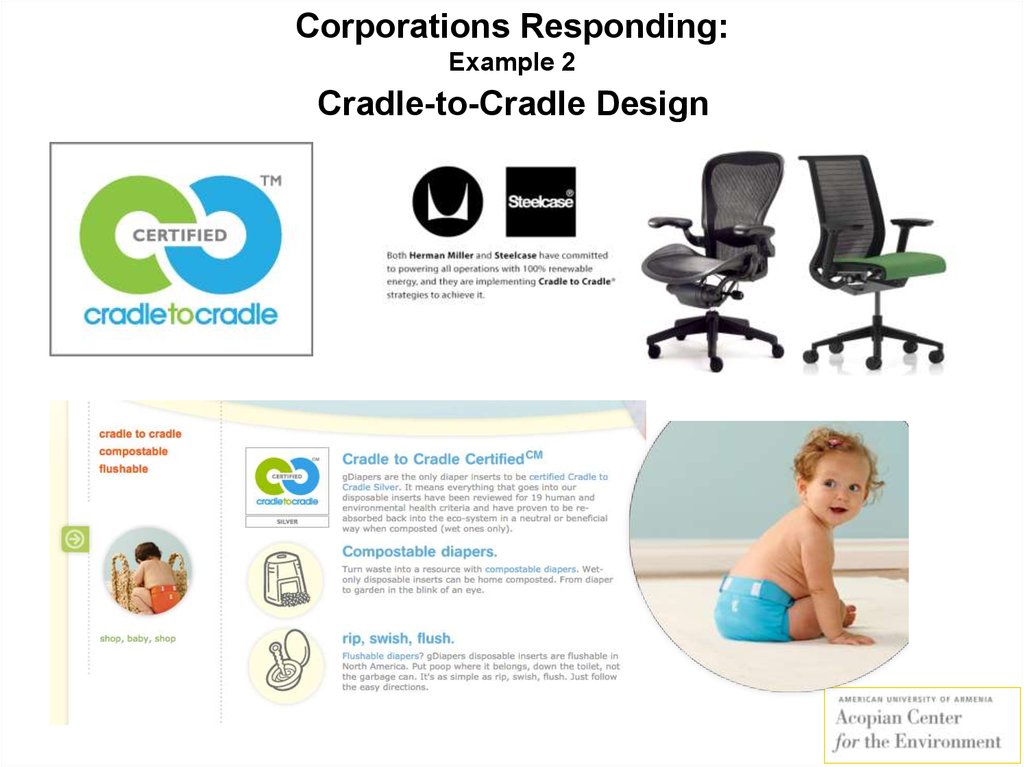
Corporations Responding:Example 2
Cradle-to-Cradle Design
57.
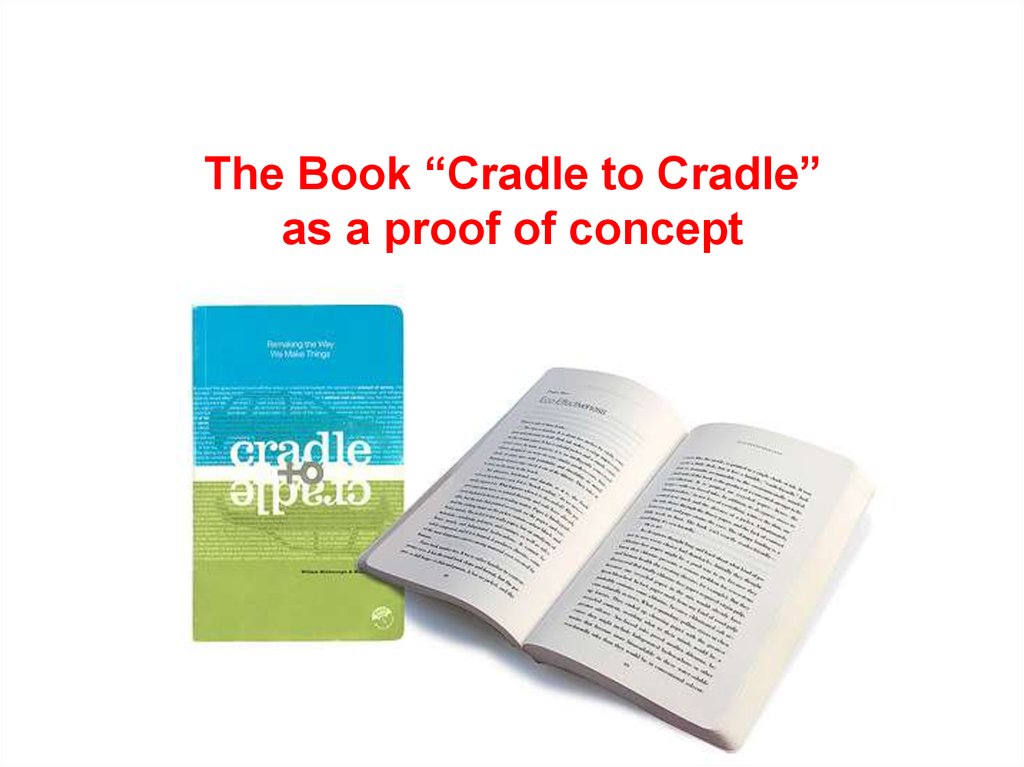
The Book “Cradle to Cradle”as a proof of concept
58.
Redesigning the Book• Let’s imagine a book that is not a tree, no paper as we know it
• It is made of plastics, polymers that are infinitely recyclable
• It does not cut down trees, does not leach chlorine in waterways
• The inks are nontoxic, can be washed by safe simple chemical
process, in boiled water
• These inks can be recovered from the water and reused
• The glues are also recoverable and reusable without toxic affect
59.
In the past decade McDonough and Braungart have taken their designprinciples to practice.
Through their consulting firm, MBDC, they have
worked with dozens of companies including:
• Steelcase,
• Proctor & Gamble,
• Pepsico,
• Energizer,
• Nike, and so on.
They also offer, Cradle-to-Cradle Certification (C2-C Certification) for products and processes.
Herman Miller has more than 20 products with C2-C Certification http://www.mbdc.com/
Herman Miller’s iconic Aeron chair is C-2-C Certified
60.
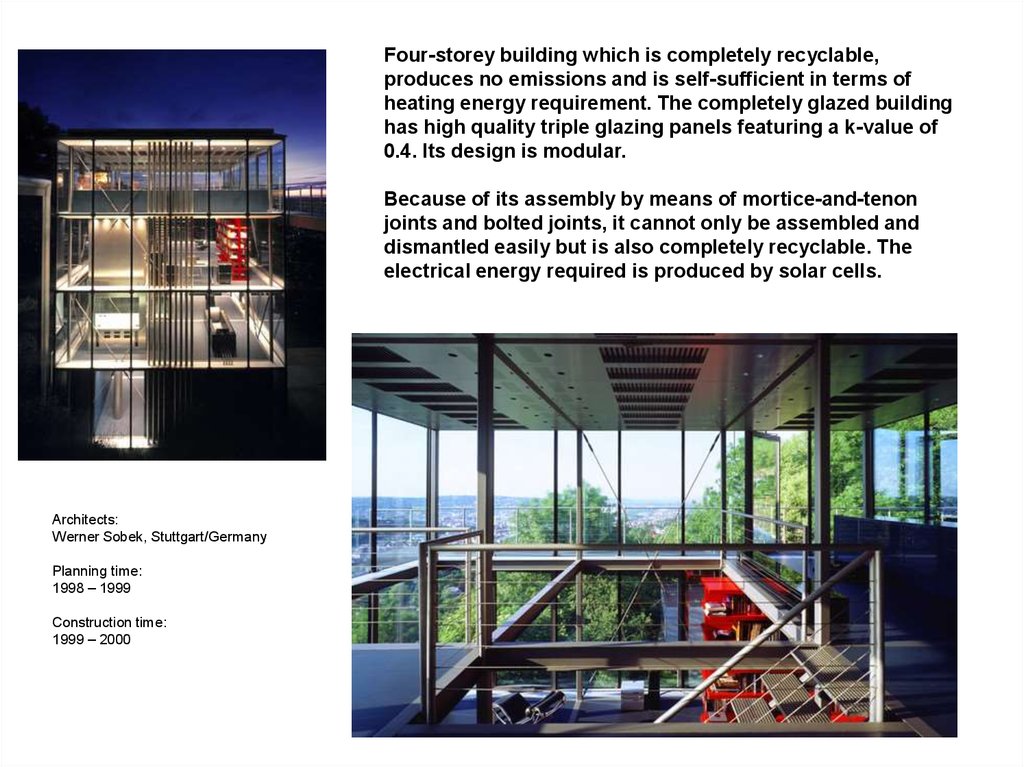
Four-storey building which is completely recyclable,produces no emissions and is self-sufficient in terms of
heating energy requirement. The completely glazed building
has high quality triple glazing panels featuring a k-value of
0.4. Its design is modular.
Because of its assembly by means of mortice-and-tenon
joints and bolted joints, it cannot only be assembled and
dismantled easily but is also completely recyclable. The
electrical energy required is produced by solar cells.
Architects:
Werner Sobek, Stuttgart/Germany
Planning time:
1998 – 1999
Construction time:
1999 – 2000
61.
THE END62.
Extra Slides63.
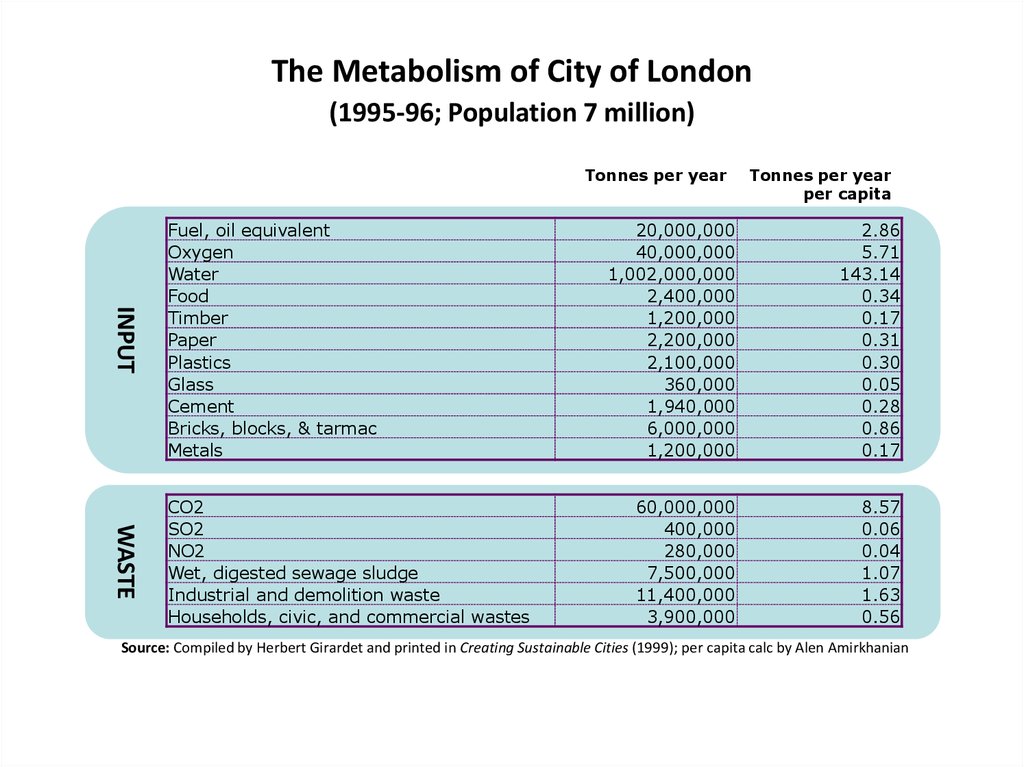
The Metabolism of City of London(1995-96; Population 7 million)
Tonnes per year
INPUT
Fuel, oil equivalent
Oxygen
Water
Food
Timber
Paper
Plastics
Glass
Cement
Bricks, blocks, & tarmac
Metals
WASTE
CO2
SO2
NO2
Wet, digested sewage sludge
Industrial and demolition waste
Households, civic, and commercial wastes
Tonnes per year
per capita
20,000,000
40,000,000
1,002,000,000
2,400,000
1,200,000
2,200,000
2,100,000
360,000
1,940,000
6,000,000
1,200,000
2.86
5.71
143.14
0.34
0.17
0.31
0.30
0.05
0.28
0.86
0.17
60,000,000
400,000
280,000
7,500,000
11,400,000
3,900,000
8.57
0.06
0.04
1.07
1.63
0.56
Source: Compiled by Herbert Girardet and printed in Creating Sustainable Cities (1999); per capita calc by Alen Amirkhanian
64.
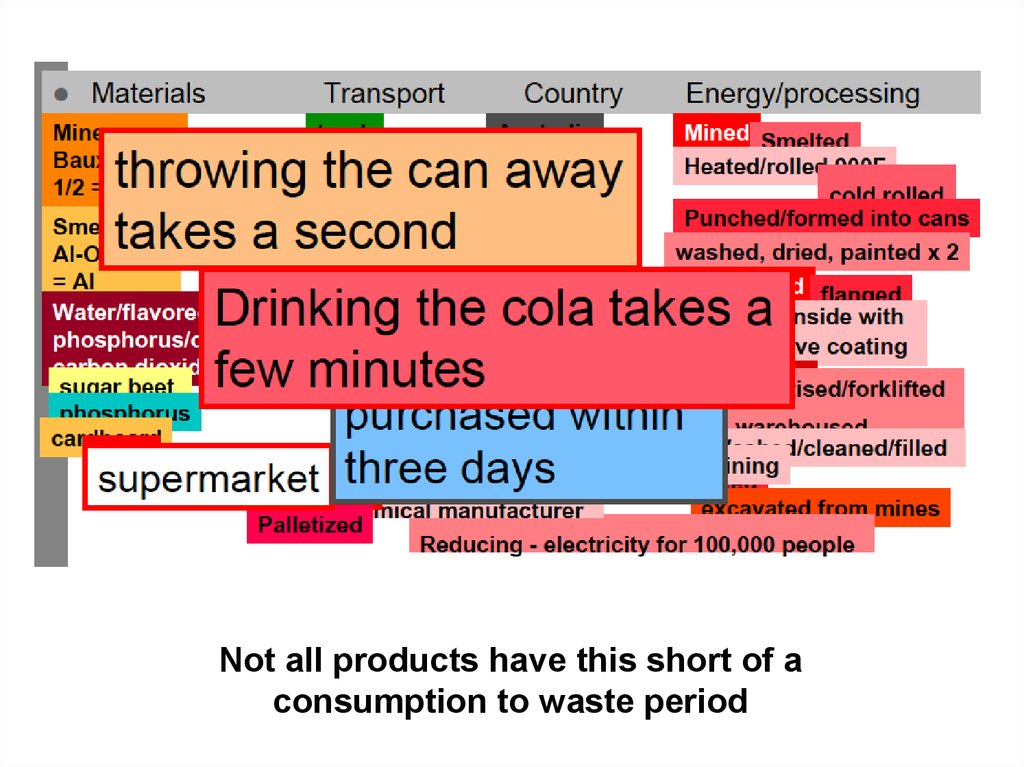
Not all products have this short of aconsumption to waste period