


 Экология
Похожие презентации:


Waste to energy a redeemer for investors, ecologists & environmentalists
1.
WASTE TO ENERGYA
REDEEMER
FOR
INVESTORS, ECOLOGISTS & ENVIRONMENTALISTS
2.
INTRODUCTIONWaste is an inevitable product of society
One of the greatest challenges for future generations - how
to manage large quantities of waste in a sustainable way?
Till now global focus is to minimise the amount of waste
produced and to recycle larger fractions of waste materials.
Still considerable part of undesired end products.
More suitable solution than simple landfilling needs to be
found.
The Waste Management Sector needs to be integrated with
The Energy Sector to meet the growing energy demand.
Waste to be seen not only as an undesired product of
society, but also a valuable energy resource as well.
3.
GLOBAL WASTE SCENARIOGLOBAL WASTE MARKET – Over 32 Billion USD
Annual Growth – 5.5%
WTE technologies based on Thermal Energy Conversion
dominated the market accounting for 88.5% of the total
revenue in 2017.
Europe is the largest and most sophisticated market for WTE
technologies accounting for almost 46% of the total market
revenue.
BIOLOGICAL WTE technologies growth faster
Global Waste Generation expected to be 6 million tons /day
by 2025 and 11 million tons /day by 2050.
4.
Composition of Global MSWGlass
5%
Metal
4%
Organic
46%
Plastic
10%
The major fractions of solid waste
include paper, organic material,
plastics, glass, metal and textiles
As can be seen, nearly half of the
produced waste from society is
organic.
Paper
17%
Other
18%
Specific waste products deriving from
construction, industrial and
commercial waste are not specified in
this figure, but in some cases can
represent the majority of a region’s
waste production.
5.
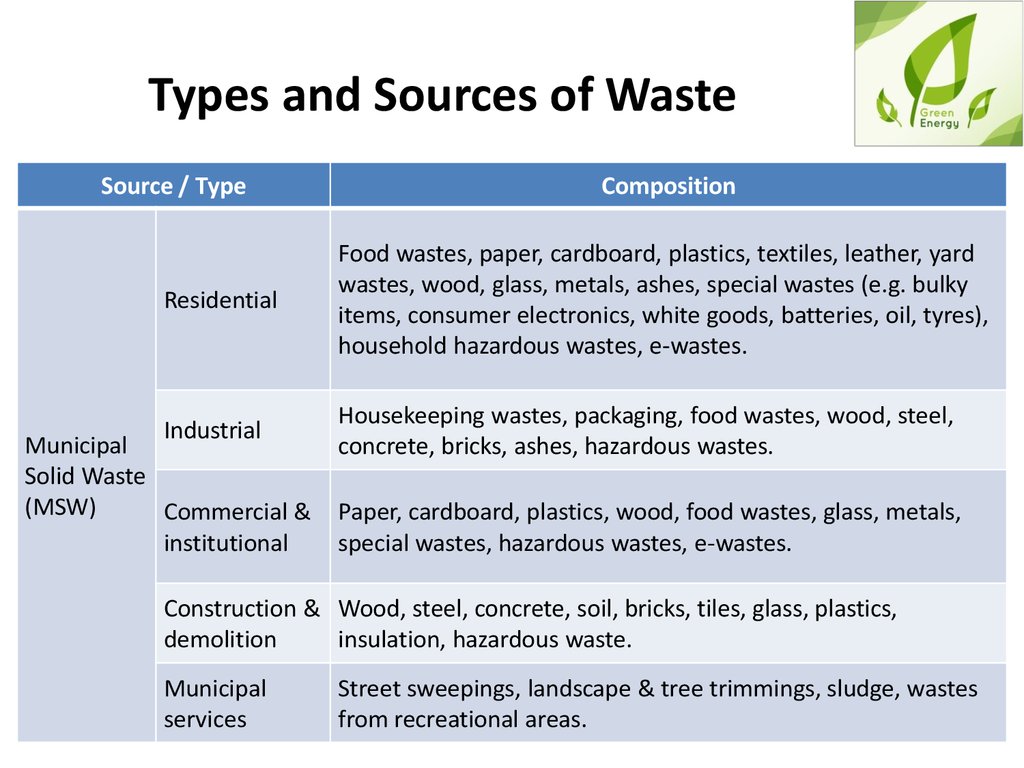
Types and Sources of WasteSource / Type
Composition
Residential
Food wastes, paper, cardboard, plastics, textiles, leather, yard
wastes, wood, glass, metals, ashes, special wastes (e.g. bulky
items, consumer electronics, white goods, batteries, oil, tyres),
household hazardous wastes, e-wastes.
Industrial
Housekeeping wastes, packaging, food wastes, wood, steel,
concrete, bricks, ashes, hazardous wastes.
Municipal
Solid Waste
(MSW)
Commercial &
institutional
Paper, cardboard, plastics, wood, food wastes, glass, metals,
special wastes, hazardous wastes, e-wastes.
Construction & Wood, steel, concrete, soil, bricks, tiles, glass, plastics,
demolition
insulation, hazardous waste.
Municipal
services
Street sweepings, landscape & tree trimmings, sludge, wastes
from recreational areas.
6.
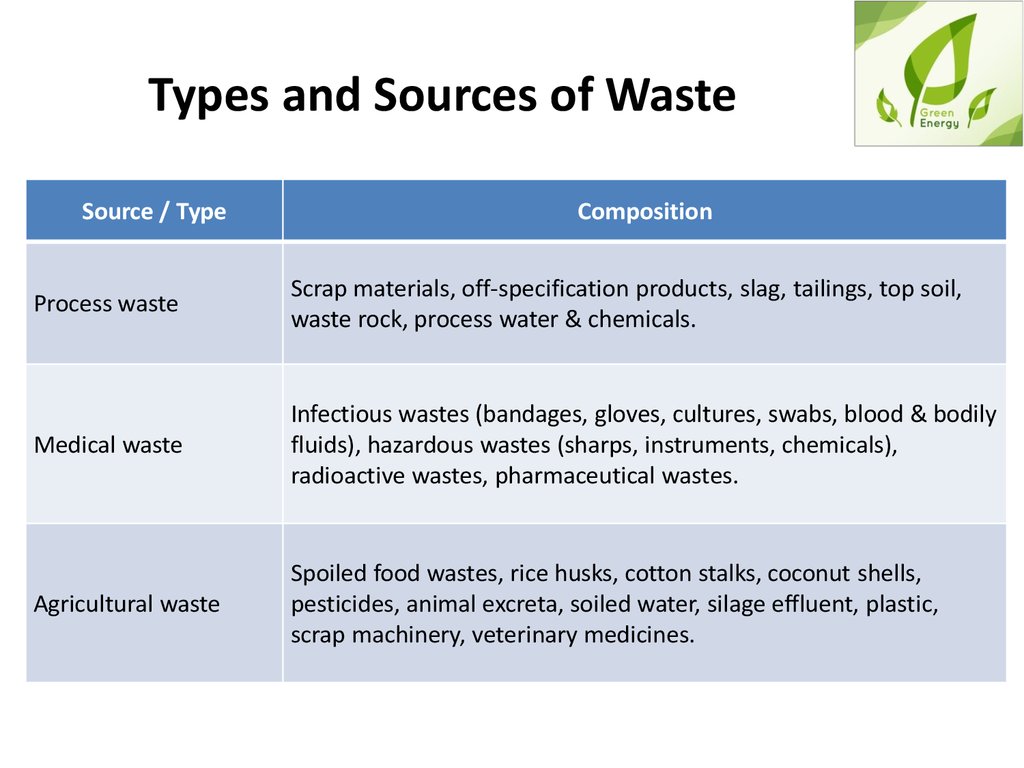
Types and Sources of WasteSource / Type
Composition
Process waste
Scrap materials, off-specification products, slag, tailings, top soil,
waste rock, process water & chemicals.
Medical waste
Infectious wastes (bandages, gloves, cultures, swabs, blood & bodily
fluids), hazardous wastes (sharps, instruments, chemicals),
radioactive wastes, pharmaceutical wastes.
Agricultural waste
Spoiled food wastes, rice husks, cotton stalks, coconut shells,
pesticides, animal excreta, soiled water, silage effluent, plastic,
scrap machinery, veterinary medicines.
7.
MSW STRUCTURE IN UKRAINE10%
Food Waste
1%
5%
Paper & Cardboard
Secondary Polymers
5%
2%
44%
Glass
Metals
9%
Textiles
Construction Waste
Wood
11%
13%
Others
8.
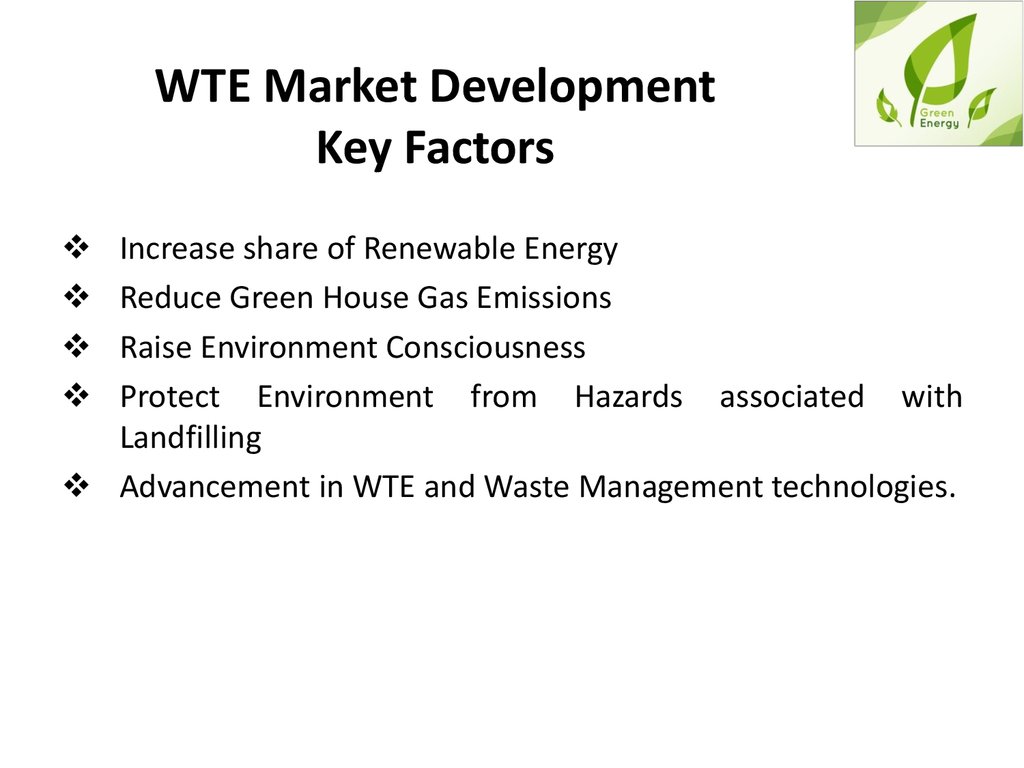
WTE Market DevelopmentKey Factors
Increase share of Renewable Energy
Reduce Green House Gas Emissions
Raise Environment Consciousness
Protect Environment from Hazards associated with
Landfilling
Advancement in WTE and Waste Management technologies.
9.
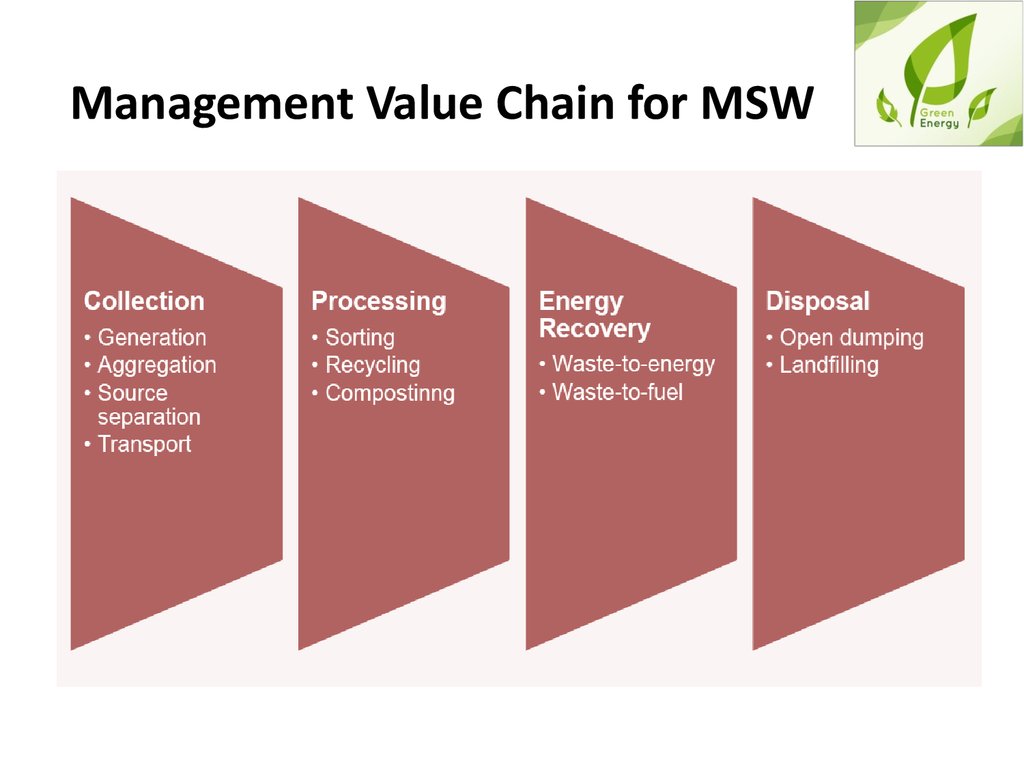
Management Value Chain for MSW10.
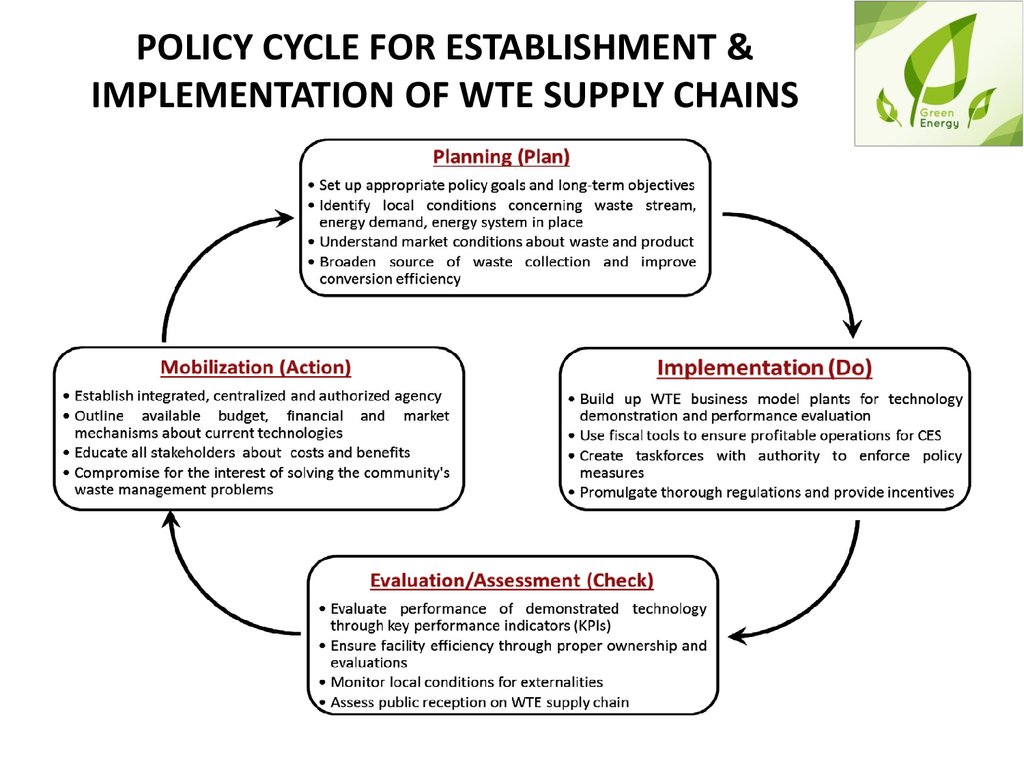
POLICY CYCLE FOR ESTABLISHMENT &IMPLEMENTATION OF WTE SUPPLY CHAINS
11.
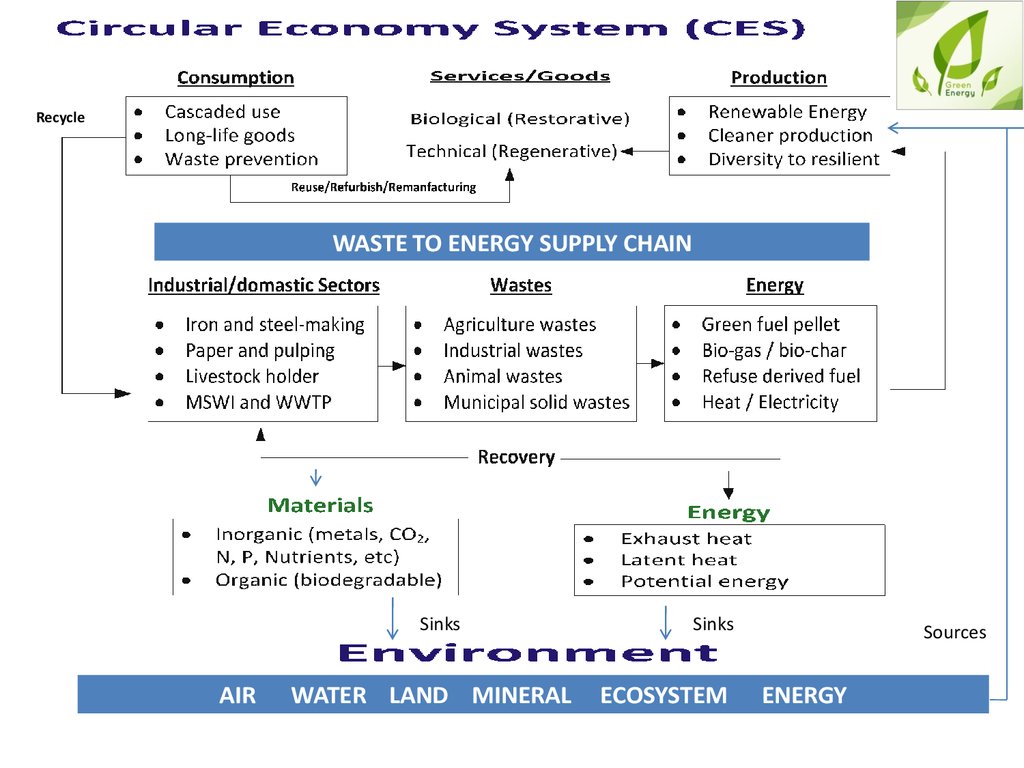
RecycleWASTE TO ENERGY SUPPLY CHAIN
Sinks
AIR
WATER LAND MINERAL
Sinks
ECOSYSTEM
Sources
ENERGY
12.
TECHNO COMMERCIAL ASPECTSCOST OF INSTALLATION (COI)
OPERATION and MAINTENANCE COST – O&M
WASTE HANDLING and TREATMENT COST – WTB
PRICE OF ELECTRICITY
OTHER COSTS
CER’s
13.
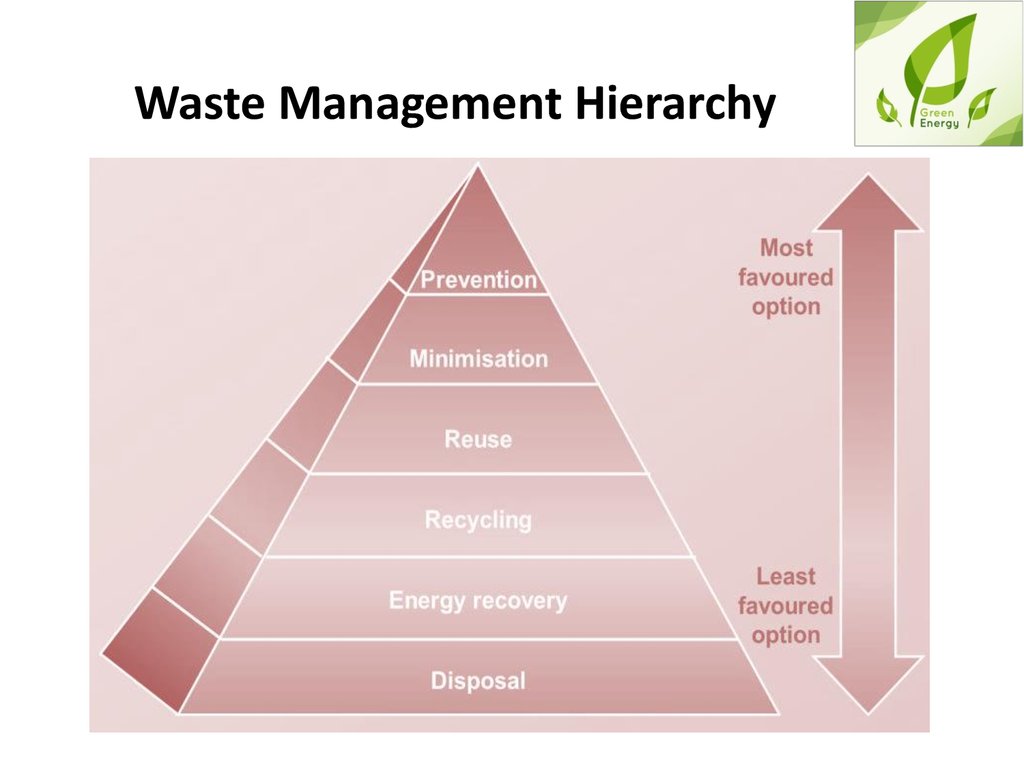
Waste Management Hierarchy14.
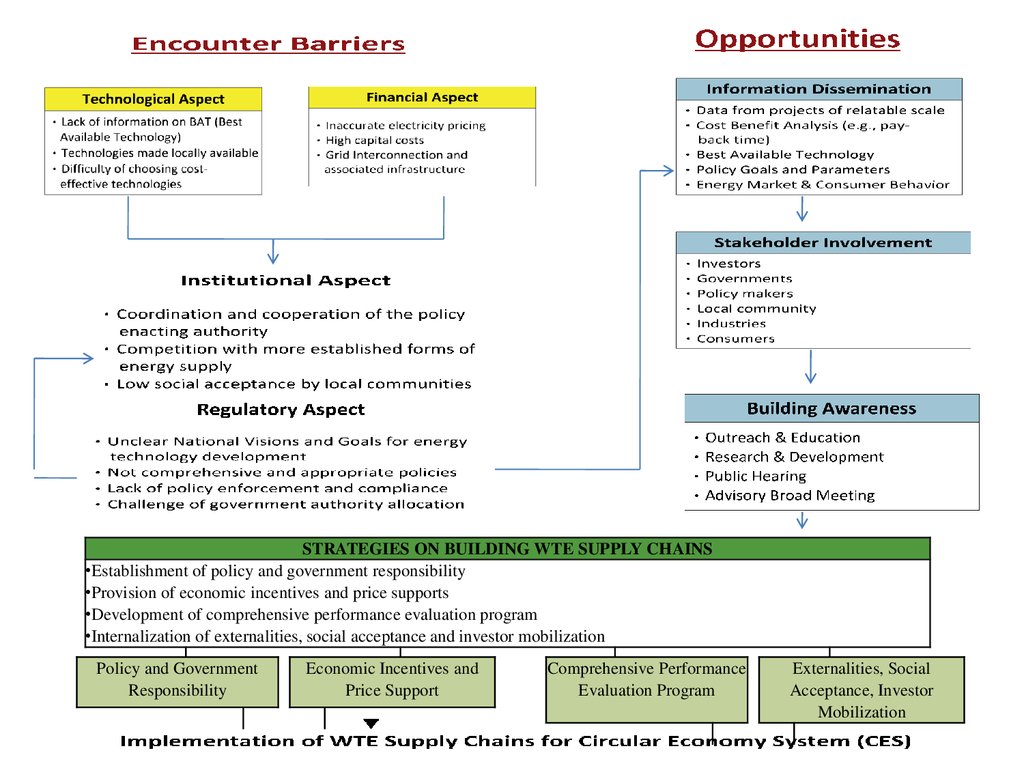
STRATEGIES ON BUILDING WTE SUPPLY CHAINS•Establishment of policy and government responsibility
•Provision of economic incentives and price supports
•Development of comprehensive performance evaluation program
•Internalization of externalities, social acceptance and investor mobilization
Policy and Government
Responsibility
Economic Incentives and
Price Support
Comprehensive Performance
Evaluation Program
Externalities, Social
Acceptance, Investor
Mobilization
15.
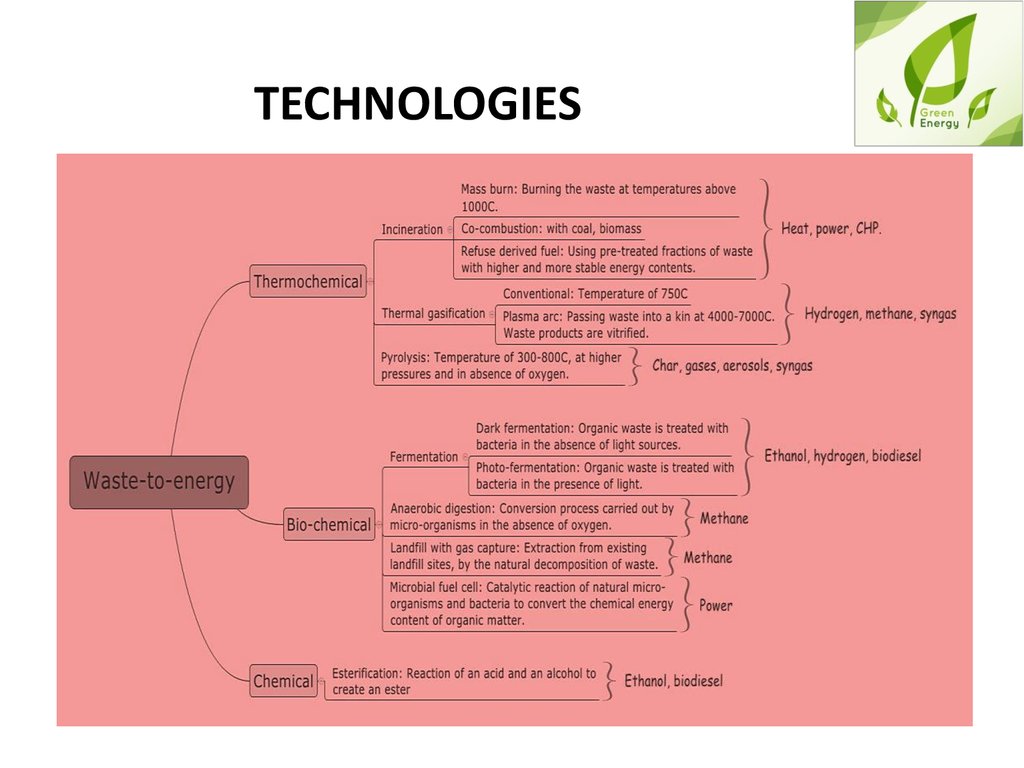
TECHNOLOGIES16.
TECHNOLOGY TREE OF WTE SUPPLYCHAIN FOR BIOENERGY UTILIZATION
17.
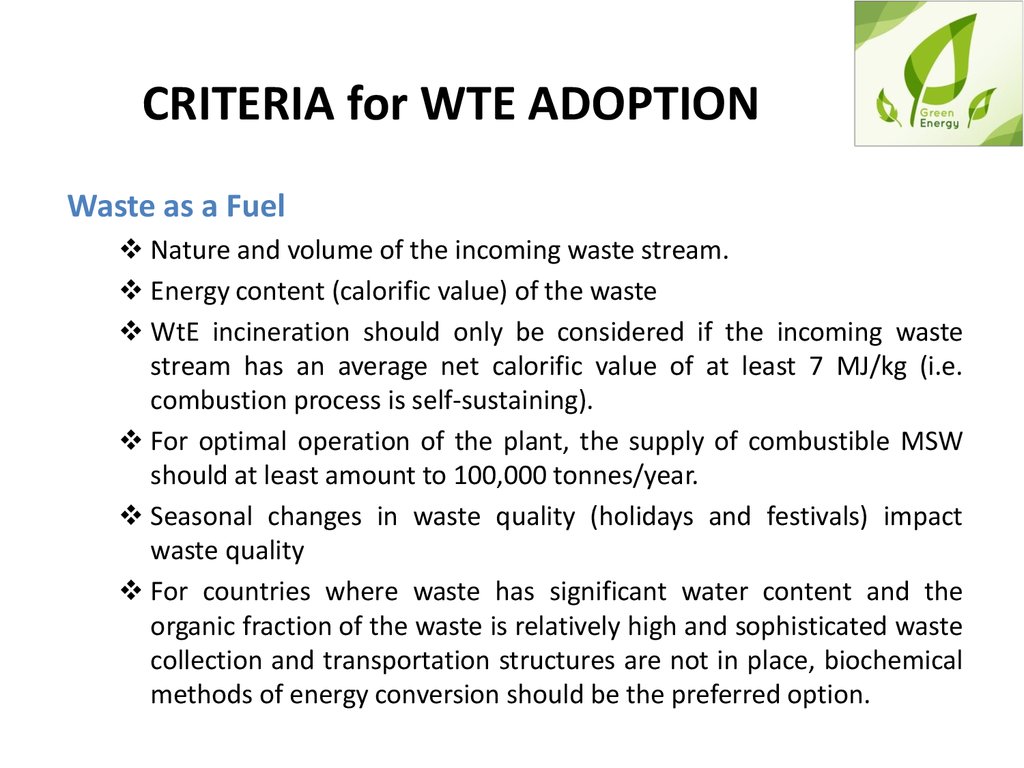
CRITERIA for WTE ADOPTIONWaste as a Fuel
Nature and volume of the incoming waste stream.
Energy content (calorific value) of the waste
WtE incineration should only be considered if the incoming waste
stream has an average net calorific value of at least 7 MJ/kg (i.e.
combustion process is self-sustaining).
For optimal operation of the plant, the supply of combustible MSW
should at least amount to 100,000 tonnes/year.
Seasonal changes in waste quality (holidays and festivals) impact
waste quality
For countries where waste has significant water content and the
organic fraction of the waste is relatively high and sophisticated waste
collection and transportation structures are not in place, biochemical
methods of energy conversion should be the preferred option.
18.
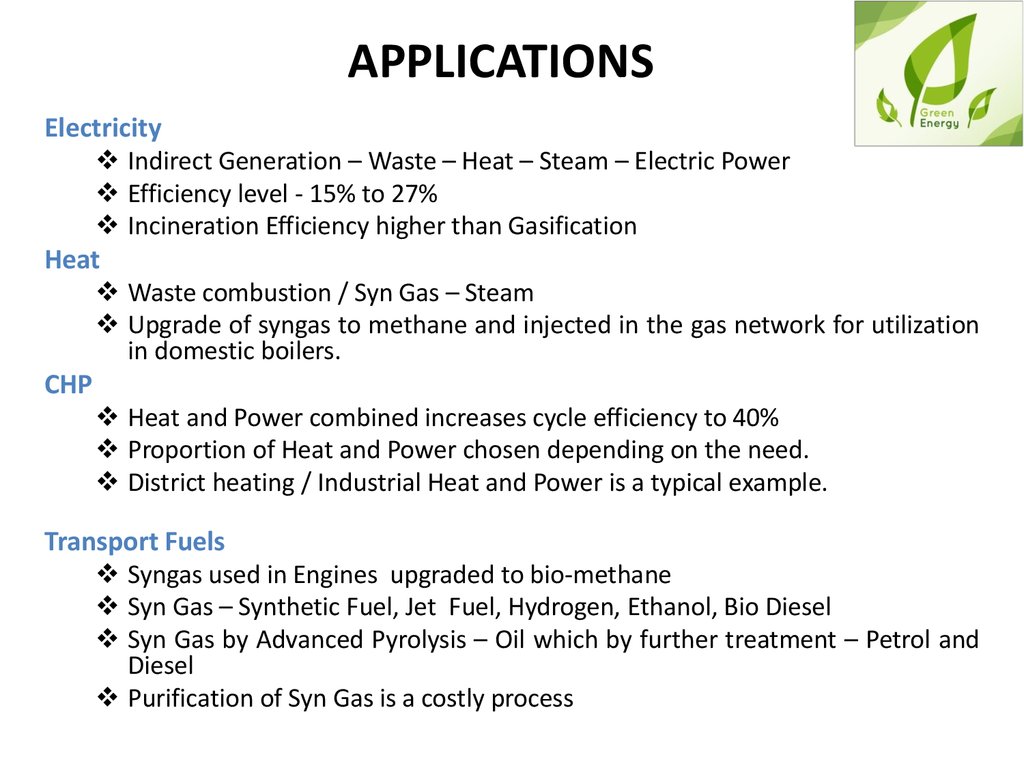
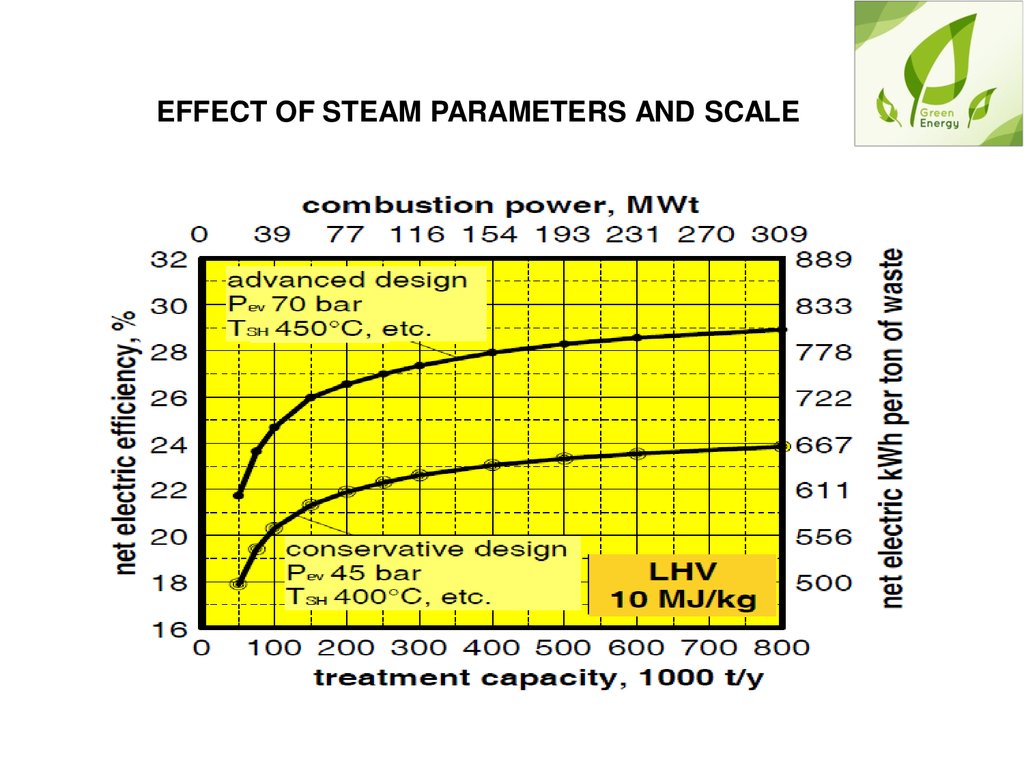
APPLICATIONSElectricity
Indirect Generation – Waste – Heat – Steam – Electric Power
Efficiency level - 15% to 27%
Incineration Efficiency higher than Gasification
Heat
Waste combustion / Syn Gas – Steam
Upgrade of syngas to methane and injected in the gas network for utilization
in domestic boilers.
CHP
Heat and Power combined increases cycle efficiency to 40%
Proportion of Heat and Power chosen depending on the need.
District heating / Industrial Heat and Power is a typical example.
Transport Fuels
Syngas used in Engines upgraded to bio-methane
Syn Gas – Synthetic Fuel, Jet Fuel, Hydrogen, Ethanol, Bio Diesel
Syn Gas by Advanced Pyrolysis – Oil which by further treatment – Petrol and
Diesel
Purification of Syn Gas is a costly process
19.
Green Supply Chain for resource and heating supply center utilizing green fuelpellets
20.
Establishment of WTE supply chain in pulping industry wastes utilized in CHP plantsTaiwan
21.
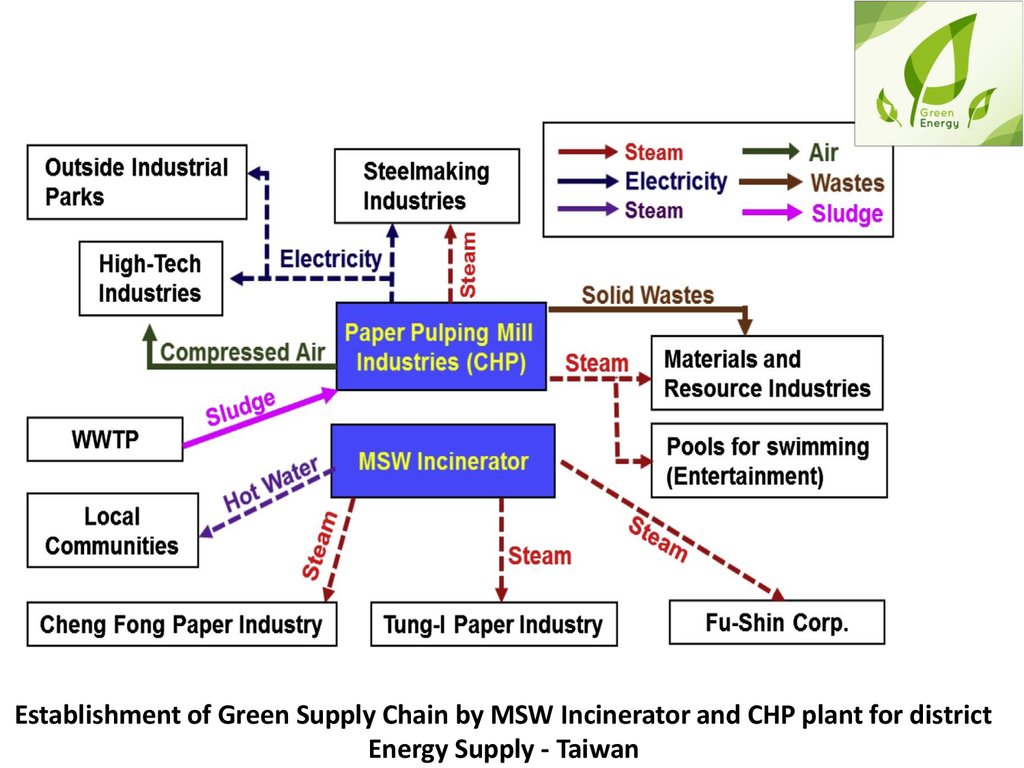
Establishment of Green Supply Chain by MSW Incinerator and CHP plant for districtEnergy Supply - Taiwan
22.
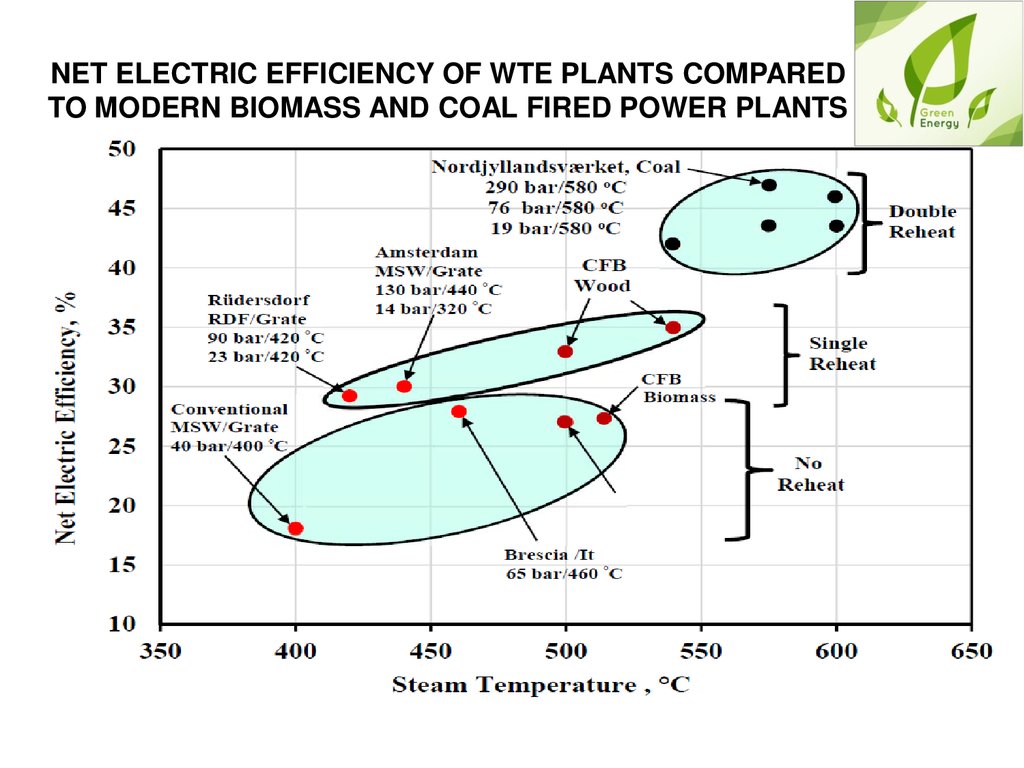
NET ELECTRIC EFFICIENCY OF WTE PLANTS COMPAREDTO MODERN BIOMASS AND COAL FIRED POWER PLANTS
23.
EFFECT OF STEAM PARAMETERS AND SCALE24.
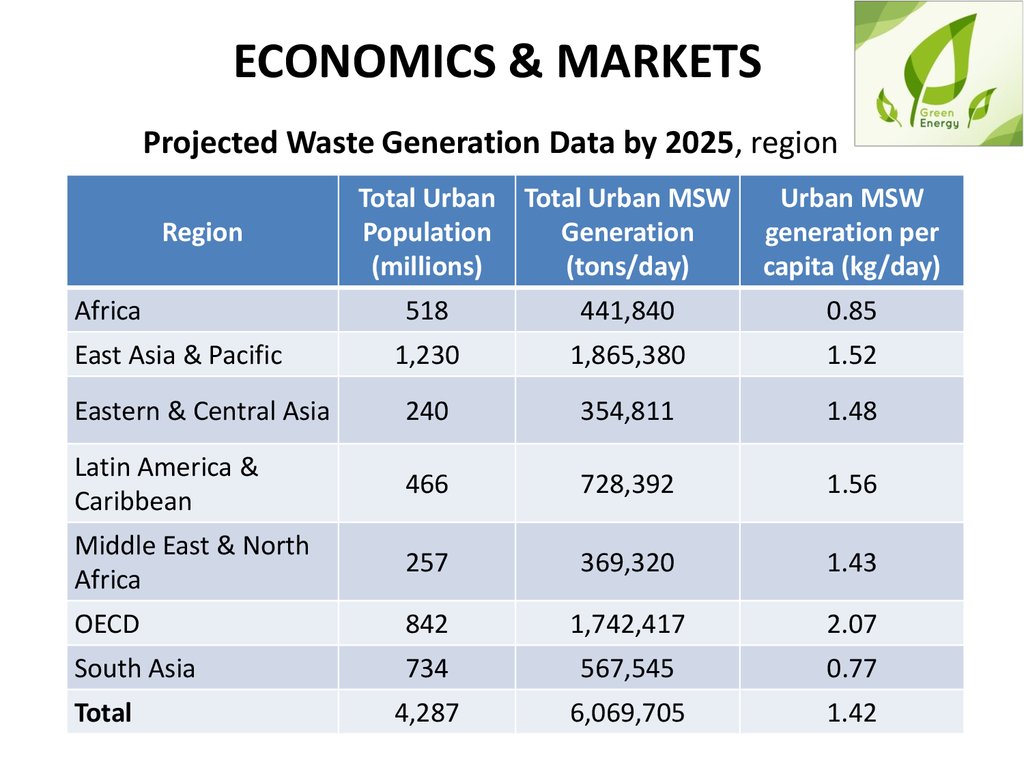
ECONOMICS & MARKETSProjected Waste Generation Data by 2025, region
Total Urban
Population
(millions)
Total Urban MSW
Generation
(tons/day)
Urban MSW
generation per
capita (kg/day)
518
441,840
0.85
1,230
1,865,380
1.52
Eastern & Central Asia
240
354,811
1.48
Latin America &
Caribbean
466
728,392
1.56
Middle East & North
Africa
257
369,320
1.43
OECD
842
1,742,417
2.07
South Asia
734
567,545
0.77
4,287
6,069,705
1.42
Region
Africa
East Asia & Pacific
Total
25.
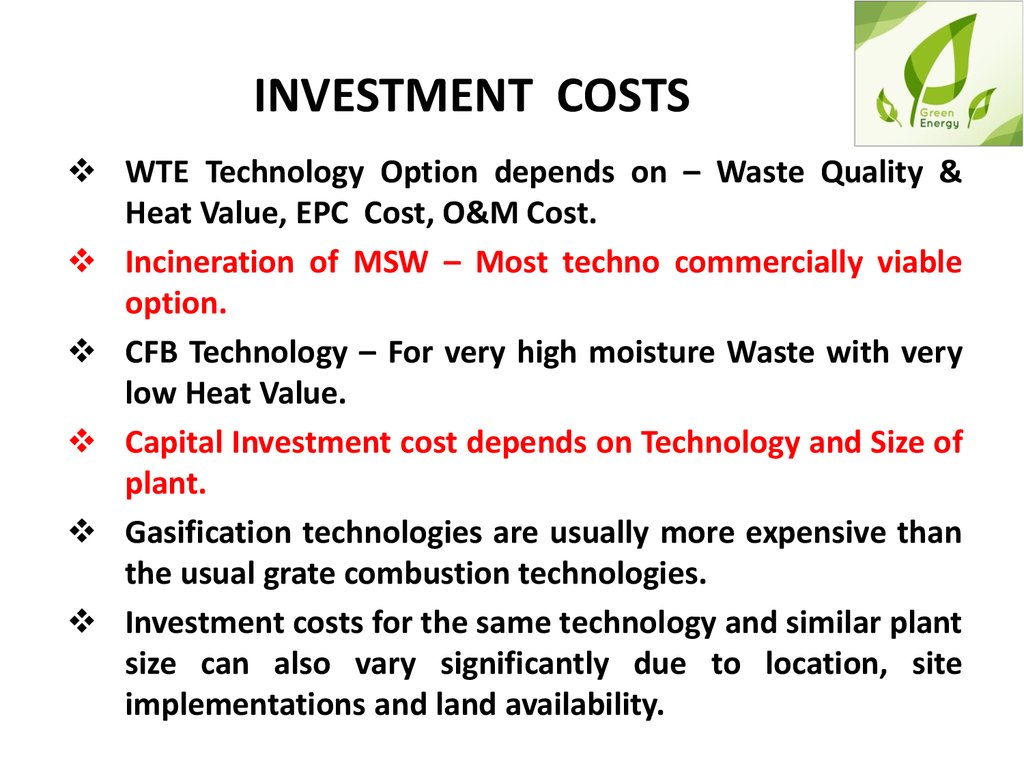
INVESTMENT COSTSWTE Technology Option depends on – Waste Quality &
Heat Value, EPC Cost, O&M Cost.
Incineration of MSW – Most techno commercially viable
option.
CFB Technology – For very high moisture Waste with very
low Heat Value.
Capital Investment cost depends on Technology and Size of
plant.
Gasification technologies are usually more expensive than
the usual grate combustion technologies.
Investment costs for the same technology and similar plant
size can also vary significantly due to location, site
implementations and land availability.
26.
Capital Costs for Thermal WTE PowerGeneration Technologies (15 MW Output)
27.
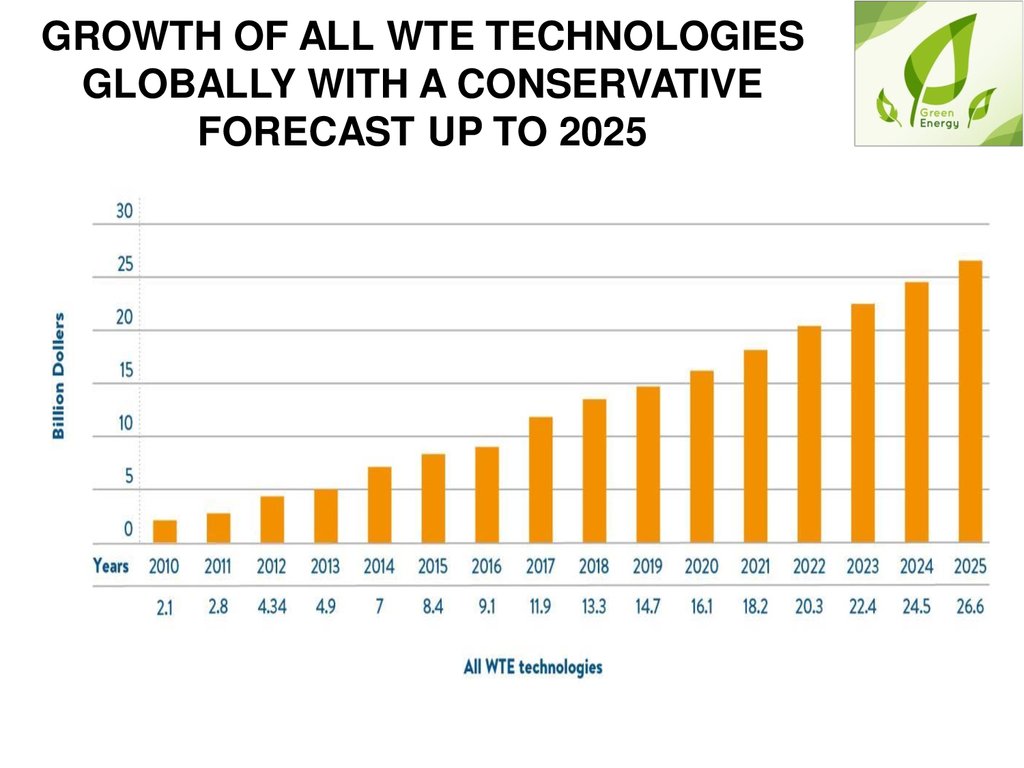
GROWTH OF ALL WTE TECHNOLOGIESGLOBALLY WITH A CONSERVATIVE
FORECAST UP TO 2025
28.
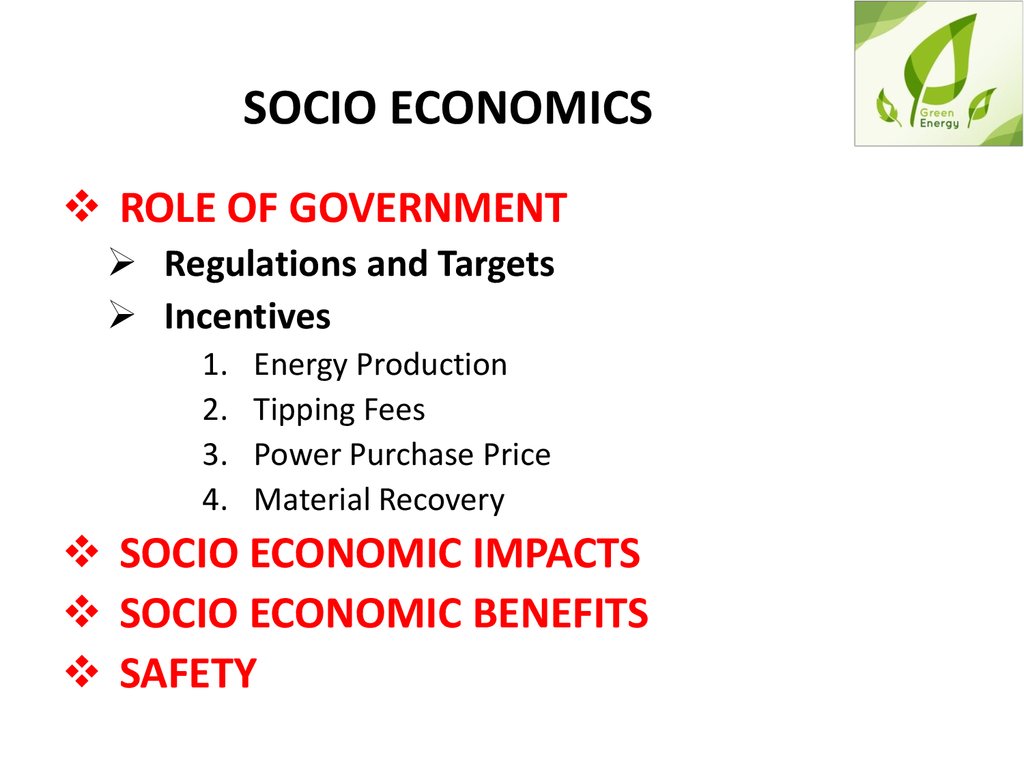
SOCIO ECONOMICSROLE OF GOVERNMENT
Regulations and Targets
Incentives
1.
2.
3.
4.
Energy Production
Tipping Fees
Power Purchase Price
Material Recovery
SOCIO ECONOMIC IMPACTS
SOCIO ECONOMIC BENEFITS
SAFETY
29.
EMISSIONSPARTICULATE MATTER
O3
CO
SOx
NOx
Non- Methane Volatile
(NMVOC)
HYDROCARBONS – CxHy
DIOXINS
Organic
Compounds
30.
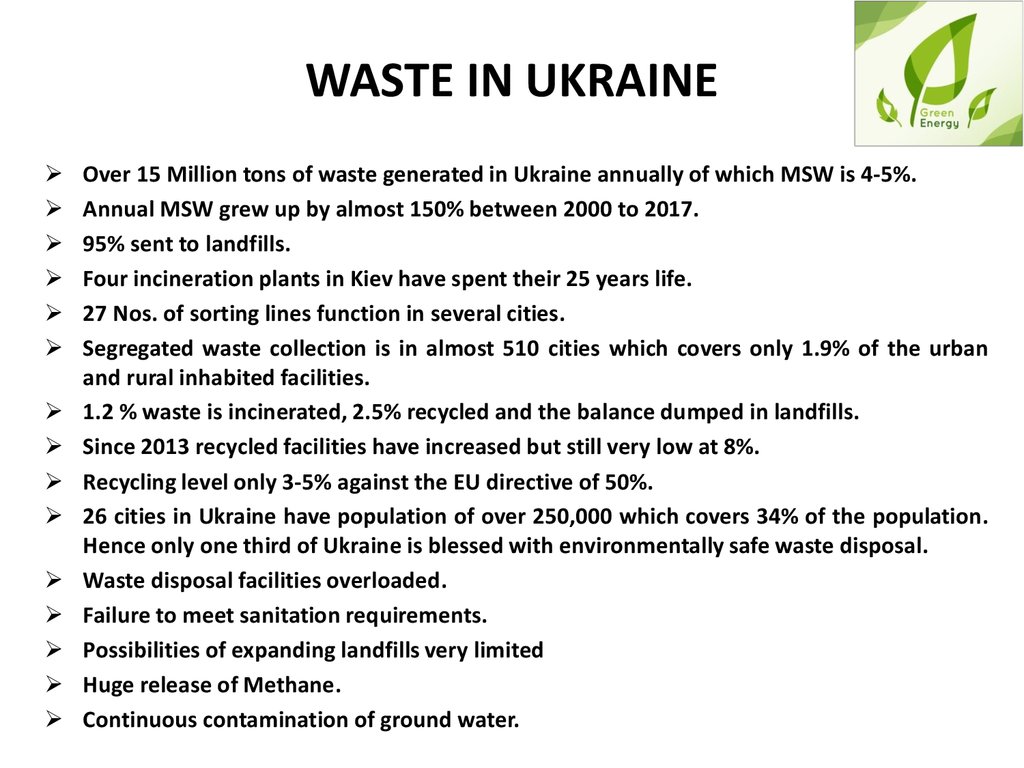
WASTE IN UKRAINEOver 15 Million tons of waste generated in Ukraine annually of which MSW is 4-5%.
Annual MSW grew up by almost 150% between 2000 to 2017.
95% sent to landfills.
Four incineration plants in Kiev have spent their 25 years life.
27 Nos. of sorting lines function in several cities.
Segregated waste collection is in almost 510 cities which covers only 1.9% of the urban
and rural inhabited facilities.
1.2 % waste is incinerated, 2.5% recycled and the balance dumped in landfills.
Since 2013 recycled facilities have increased but still very low at 8%.
Recycling level only 3-5% against the EU directive of 50%.
26 cities in Ukraine have population of over 250,000 which covers 34% of the population.
Hence only one third of Ukraine is blessed with environmentally safe waste disposal.
Waste disposal facilities overloaded.
Failure to meet sanitation requirements.
Possibilities of expanding landfills very limited
Huge release of Methane.
Continuous contamination of ground water.
31.
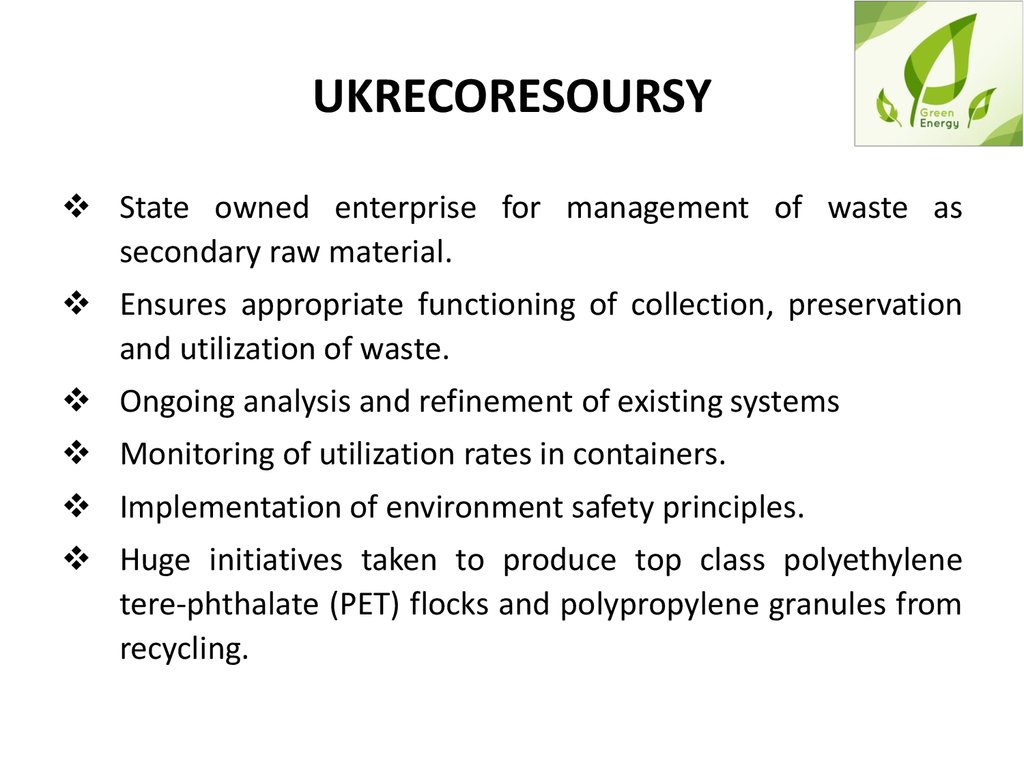
UKRECORESOURSYState owned enterprise for management of waste as
secondary raw material.
Ensures appropriate functioning of collection, preservation
and utilization of waste.
Ongoing analysis and refinement of existing systems
Monitoring of utilization rates in containers.
Implementation of environment safety principles.
Huge initiatives taken to produce top class polyethylene
tere-phthalate (PET) flocks and polypropylene granules from
recycling.
32.
NATIONAL PROJECTCLEAN CITY
Target to upgrade MSW management system
Construction of 10 recycling complexes in Kyiv, Kharkiv, Dnipropetrovsk,
Chernivtsi, Ternopil, Khmelnytskyi, Lviv, Sumy, Dnipropetrovsk, Donetsk and
Lugansk.
Public – Private Partnership model to be considered.
Legislation proposed that from January 2018 only waste after primary recycling
and incineration can be disposed.
National Waste Management Program 2013-2020 approved by Govt. of
Ukraine.
Introduce new technologies
Implementation of measures for decreasing volume of waste
Grant of 466 million Euros out of which 37% will be financed from Sate budget
and 63% from local budgets.
First phase would focus on removal of dangerous toxic waste.
Second phase would focus on creation of modern infrastructure for waste
management.
33.
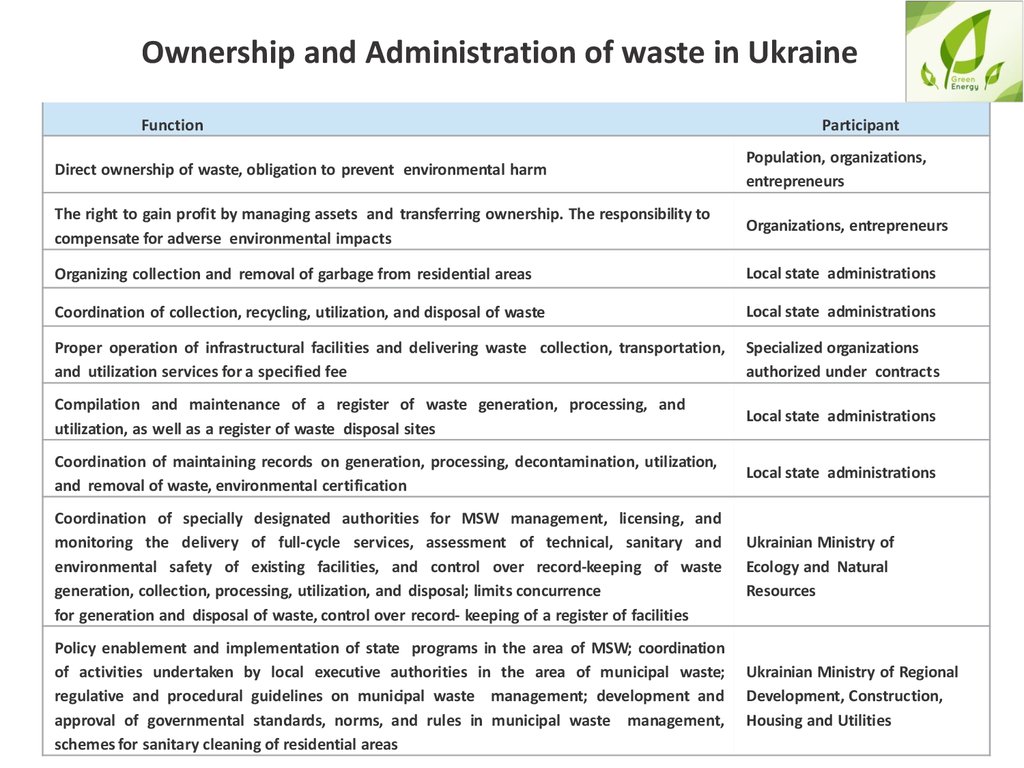
Ownership and Administration of waste in UkraineFunction
Participant
Direct ownership of waste, obligation to prevent environmental harm
Population, organizations,
entrepreneurs
The right to gain profit by managing assets and transferring ownership. The responsibility to
compensate for adverse environmental impacts
Organizations, entrepreneurs
Organizing collection and removal of garbage from residential areas
Local state administrations
Coordination of collection, recycling, utilization, and disposal of waste
Local state administrations
Proper operation of infrastructural facilities and delivering waste collection, transportation,
and utilization services for a specified fee
Specialized organizations
authorized under contracts
Compilation and maintenance of a register of waste generation, processing, and
utilization, as well as a register of waste disposal sites
Local state administrations
Coordination of maintaining records on generation, processing, decontamination, utilization,
and removal of waste, environmental certification
Local state administrations
Coordination of specially designated authorities for MSW management, licensing, and
monitoring the delivery of full-cycle services, assessment of technical, sanitary and
environmental safety of existing facilities, and control over record-keeping of waste
generation, collection, processing, utilization, and disposal; limits concurrence
for generation and disposal of waste, control over record- keeping of a register of facilities
Ukrainian Ministry of
Ecology and Natural
Resources
Policy enablement and implementation of state programs in the area of MSW; coordination
of activities undertaken by local executive authorities in the area of municipal waste;
regulative and procedural guidelines on municipal waste management; development and
approval of governmental standards, norms, and rules in municipal waste management,
schemes for sanitary cleaning of residential areas
Ukrainian Ministry of Regional
Development, Construction,
Housing and Utilities
34.
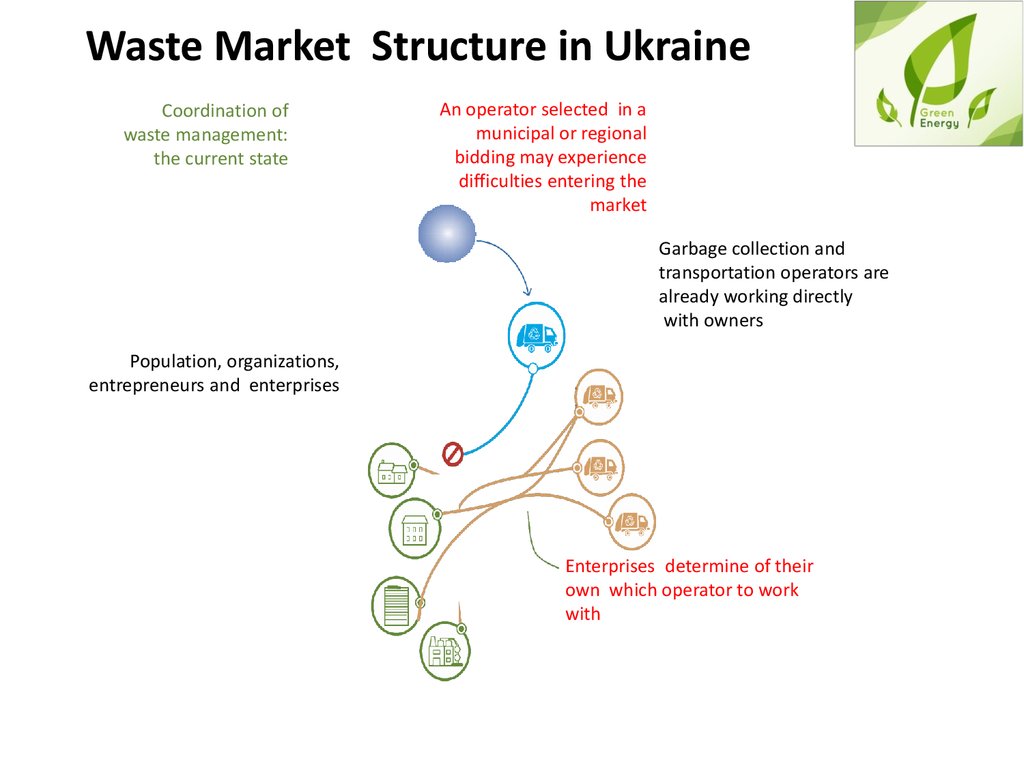
Waste Market Structure in UkraineCoordination of
waste management:
the current state
An operator selected in a
municipal or regional
bidding may experience
difficulties entering the
market
Garbage collection and
transportation operators are
already working directly
with owners
Population, organizations,
entrepreneurs and enterprises
Enterprises determine of their
own which operator to work
with
35.
36.
37.
38.
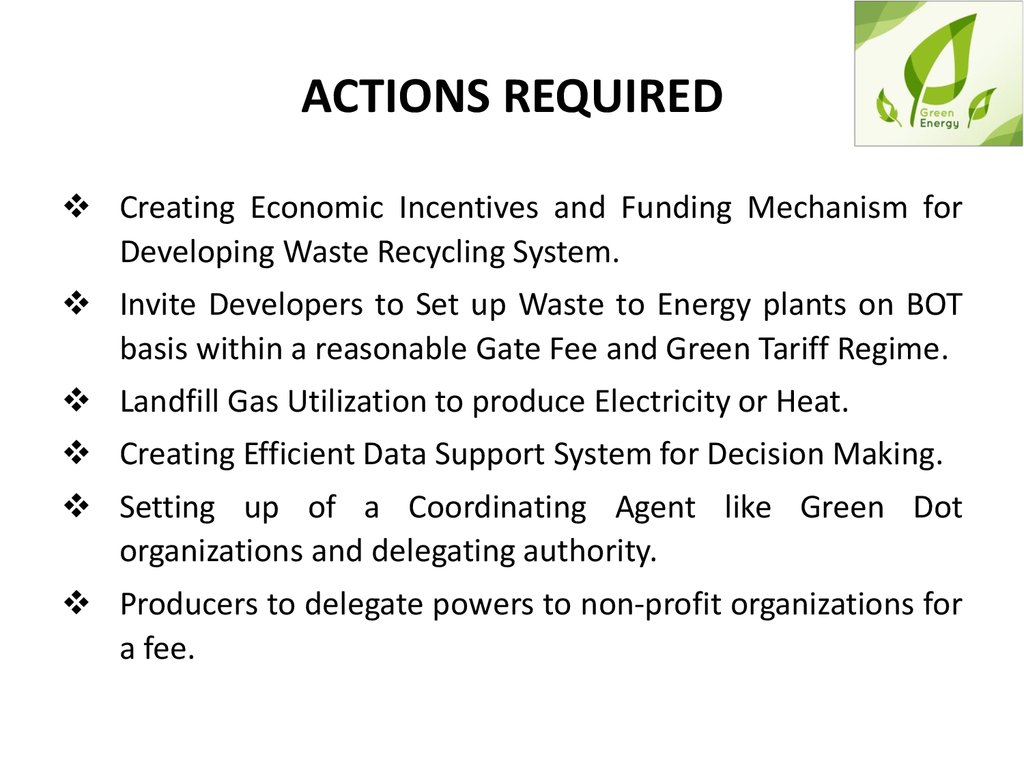
ACTIONS REQUIREDCreating Economic Incentives and Funding Mechanism for
Developing Waste Recycling System.
Invite Developers to Set up Waste to Energy plants on BOT
basis within a reasonable Gate Fee and Green Tariff Regime.
Landfill Gas Utilization to produce Electricity or Heat.
Creating Efficient Data Support System for Decision Making.
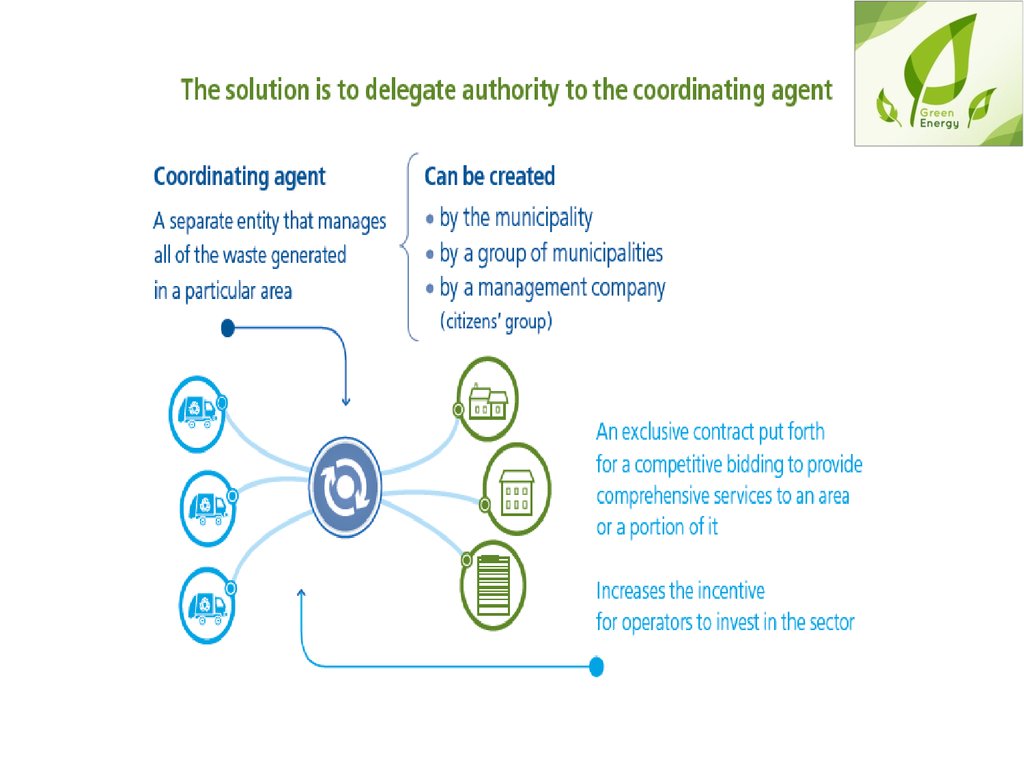
Setting up of a Coordinating Agent like Green Dot
organizations and delegating authority.
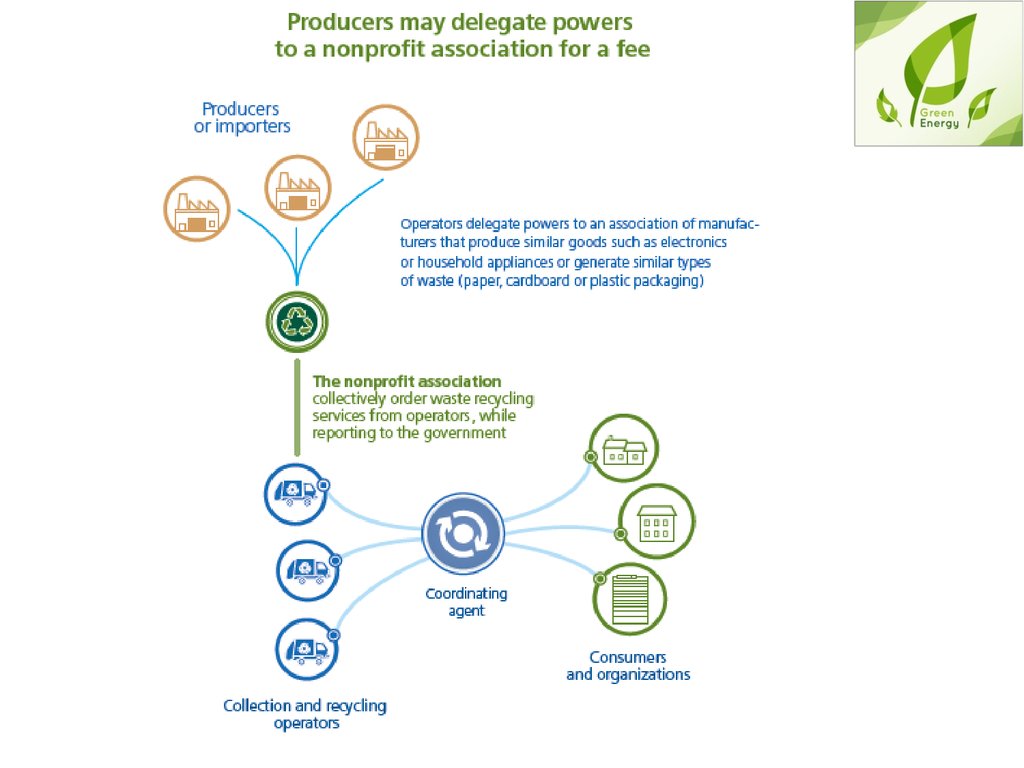
Producers to delegate powers to non-profit organizations for
a fee.
39.
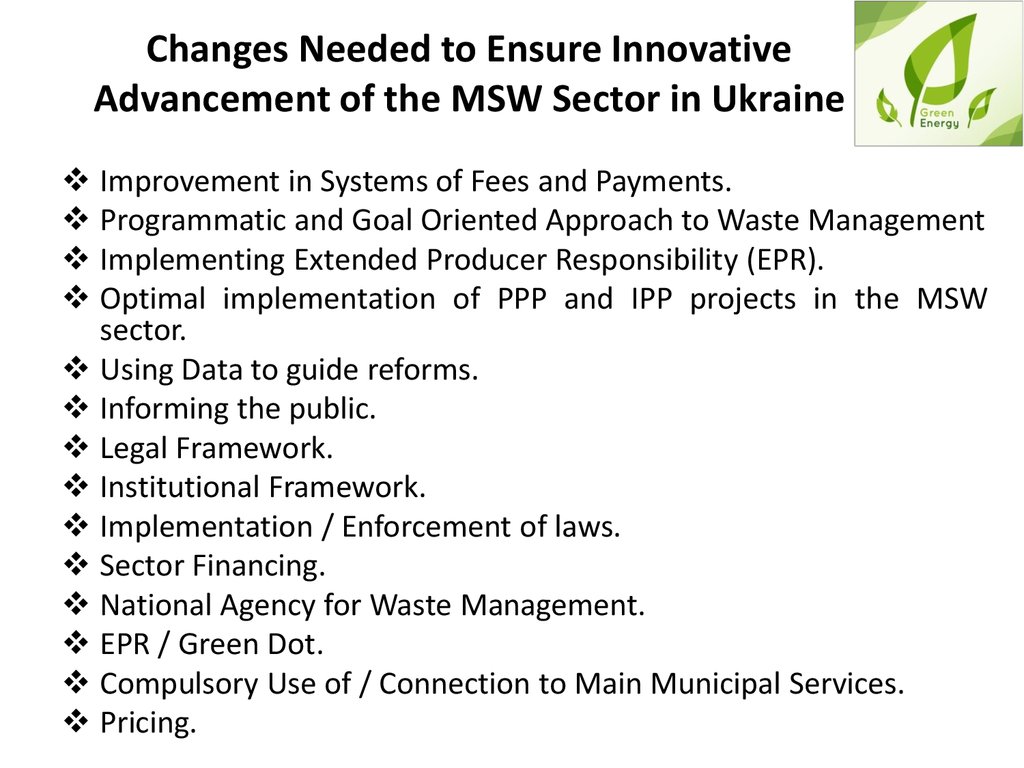
Changes Needed to Ensure InnovativeAdvancement of the MSW Sector in Ukraine
Improvement in Systems of Fees and Payments.
Programmatic and Goal Oriented Approach to Waste Management
Implementing Extended Producer Responsibility (EPR).
Optimal implementation of PPP and IPP projects in the MSW
sector.
Using Data to guide reforms.
Informing the public.
Legal Framework.
Institutional Framework.
Implementation / Enforcement of laws.
Sector Financing.
National Agency for Waste Management.
EPR / Green Dot.
Compulsory Use of / Connection to Main Municipal Services.
Pricing.
40.
41.
42.
43.
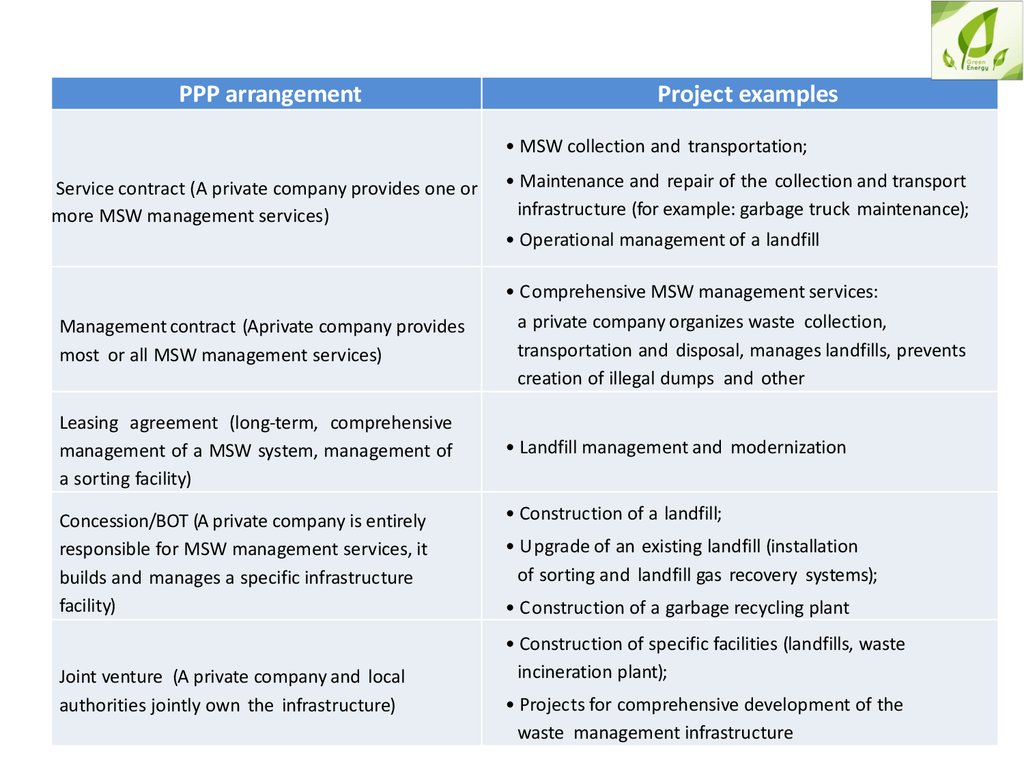
PPP arrangementProject examples
• MSW collection and transportation;
Service contract (A private company provides one or
more MSW management services)
• Maintenance and repair of the collection and transport
infrastructure (for example: garbage truck maintenance);
• Operational management of a landfill
• Comprehensive MSW management services:
Management contract (Aprivate company provides
most or all MSW management services)
Leasing agreement (long-term, comprehensive
management of a MSW system, management of
a sorting facility)
Concession/BOT (A private company is entirely
responsible for MSW management services, it
builds and manages a specific infrastructure
facility)
Joint venture (A private company and local
authorities jointly own the infrastructure)
a private company organizes waste collection,
transportation and disposal, manages landfills, prevents
creation of illegal dumps and other
• Landfill management and modernization
• Construction of a landfill;
• Upgrade of an existing landfill (installation
of sorting and landfill gas recovery systems);
• Construction of a garbage recycling plant
• Construction of specific facilities (landfills, waste
incineration plant);
• Projects for comprehensive development of the
waste management infrastructure
44.
WTEENTERPRENEUR