


 География
Похожие презентации:


Country Profile
1.
201x Country Profile• Country map (with capital city
identified)
• Population size
• GDP
• Seasonal temperature averages
• Prevalent type of transport
Sources: _________________________________
2.
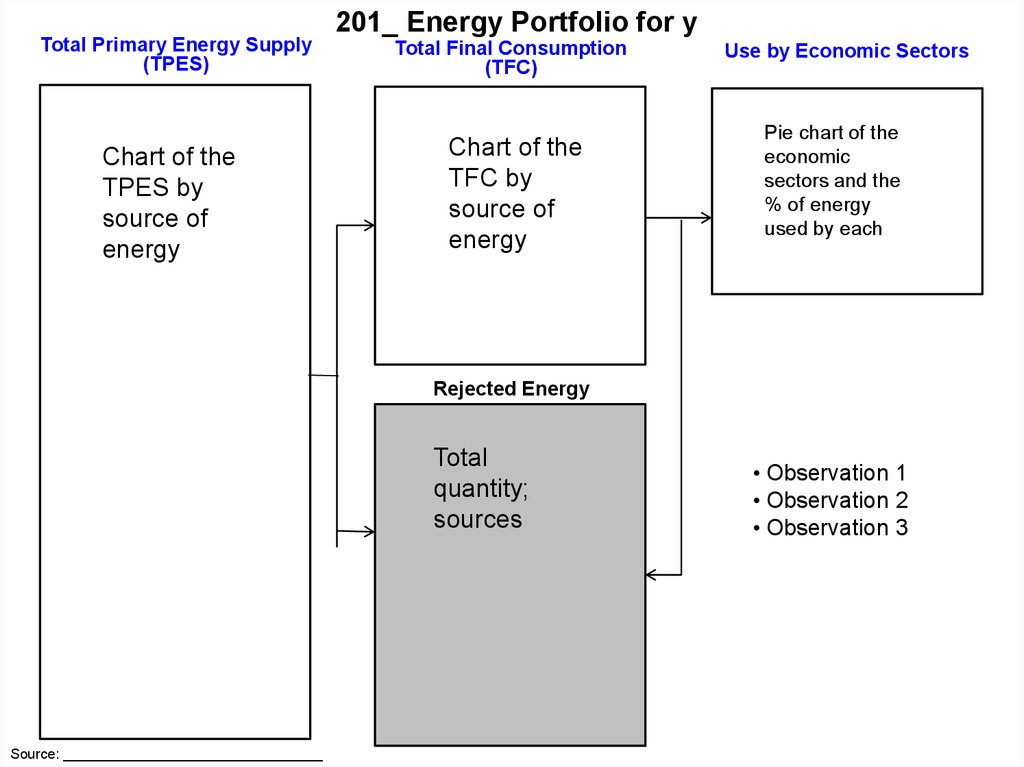
Total Primary Energy Supply(TPES)
Chart of the
TPES by
source of
energy
201_ Energy Portfolio for y
Total Final Consumption
(TFC)
Chart of the
TFC by
source of
energy
Use by Economic Sectors
Pie chart of the
economic
sectors and the
% of energy
used by each
Rejected Energy
Total
quantity;
sources
Source: _________________________________
• Observation 1
• Observation 2
• Observation 3
3.
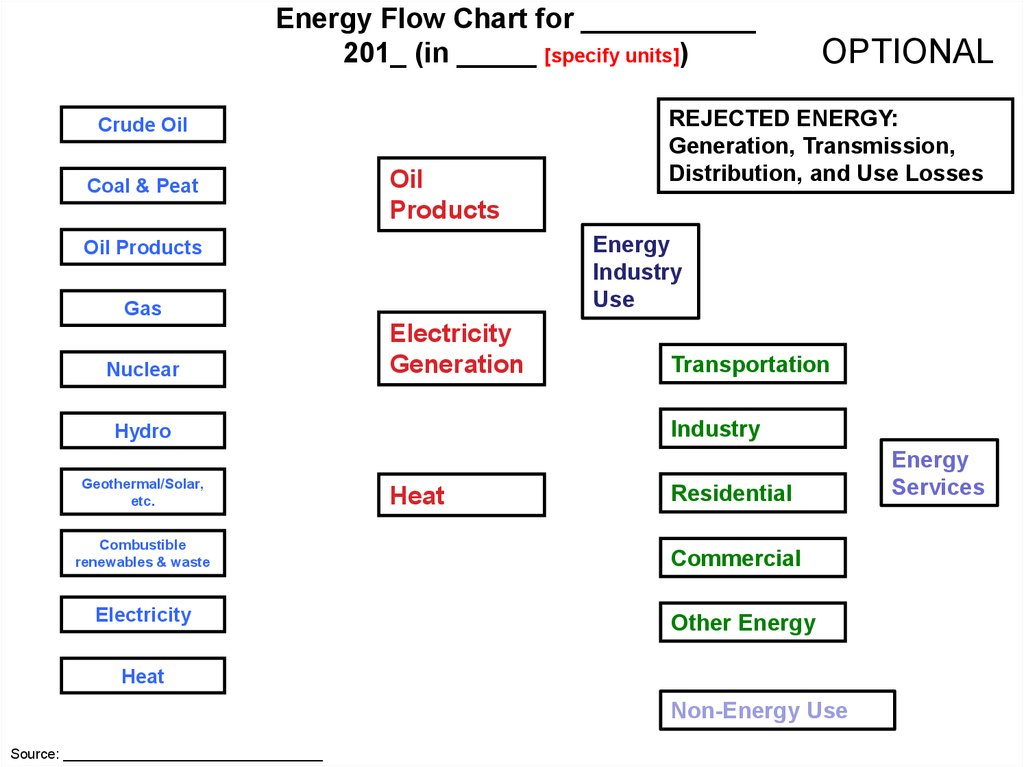
Energy Flow Chart for ___________201_ (in _____ [specify units])
Crude Oil
Coal & Peat
Oil
Products
Gas
Electricity
Generation
Combustible
renewables & waste
Electricity
Transportation
Industry
Hydro
Geothermal/Solar,
etc.
REJECTED ENERGY:
Generation, Transmission,
Distribution, and Use Losses
Energy
Industry
Use
Oil Products
Nuclear
OPTIONAL
Heat
Residential
Commercial
Other Energy
Heat
Non-Energy Use
Source: _________________________________
Energy
Services
4.
Overview of Renewable Energy for ______________(201X)
Source: _________________________________
5.
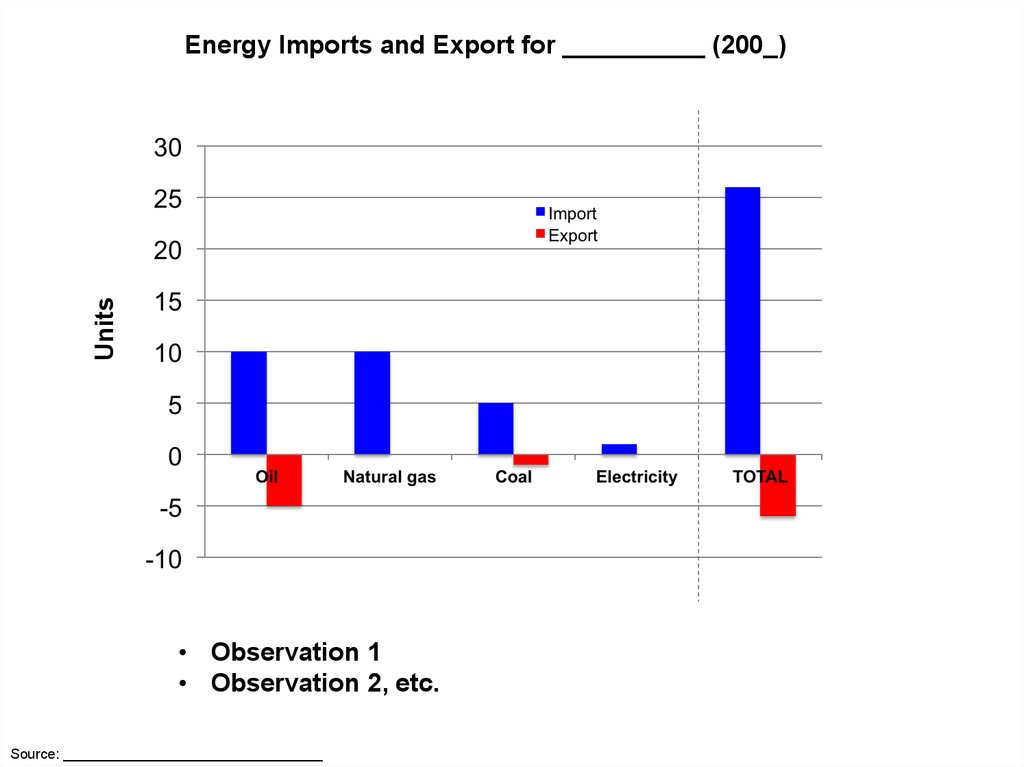
UnitsEnergy Imports and Export for __________ (200_)
• Observation 1
• Observation 2, etc.
Source: _________________________________
6.
Energy Imports and Export for __________ (201_)Energy Intensity
Graphic that
compares
• Observation 1
• Observation 2
• Observation 3
Sources: _________________________________
Per capita energy use
Graphic that
compares
7.
Affordability & Market Distortion for __________ (201_)Artificial Prices
Graphic that
compares to
international
prices for
gasoline, natural
gas, electricity,
electricity prices
for industry
• Observation 1
• Observation 2
• Observation 3
Sources: _________________________________
Energy Imports
As % of
GDP, and
compare to
benchmarks
8.
Environmental Sustainability for __________ (201_)Efficiency of Generation
CO2/kWh and
graph that
compares that
N2O, CH4,
fuel
efficiency
(miles per
gallon), other
Low carbon fuels
• Observation 1
• Observation 2
• Observation 3
Sources: _________________________________
Other emissions
% for renewables
and nuclear as
share of
consumption
9.
Energy Access & Security for __________ (201_)Diversity of Supply
Level & Quality of Access
Number of supply
sources
(domestic &
import)/ Diversity
& graph
comparing that
% electrification
of population, %
population using
solid fuels for
cooking & graph
comparing that
Self-Sufficiency
• Observation 1
• Observation 2
• Observation 3
Sources: _________________________________
Energy imports as
% of all energy
use,
Diversification of
net imports (# of
sources)
10. Energy Architecture Performance
• Observation 1• Observation 2
• Observation 3