


")
")


")
")
")
")
")


")


 Медицина
Похожие презентации:


Right Heart Catheterization: Swan-Ganz Catheter
1. Right Heart Catheterization: Swan-Ganz Catheter
2. Right Heart Catheterization
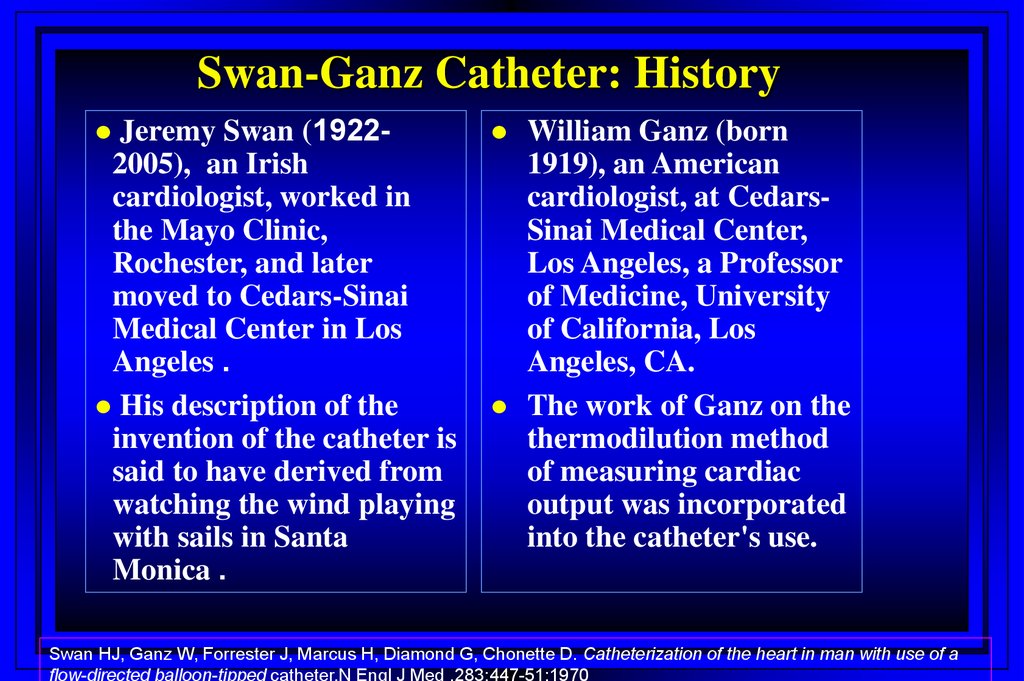
Swan-Ganz Catheter: HistoryRight Heart Catheterization
Jeremy Swan (1922-2005),
an Irish cardiologist, worked
in the Mayo Clinic,
Rochester, and later moved to
Cedars-Sinai Medical Center
in Los Angeles .
His invention of the catheter
is said to have derived from
watching the wind playing
with sails in Santa Monica .
3.
Swan-Ganz Catheter: HistoryJeremy Swan (19222005), an Irish
cardiologist, worked in
the Mayo Clinic,
Rochester, and later
moved to Cedars-Sinai
Medical Center in Los
Angeles .
His description of the
invention of the catheter is
said to have derived from
watching the wind playing
with sails in Santa
Monica .
William Ganz (born
1919), an American
cardiologist, at CedarsSinai Medical Center,
Los Angeles, a Professor
of Medicine, University
of California, Los
Angeles, CA.
The work of Ganz on the
thermodilution method
of measuring cardiac
output was incorporated
into the catheter's use.
Swan HJ, Ganz W, Forrester J, Marcus H, Diamond G, Chonette D. Catheterization of the heart in man with use of a
flow-directed balloon-tipped catheter.N Engl J Med .283:447-51;1970
4. Swan-Ganz Catheter
5. The Pulmonary Artery Catheter: Swan-Ganz Catheter
6. Principal Indications for Swan-Ganz Catheter
Shock of unclear etiology (cardiogenic, RV infarction,septic, hemorrhagic)
Acute left ventricular failure of unclear etiology
Acute respiratory failure of unclear etiology
Pulmonary hypertension
Cardiac tamponade
7. Right Heart Catheterization
8.
Time (msec) 0100
300
400
500
600
700
800
QRS
Complex
EKG
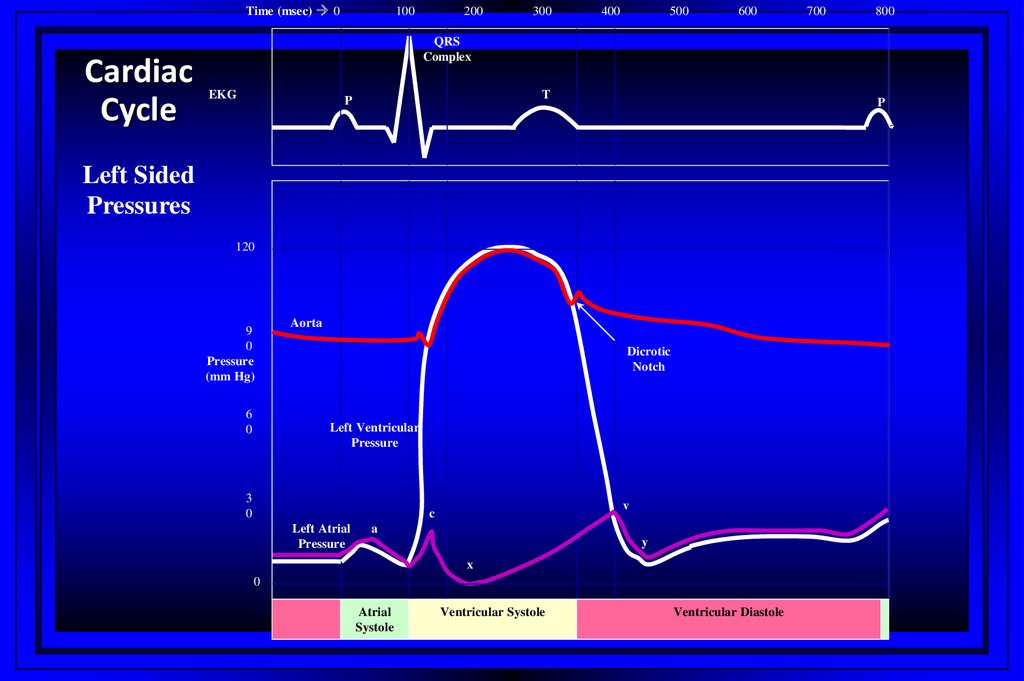
Cardiac Cycle
200
T
P
P
Right Sided
Pressures
30
PA Pressure
Dicrotic
Notch
Pressure
(mm Hg)
15
Right Ventricular
Pressure
v
c
Right Atrial
Pressure
a
y
x
0
Atrial
Systole
Ventricular Systole
Ventricular Diastole
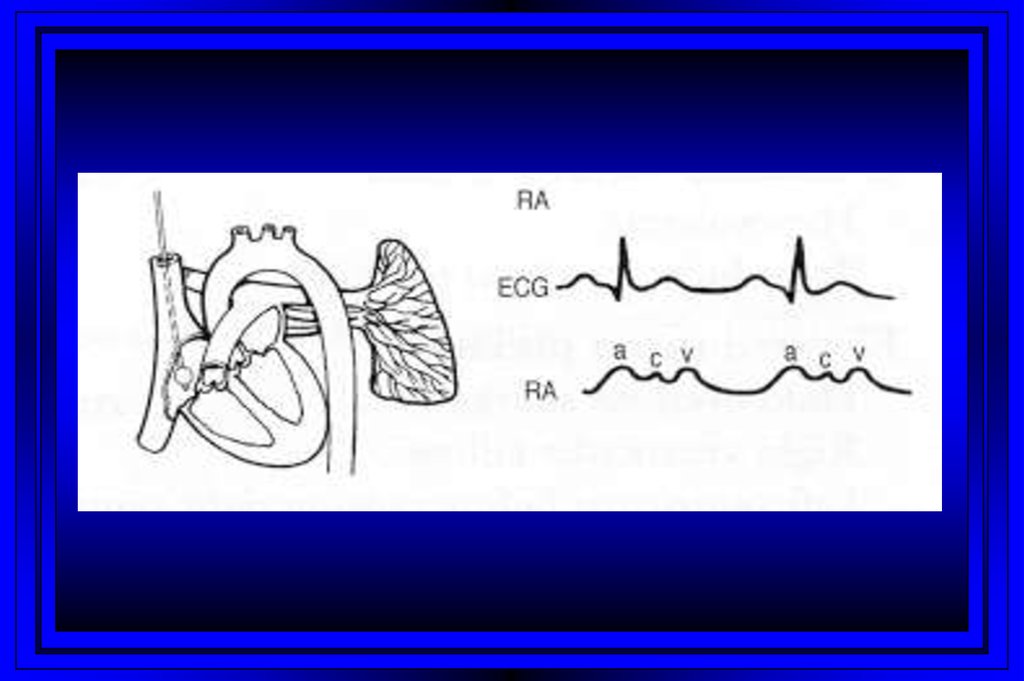
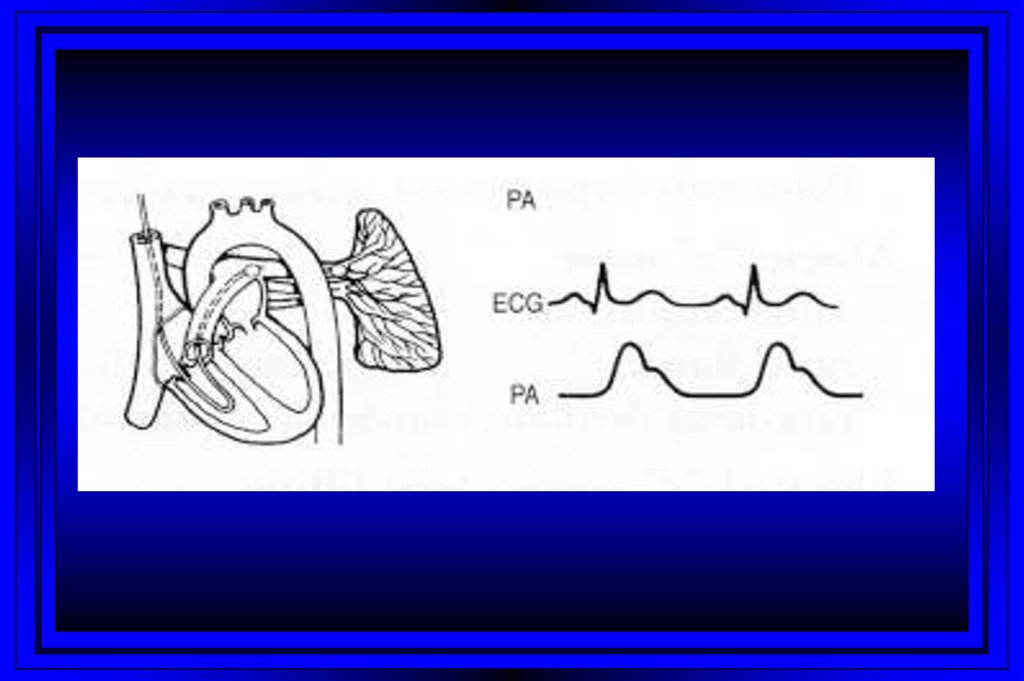
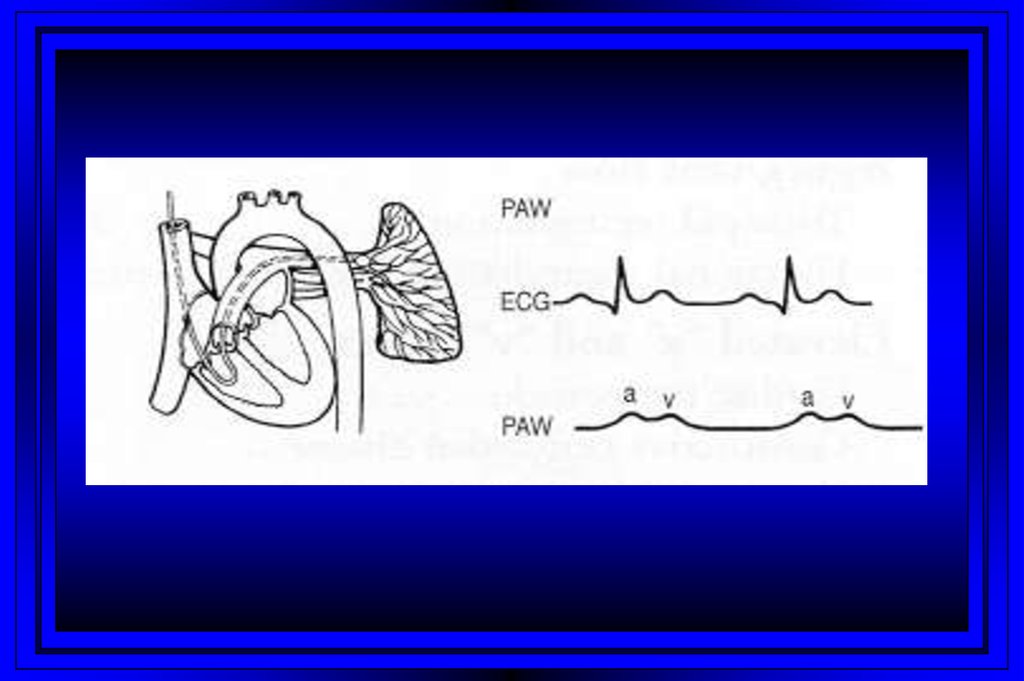
9.
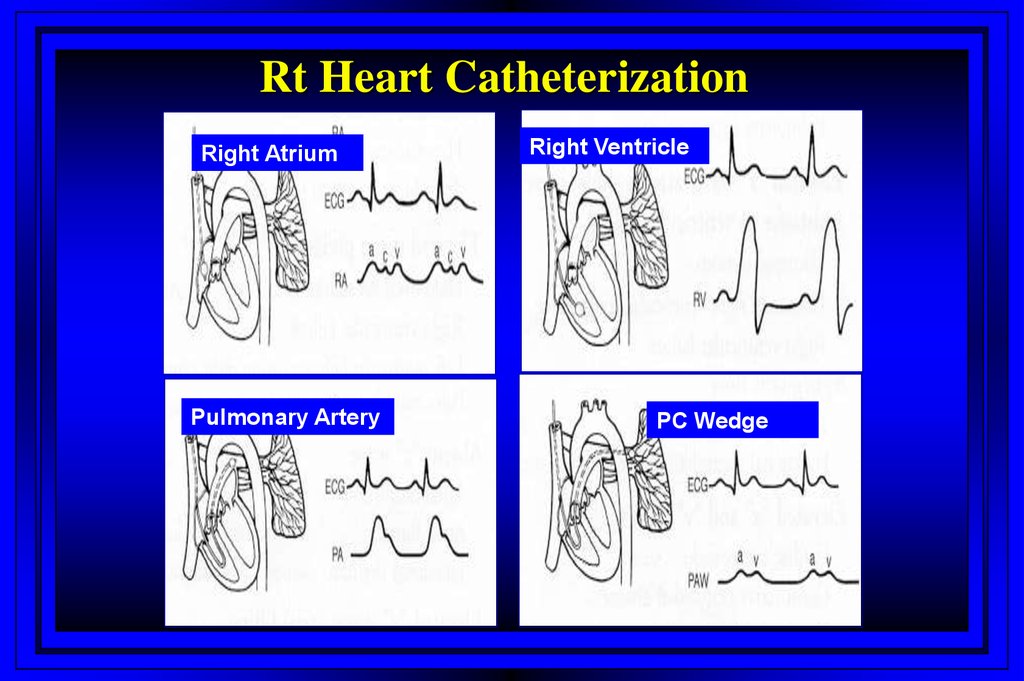
Rt Heart CatheterizationRight Atrium
Pulmonary Artery
Right Ventricle
PC Wedge
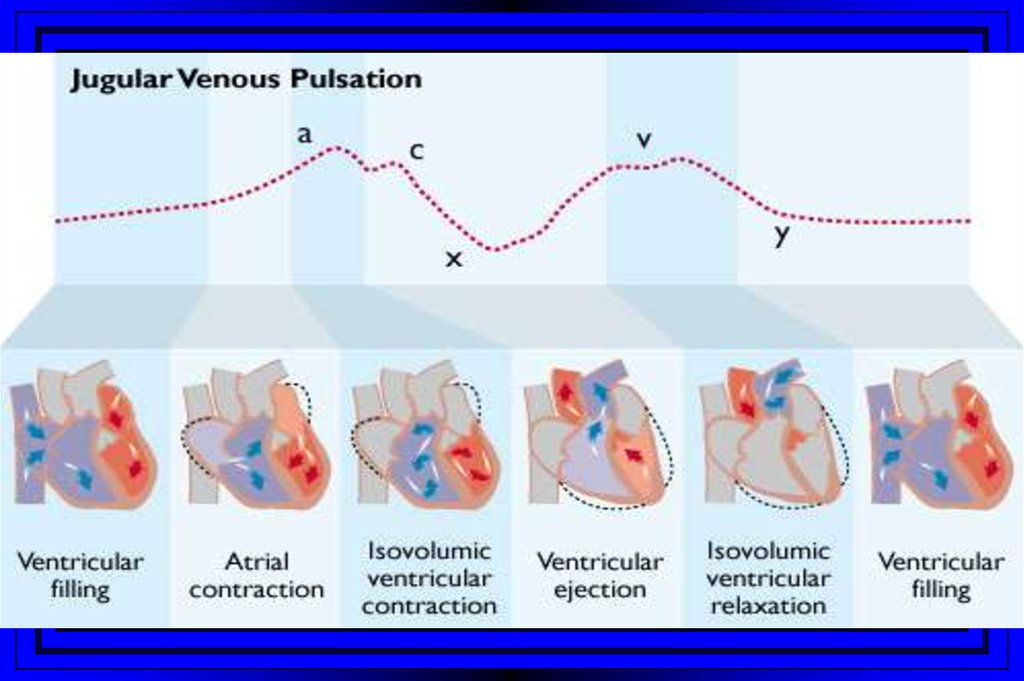
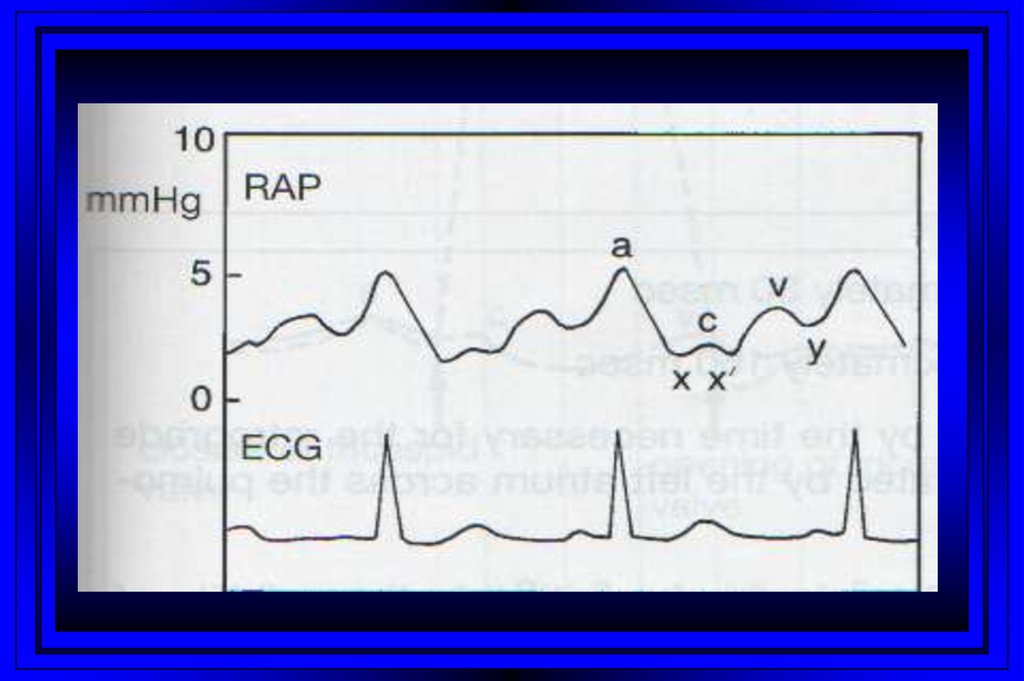
10. Jugular Venous Pulsations
A wave – backward flow of blood produced after atrial contractionC wave – tricuspid valve closing after ventricular systole
X descent – just after the c wave, a drop in jugular pressure as a result of isovolumic
ventricular contraction and early atrial filling
V wave – resulting from back-pressure from right atrial filling and ventricular
contraction
Y descent – follows the V wave , is a result of the tricuspid valve opening and passive
filling of the ventricle during ventricular relaxation
11.
12.
13.
14.
15.
16.
Time (msec) 0Cardiac
Cycle
100
200
300
400
500
600
700
800
QRS
Complex
EKG
T
P
P
Left Sided
Pressures
120
9
0
Pressure
(mm Hg)
6
0
Aorta
Dicrotic
Notch
Left Ventricular
Pressure
3
0
v
c
Left Atrial
Pressure
a
y
x
0
Atrial
Systole
Ventricular Systole
Ventricular Diastole
17.
18. Normal Cardiac Hemodynamics (Adult)
Pressure siteSystolic pressure
Diastolic pressure
Mean Pressure
0 – 8 mmHg
Rt atrium
Rt ventricle
15 – 30 mmHg
0 – 8 mmHg
Pulmonary artery
15 – 30 mmHg
5 – 15 mmHg
10 – 18mmHg
1 – 12mmHg
Pulmonary art
wedge
Lt ventricle
90 – 140 mmHg
2 – 12mmHg
Aorta
90 – 140 mmHg
60 – 90mmHg
70 – 105mmHg
19. Normal Cardiac Hemodynamics (Adult)
Fick CO– CO
– CI
Vascular resistance
– SVR
– PVR
Valve gradients
– Aortic
– Mitral
Valve area
– Aortic
– Mitral
Ejection fraction
3.5 – 8.5 L/min
2.5 – 4.5 L/min/m2
640 - 1200 dyne-sec-cm
45 -120 dyne-sec-cm
<10 mmHg
Negligible
2.0 - 3.0 cm2
4.0 - 6.0 cm2
50 – 60 %
20. Oxygen Parameters
ParameterNormal Range
Partial pressure of arterial O2 (PaO2)
80-100 mm Hg
Partial pressure of arterial CO2 (PaCO2)
35-45 mm Hg
Bicarbonate (HCO3)
22-28mEq/L
pH
7.38-7.42
Arterial oxygen saturation (SaO2)
95-100%
Mixed venous saturation (SvO2)
60-80%
Oxygen consumption (VO2)
200-250 ml/min
21.
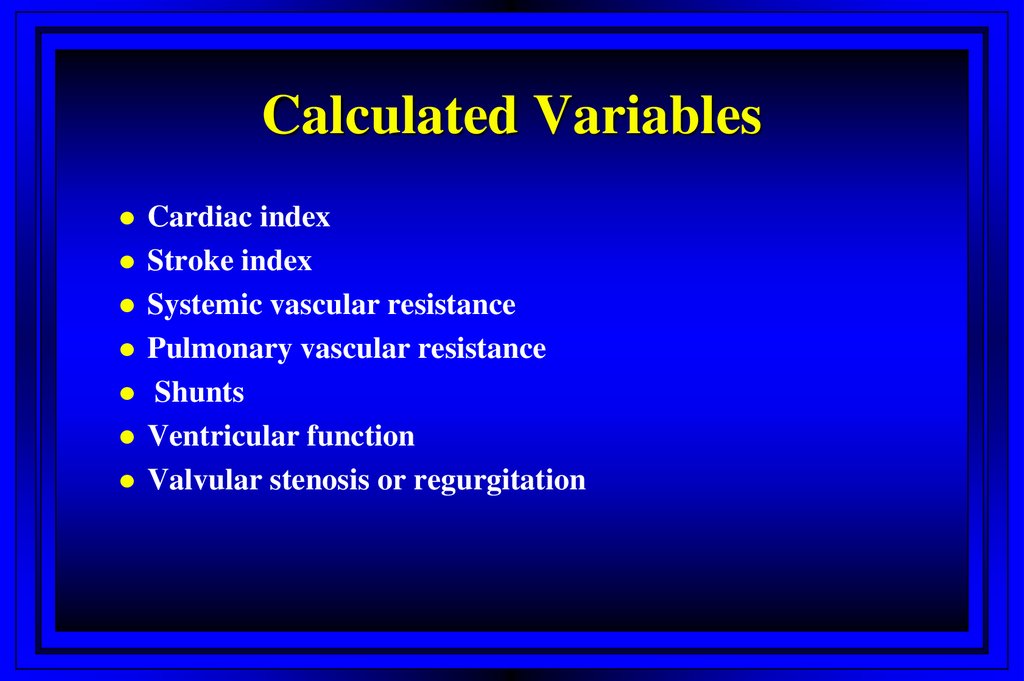
Calculated VariablesCardiac index
Stroke index
Systemic vascular resistance
Pulmonary vascular resistance
Shunts
Ventricular function
Valvular stenosis or regurgitation
22. Measured Variables
Stenotic OrificesGradients
Valve orifice cross-sectional areas
Measurements assist in making decisions
regarding surgical intervention
23. Calculated Variables
24. Stenotic Orifices
Mitral StenosisDiastolic gradient from the left
atrium to the left ventricle
– Atrial myxoma may produce
similar findings
25.
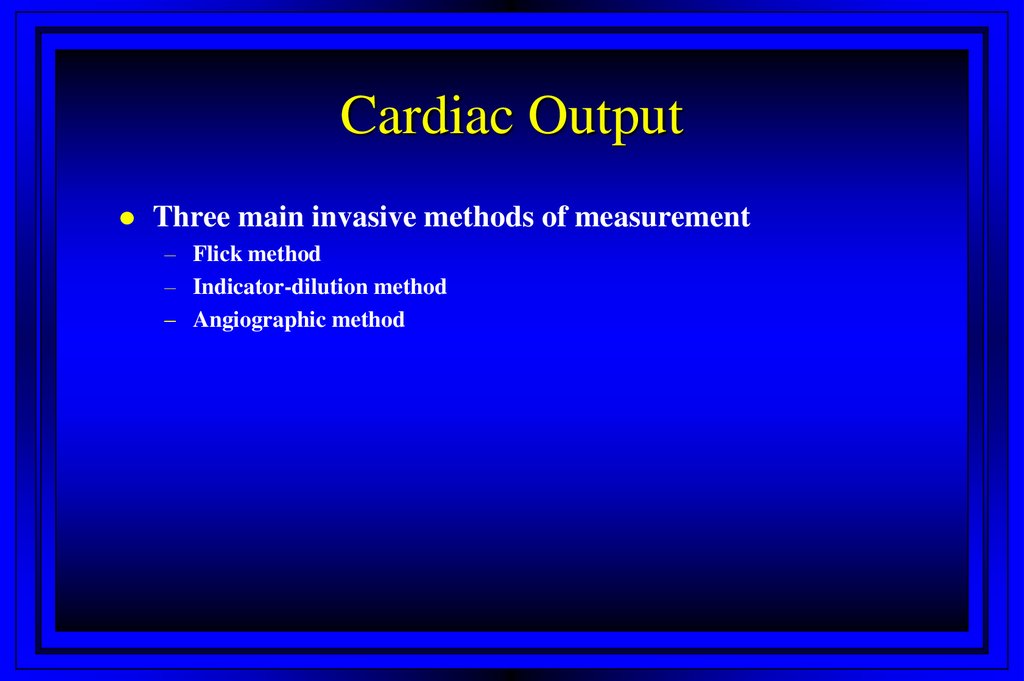
Cardiac OutputThree main invasive methods of measurement
– Flick method
– Indicator-dilution method
– Angiographic method
26. Mitral Stenosis
Fick MethodThe amount of oxygen extracted by the lungs from air = The amount taken up by
blood in its passage through the lungs
• rate of lung oxygen extraction (estimated)
• oxygen content of the pulmonary arterial and pulmonary venous blood
• the rate of pulmonary blood flow can be calculated
• pulmonary blood flow=cardiac output (Unless there is a shunt)
•CO=O2 consumption/AVO2 difference x 1.36 x Hgb x 10 (L/min)
27. Cardiac Output
The Indicator-dilution Technique andThermodilution Technique
• Dilution of an indicator is proportional to the volume of fluid to which it is
added
• If the amount and concentration (Temperature) of an indicator is known the
volume of fluid in which it is diluted can be calculated
• The most common is the thermodilution method
28. Fick Method
Cardiac Output (High)Acute
–
–
–
–
–
–
–
Acute hypervolemia
ARDS, severe pneumonia
Septic shock
Acute intoxications
Fever, heat stress, malignant hyperthermia
Anxiety, emotional stress
Delirium tremens
29. The Indicator-dilution Technique and Thermodilution Technique
Cardiac Output (High)Chronic
–
–
–
–
–
–
–
–
Severe chronic anemia
Cirrhosis
Chronic renal failure
Pregnancy
Thyrotoxicosis
Polycythemia vera
Labile hypertension
Congenital heart disease (PDA)
30. Cardiac Output (High)
Cardiac Output (Low)Acute
– Acute hypovolemia (absolute or relative)
– Acute severe pulmonary hypertension
– Acute myocardial pump failure (cardiogenic shock)
• extensive MI
• myocardial toxic injury (ethanol, CO poisoning, septic shock)
• following cardiopulmonary bypass
– Acute impairment of ventricular filling
• Increased intrathoracic pressure
• Cardiac tamponade
• Stunned myocardium
• Acute ischemia
31. Cardiac Output (High)
Cardiac Output (Low)Acute
– Arrhythmias
• Sustained VT
• Extreme bradycardia
– Acute inotropic changes in a failing myocardium
• Beta-blockers
• Ischemia
• Acidosis
32. Cardiac Output (Low)
Chronic– Chronic severe pulmonary hypertension
– Chronic myocardial pump failure
• Ischemia
• Hypertensive or dilated cardiomyopathy
• Severe valvular heart disease
– Chronic impairment of ventricular filling
• Constrictive pericarditis
• Restrictive cardiomyopathy
• Mitral or tricuspid stenosis
• Atrial myxoma
33. Cardiac Output (Low)
ShuntsDemonstrated by an absence of an expected pressure
difference
With a significant ASD the left and right mean atrial
pressures are within 5 mmHg
With VSD’s the ventricular pressures may also
equilibrate
34. Cardiac Output (Low)
ShuntsEvaluation of shunts requires:
–
–
–
–
Detection
Classification
Localization
Quantitation
35. Shunts
Left to Right Shunts• Mixing of saturated (systemic arterial or
pulmonary venous) with desaturated
(systemic venous or pulmonary arterial)
blood on the right side of the circulation
• Increased pulmonary blood-flow relative
to the systemic blood-flow
36. Shunts
Right to Left Shunts• Mixing of desaturated (systemic venous or pulmonary arterial)
with saturated (systemic arterial or pulmonary venous) blood on
the left side of the circulation, thus creating a oxygen step-down
• Decreased pulmonary blood flow relative to systemic blood flow
37. Left to Right Shunts
Pulmonary Hypertension: Role of Right HeartCatheterization
For
diagnosis
For evaluating acute vasodilator response
For evaluating progression
For treatment selection
Lung vs. heart-lung transplantation
38. Right to Left Shunts
PAH: Hemodynamic DefinitionNormal
High
Severe
PAsystolic, mm Hg
18-30
>30-50
>50
PAdiastolic, mm Hg
6-10
>10-25
>25
PAmean, mm Hg
12-20
25-35
>35
TPG, mm Hg
2-10
10-25
>15
PVR, Wood Units
0.5-2
2-5
>5
PA = pulmonary artery; PVR = pulmonary vascular resistance;
TPG = transpulmonary gradient
39.
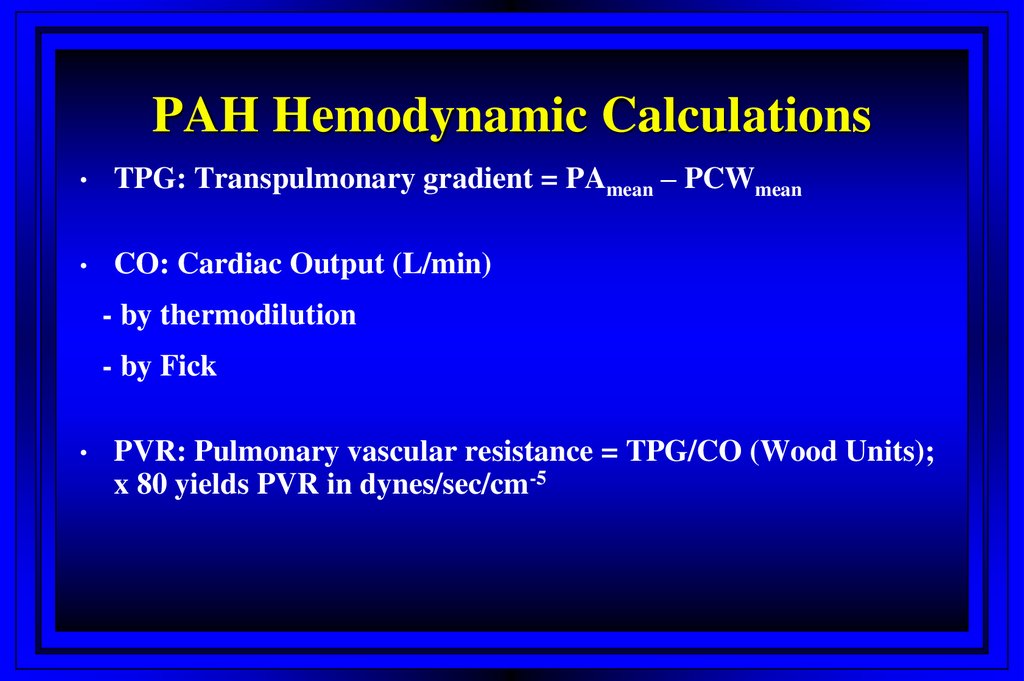
PAH Hemodynamic CalculationsTPG: Transpulmonary gradient = PAmean – PCWmean
CO: Cardiac Output (L/min)
- by thermodilution
- by Fick
PVR: Pulmonary vascular resistance = TPG/CO (Wood Units);
x 80 yields PVR in dynes/sec/cm-5
40. PAH: Hemodynamic Definition
Swan-Ganz Catheter Related ComplicationsComplication
%
Access site hematoma
4%
Arterial puncture
3%
Arrhythmia
3%
Pneumothorax
0.4%
Hemothorax
0.2%
Harvey S et al. The Lancet 2005; 366:472-477
41. PAH Hemodynamic Calculations
Wiggers Diagram42.
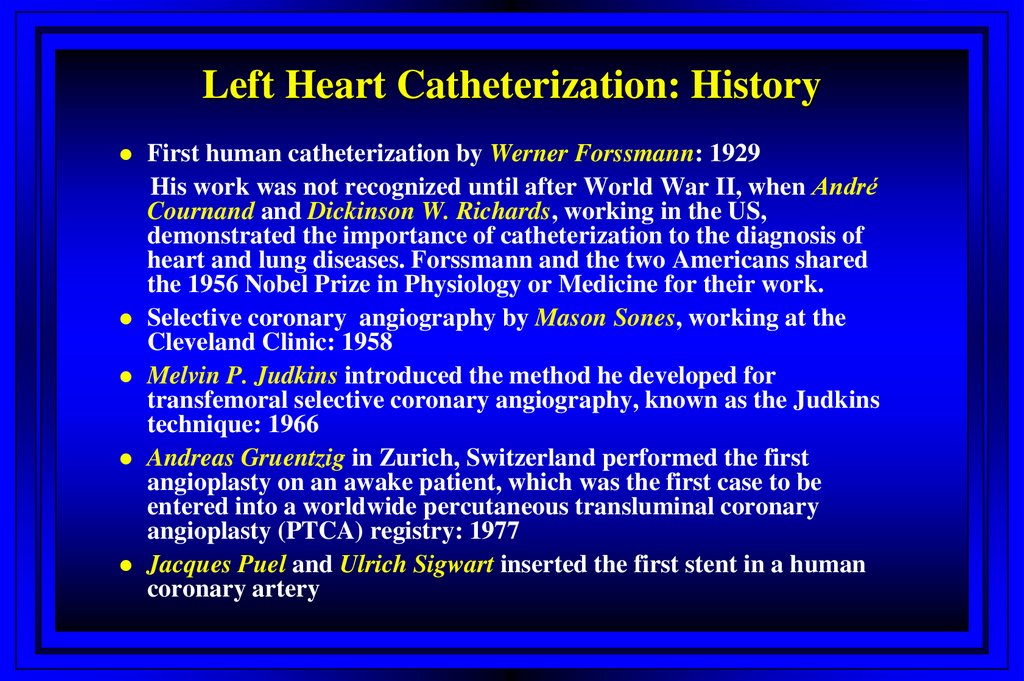
Left Heart Catheterization: HistoryFirst human catheterization by Werner Forssmann: 1929
His work was not recognized until after World War II, when André
Cournand and Dickinson W. Richards, working in the US,
demonstrated the importance of catheterization to the diagnosis of
heart and lung diseases. Forssmann and the two Americans shared
the 1956 Nobel Prize in Physiology or Medicine for their work.
Selective coronary angiography by Mason Sones, working at the
Cleveland Clinic: 1958
Melvin P. Judkins introduced the method he developed for
transfemoral selective coronary angiography, known as the Judkins
technique: 1966
Andreas Gruentzig in Zurich, Switzerland performed the first
angioplasty on an awake patient, which was the first case to be
entered into a worldwide percutaneous transluminal coronary
angioplasty (PTCA) registry: 1977
Jacques Puel and Ulrich Sigwart inserted the first stent in a human
coronary artery
43.
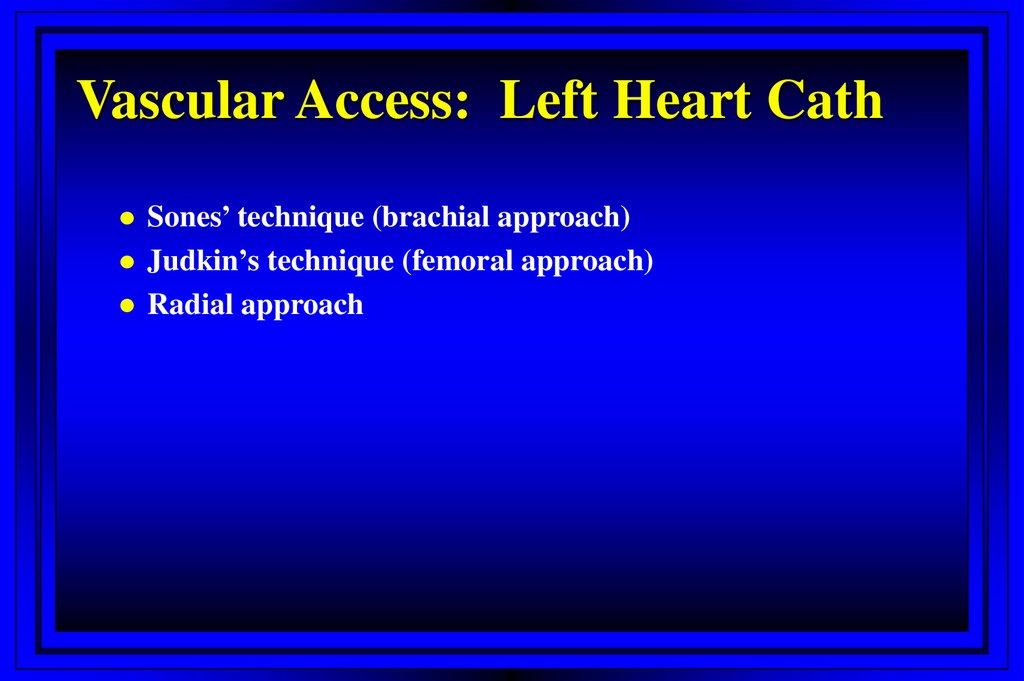
Vascular Access: Left Heart CathSones’ technique (brachial approach)
Judkin’s technique (femoral approach)
Radial approach
44. Left Heart Catheterization: History
Left Heart CatheterizationCoronary angiography
Left ventriculogram
Ascending aortogram
Pressure measurements in LV/aorta
45.
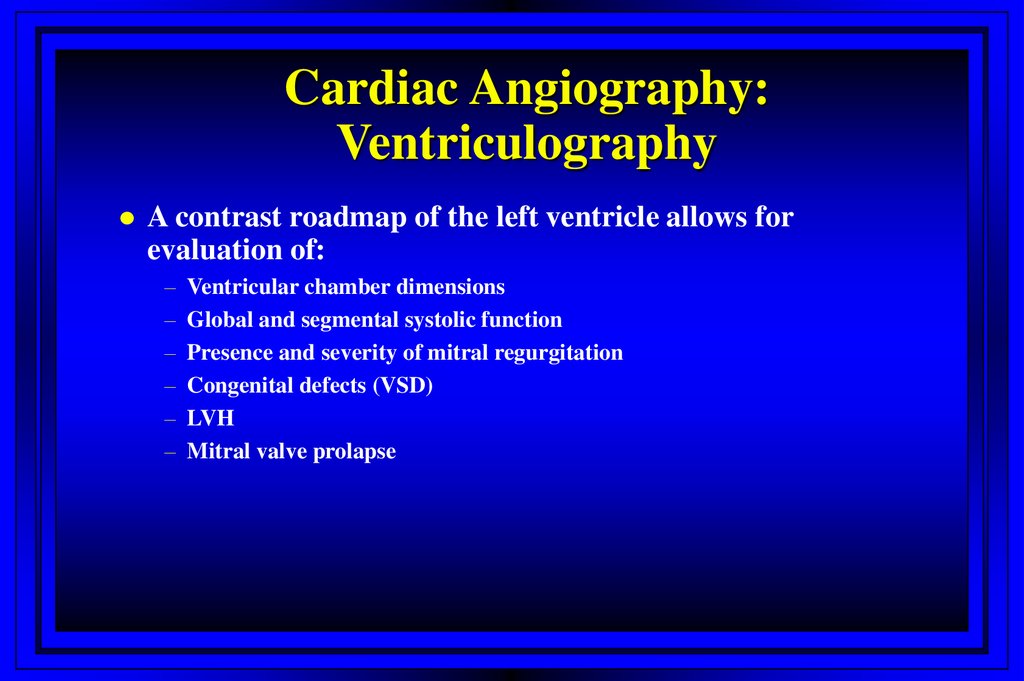
Cardiac Angiography:Ventriculography
A contrast roadmap of the left ventricle allows for
evaluation of:
–
–
–
–
–
–
Ventricular chamber dimensions
Global and segmental systolic function
Presence and severity of mitral regurgitation
Congenital defects (VSD)
LVH
Mitral valve prolapse
46. Left Heart Catheterization
Wall Motion Abnormalities47.
Aortic Stenosis48.
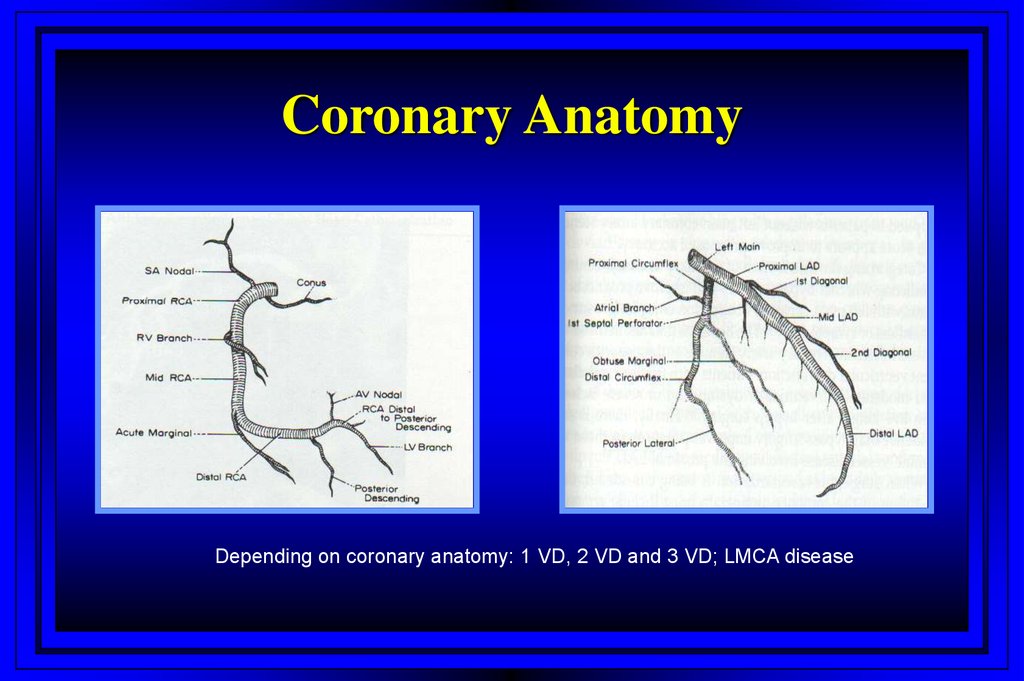
Coronary AnatomyDepending on coronary anatomy: 1 VD, 2 VD and 3 VD; LMCA disease
49.
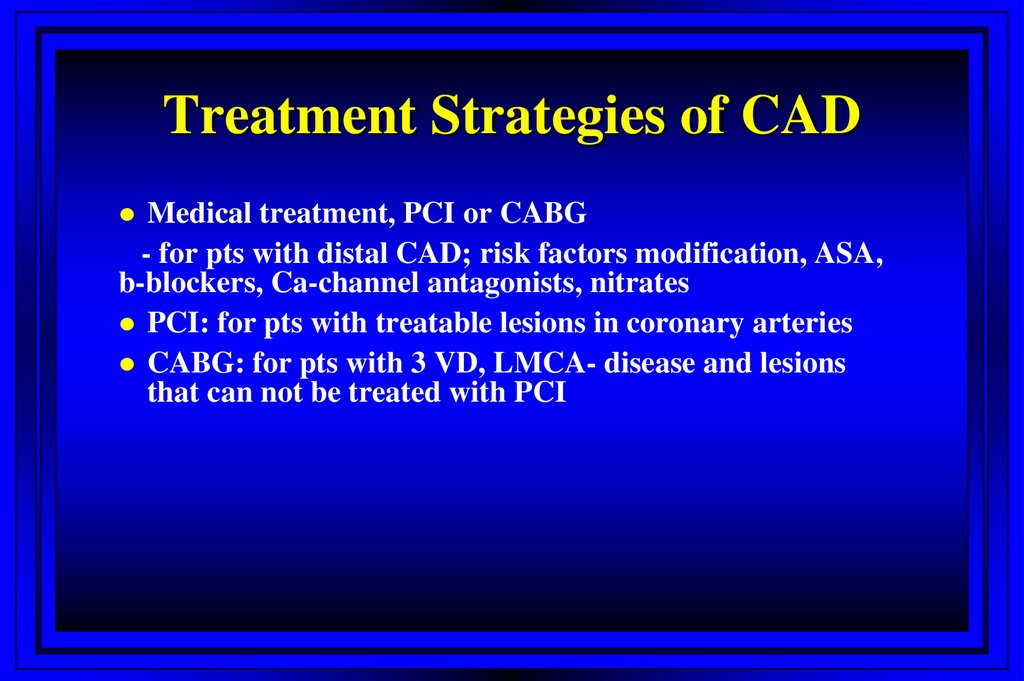
Treatment Strategies of CADMedical treatment, PCI or CABG
- for pts with distal CAD; risk factors modification, ASA,
b-blockers, Ca-channel antagonists, nitrates
PCI: for pts with treatable lesions in coronary arteries
CABG: for pts with 3 VD, LMCA- disease and lesions
that can not be treated with PCI
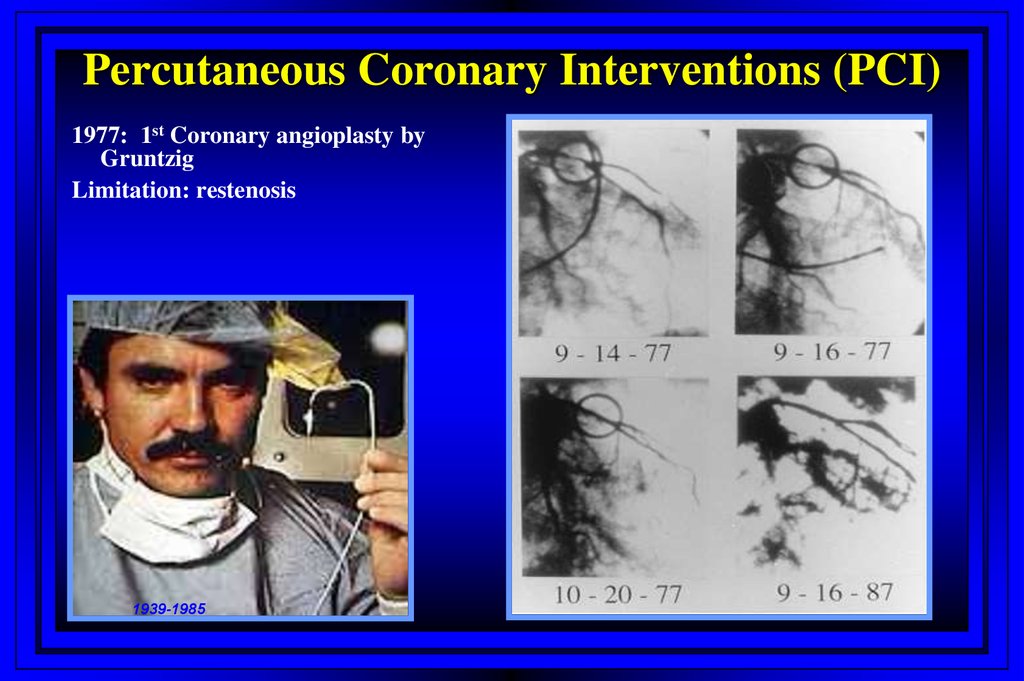
50.
Percutaneous Coronary Interventions (PCI)1977: 1st Coronary angioplasty by
Gruntzig
Limitation: restenosis
1939-1985
51. Treatment Strategies of CAD
PCI Procedural refinements: StentsExpandable metal mesh tubes that buttresses the dilated segment,
limit restenosis.
Drug eluting stents: further reduce cellular proliferation in response
to the injury of dilatation.
52. Percutaneous Coronary Interventions (PCI)
Treatment Strategies of CADStable angina
Unstable angina/non ST-elevation MI
- Risk stratification; high-risk patients: elderly, history of
CAD/MI, ST-T changes and positive cardiac markers
(CK-MB and/or Troponin)
- Early invasive approach including coronary
angiography within 72 hours followed by medical
management (30%), PCI (60%) or CABG (10%)
53. PCI Procedural refinements: Stents
Treatment Strategies of CADStable angina
Unstable angina/non ST-elevation MI
- Risk stratification; high-risk patients: elderly, history of
CAD/MI, ST-T changes and positive cardiac markers
(CK-MB and/or Troponin)
- Early invasive approach including coronary
angiography within 72 hours followed by medical
management (30%), PCI (60%) or CABG (10%)
STEMI
- Primary PCI as early as possible at any time
- Thrombolysis (STK, TPA, TNK)
54.
STEMI: PCI vs. ThrombolysisAdvantages of PCI
Knowledge of CA anatomy
Complete opening of the artery
with low rates of reinfarction
Low risk of bleeding
Low risk of stroke
Disadvantages
Needs time
Absence of approach
Advantages of Thrombolysis
Very quick
May be given in ambulance as
bolus
Disadvantages
Relatively high incidence of
bleeding complications
Stroke up to 2%
Reinfarction
55.
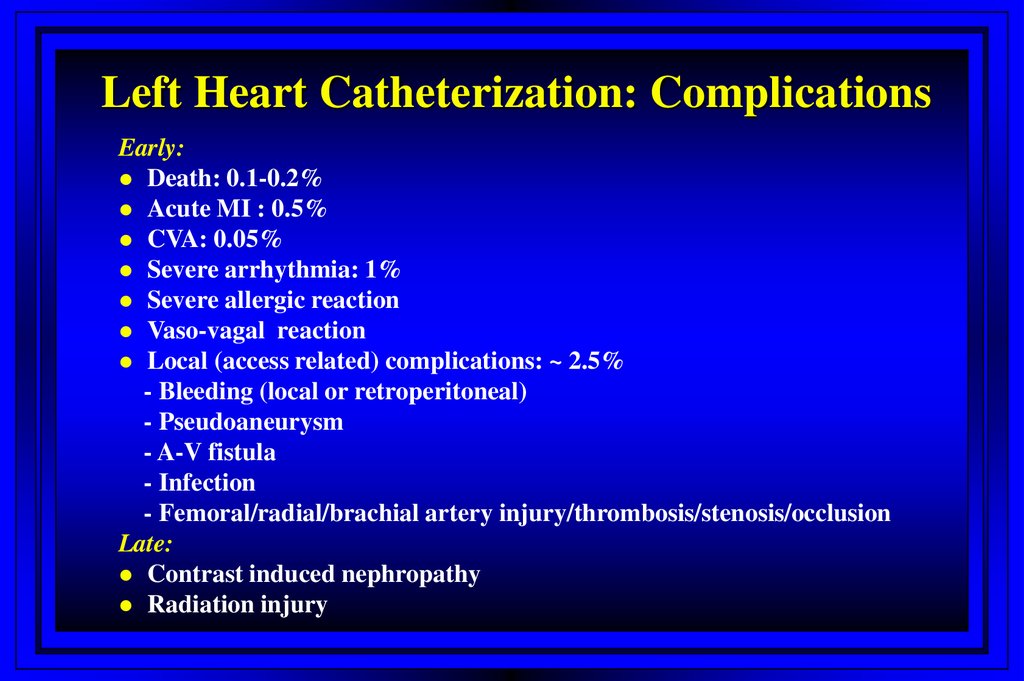
Left Heart Catheterization: ComplicationsEarly:
Death: 0.1-0.2%
Acute MI : 0.5%
CVA: 0.05%
Severe arrhythmia: 1%
Severe allergic reaction
Vaso-vagal reaction
Local (access related) complications: ~ 2.5%
- Bleeding (local or retroperitoneal)
- Pseudoaneurysm
- A-V fistula
- Infection
- Femoral/radial/brachial artery injury/thrombosis/stenosis/occlusion
Late:
Contrast induced nephropathy
Radiation injury
56. STEMI: PCI vs. Thrombolysis
Contrast Induced Nephropathy: PathogenesisHemodynamic changes
Reduction renal blood flow
Direct toxicity to renal
epithelium
Prominent vacuolisation
Deceleration of red blood cell
velocity
Appearance of intracytoplasmic
granular structure
Decrease in oxygen tension
Occasional cell necrosis
Enhanced production of oxygen free
radicals
Apoptosis
DNA fragmentation
Increase in activity of
caspases
Change in concentration of
vasoactive substances
An increased serum level of
endothelin
Decrease in PGE2
Decrease in NO production
Increase in adenosine
57.
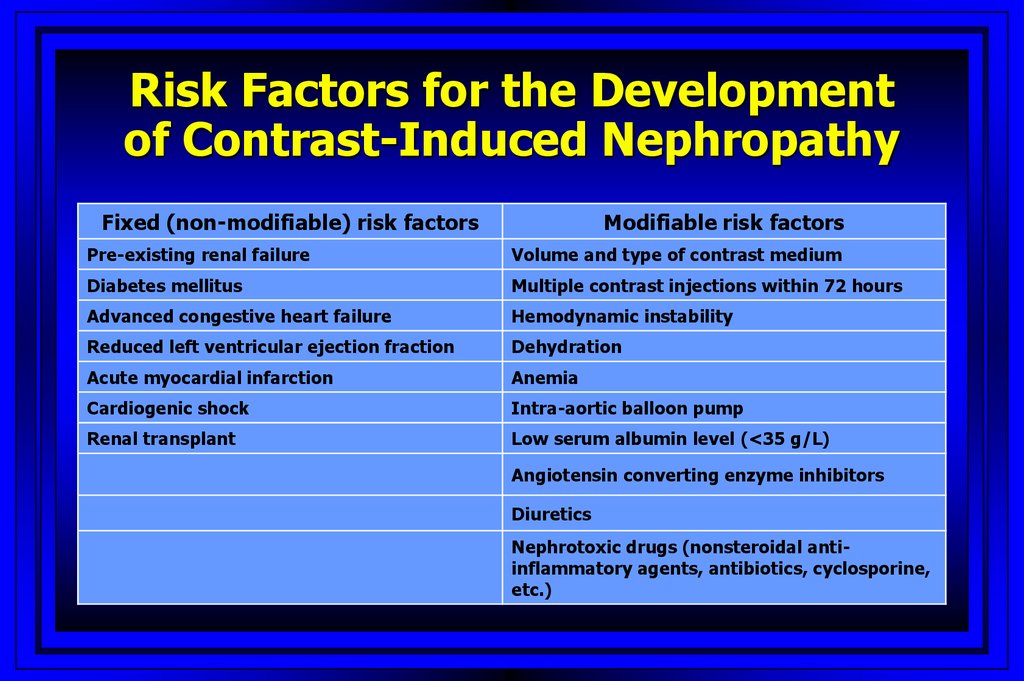
Risk Factors for the Developmentof Contrast-Induced Nephropathy
Fixed (non-modifiable) risk factors
Modifiable risk factors
Pre-existing renal failure
Volume and type of contrast medium
Diabetes mellitus
Multiple contrast injections within 72 hours
Advanced congestive heart failure
Hemodynamic instability
Reduced left ventricular ejection fraction
Dehydration
Acute myocardial infarction
Anemia
Cardiogenic shock
Intra-aortic balloon pump
Renal transplant
Low serum albumin level (<35 g/L)
Angiotensin converting enzyme inhibitors
Diuretics
Nephrotoxic drugs (nonsteroidal antiinflammatory agents, antibiotics, cyclosporine,
etc.)
58.
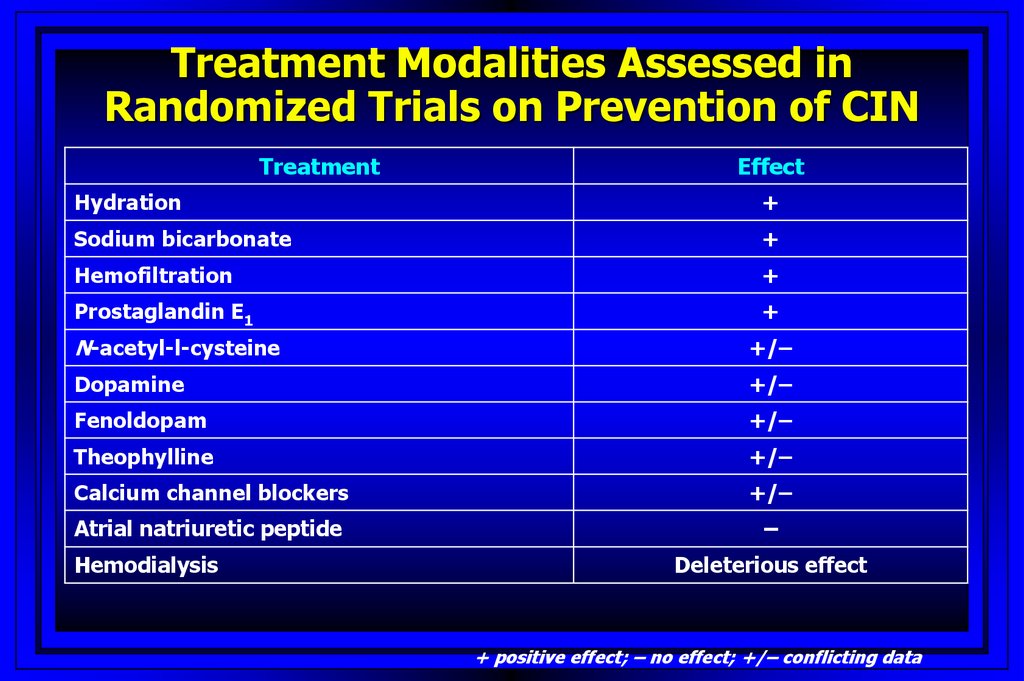
Treatment Modalities Assessed inRandomized Trials on Prevention of CIN
Treatment
Effect
Hydration
+
Sodium bicarbonate
+
Hemofiltration
+
Prostaglandin E1
+
N-acetyl-l-cysteine
+/–
Dopamine
+/–
Fenoldopam
+/–
Theophylline
+/–
Calcium channel blockers
+/–
Atrial natriuretic peptide
–
Hemodialysis
Deleterious effect
+ positive effect; – no effect; +/– conflicting data
59.
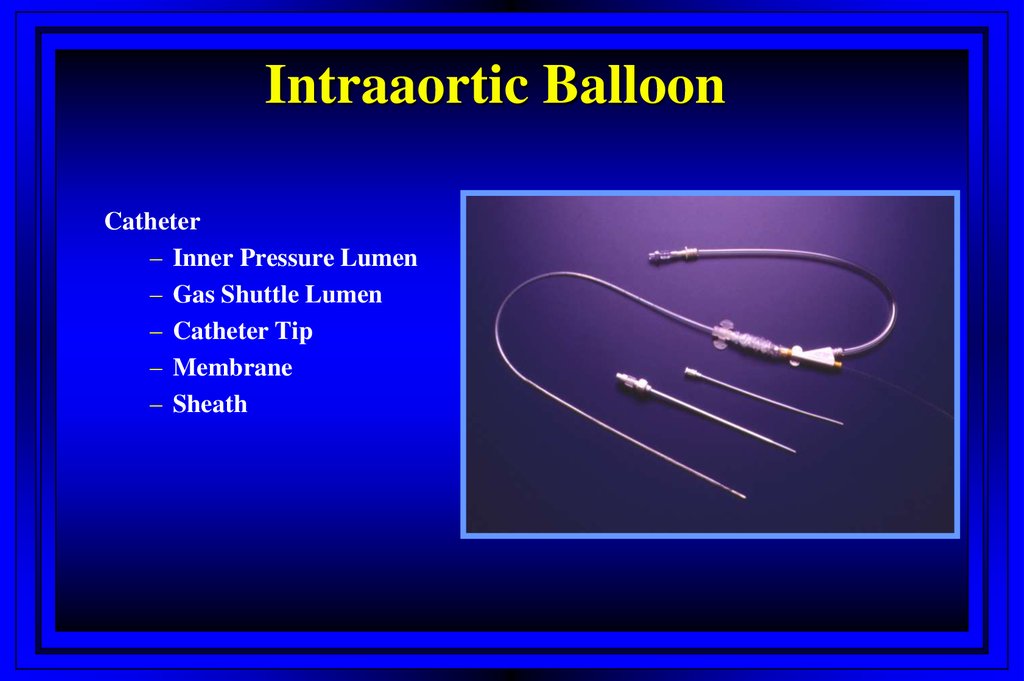
Intraaortic BalloonCatheter
– Inner Pressure Lumen
– Gas Shuttle Lumen
– Catheter Tip
– Membrane
– Sheath
60. Contrast Induced Nephropathy: Pathogenesis
Principles of CounterpulsationSystole: IAB Deflation
• Cardiac Work
• Myocardial O2 Consumption
• Cardiac Output
61. Risk Factors for the Development of Contrast-Induced Nephropathy
Impella Device62. Treatment Modalities Assessed in Randomized Trials on Prevention of CIN
Milestones in ACS ManagementAnti-Thrombin Rx
LMWH
Heparin
Bivalirudin
Fondaparinux
Anti-Platelet Rx
GP IIb/IIIa
blockers
Aspirin
Clopidogrel
Treatment Strategy
Conservative
Early invasive
PRISM-PLUS
PURSUIT
ESSENCE
1994
PCI
BMS~ 5%
Ischemic risk
Bleeding risk
OASIS-5
CURE
1997
ISAR-REACT 2
ACUITY
SYNERGY
TACTICS TIMI-18
1995 1996
ICTUS
REPLACE 2
1998 1999
2000 2001
BMS~85%
2002 2003
2004
Drug-eluting stents
2005
2006
63. Intraaortic Balloon
Dynamics of Antithrombotic Therapy in Patientswith ACS and Patients Undergoing PCI
1970-s
1990-s
2000-s
Anti-Xa
Direct Thrombin
Inhibitors
Thienopyridines
GP IIb/IIIA
GP IIb/IIIa
Thienopyridines
Thienopyridines
Bare-metal stents
DES
High Dose Heparin
High Dose Heparin
Low Dose Heparin,
LMWH
Low Dose Heparin,
LMWH
Aspirin
Aspirin
Aspirin
Aspirin
64.
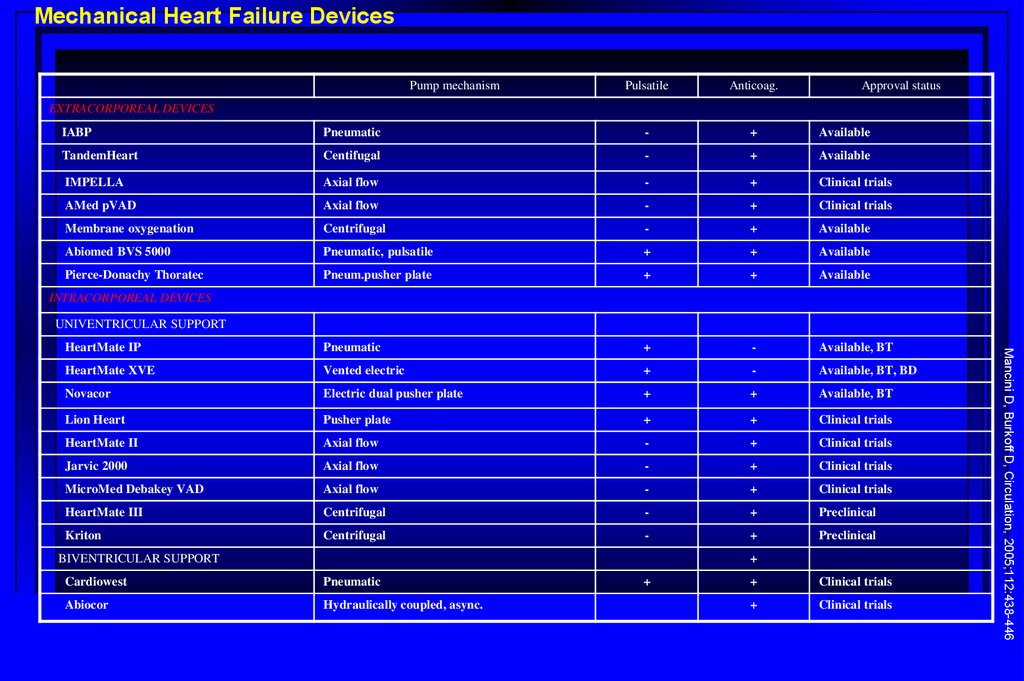
Mechanical Heart Failure DevicesPump mechanism
Pulsatile
Anticoag.
Approval status
EXTRACORPOREAL DEVICES
IABP
Pneumatic
-
+
Available
TandemHeart
Centifugal
-
+
Available
IMPELLA
Axial flow
-
+
Clinical trials
AMed pVAD
Axial flow
-
+
Clinical trials
Membrane oxygenation
Centrifugal
-
+
Available
Abiomed BVS 5000
Pneumatic, pulsatile
+
+
Available
Pierce-Donachy Thoratec
Pneum.pusher plate
+
+
Available
HeartMate IP
Pneumatic
+
-
Available, BT
HeartMate XVE
Vented electric
+
-
Available, BT, BD
Novacor
Electric dual pusher plate
+
+
Available, BT
Lion Heart
Pusher plate
+
+
Clinical trials
HeartMate II
Axial flow
-
+
Clinical trials
Jarvic 2000
Axial flow
-
+
Clinical trials
MicroMed Debakey VAD
Axial flow
-
+
Clinical trials
HeartMate III
Centrifugal
-
+
Preclinical
Kriton
Centrifugal
-
+
Preclinical
INTRACORPOREAL DEVICES
UNIVENTRICULAR SUPPORT
+
Cardiowest
Pneumatic
Abiocor
Hydraulically coupled, async.
+
+
Clinical trials
+
Clinical trials
Mancini D, Burkoff D, Circulation, 2005;112:438-446
BIVENTRICULAR SUPPORT
65. Impella Device
PARTNER Study DesignSymptomatic Severe Aortic Stenosis
Inoperable
Severe Symptomatic AS with
AVA< 0.8 cm2 (EOA index
< 0.5 cm2/m2), and mean
gradient > 40 mmHg
or jet velocity > 4.0 m/s
N = 358
ASSESSMENT:
Transfemoral
Access
1:1 Randomization
TF TAVR
n = 179
VS
Inoperable defined as risk of
death or serious irreversible
morbidity of AVR as assessed
by cardiologist and two
surgeons exceeding 50%.
Standard
Therapy
n = 179
Primary Endpoint: All-Cause Mortality
Over Length of Trial (Superiority)
• Primary endpoint evaluated when all patients reached one year follow-up.
• After primary endpoint analysis reached, patients were allowed to cross-over to TAVR.
66.
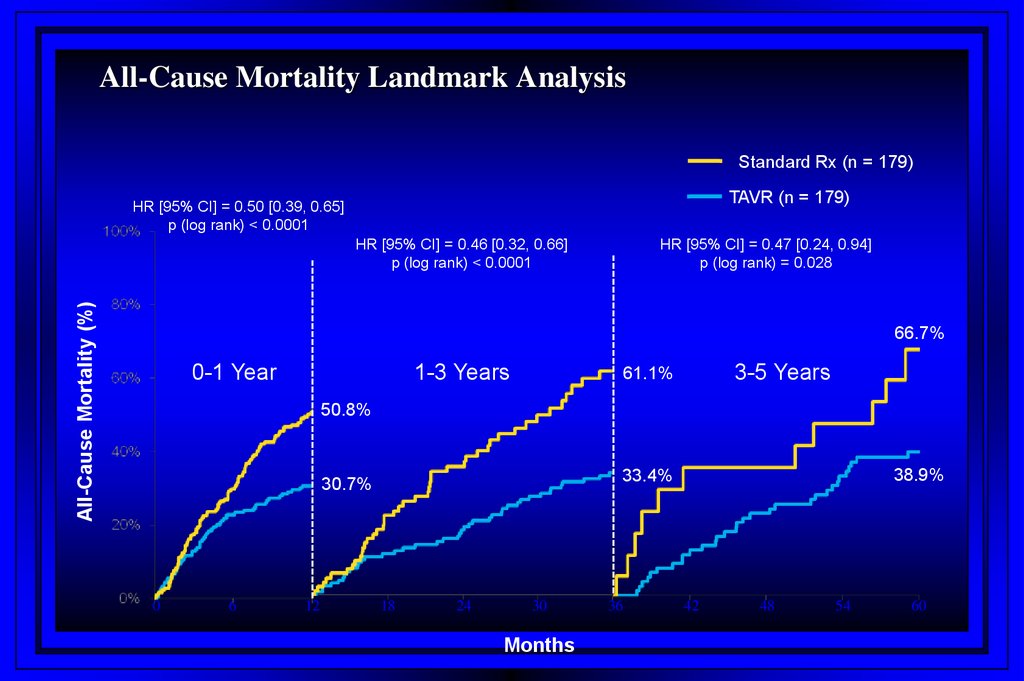
All-Cause Mortality Landmark AnalysisStandard Rx (n = 179)
TAVR (n = 179)
HR [95% CI] = 0.50 [0.39, 0.65]
p (log rank) < 0.0001
All-Cause Mortality (%)
HR [95% CI] = 0.46 [0.32, 0.66]
p (log rank) < 0.0001
HR [95% CI] = 0.47 [0.24, 0.94]
p (log rank) = 0.028
66.7%
0-1 Year
1-3 Years
3-5 Years
61.1%
50.8%
0
6
12
38.9%
33.4%
30.7%
18
24
30
Months
36
42
48
54
60
67.
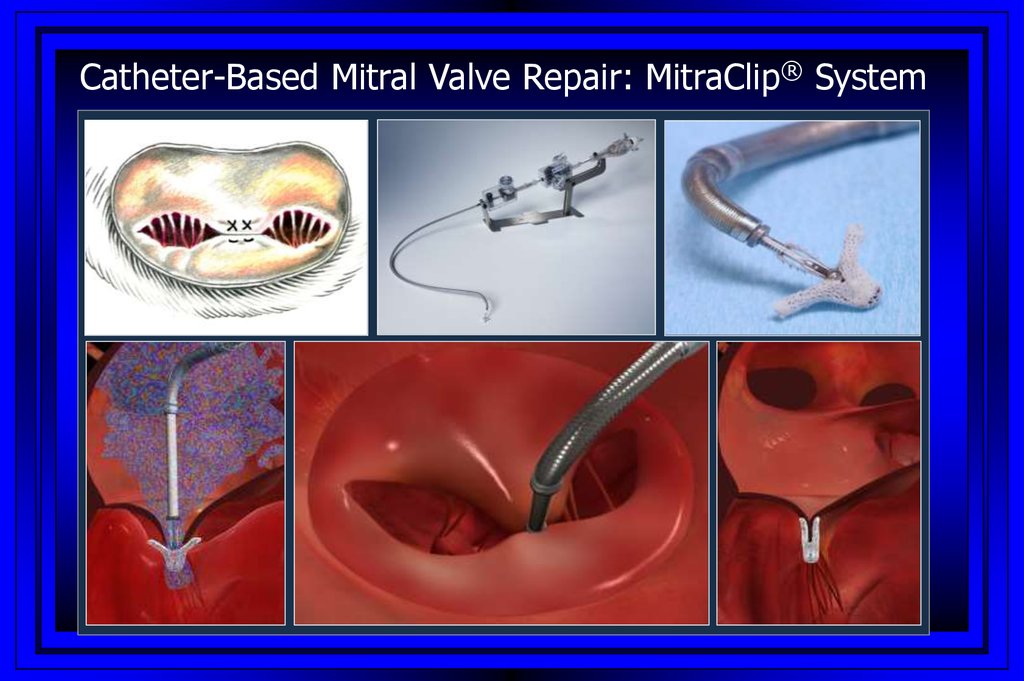
Catheter-Based Mitral Valve Repair: MitraClip® System68.
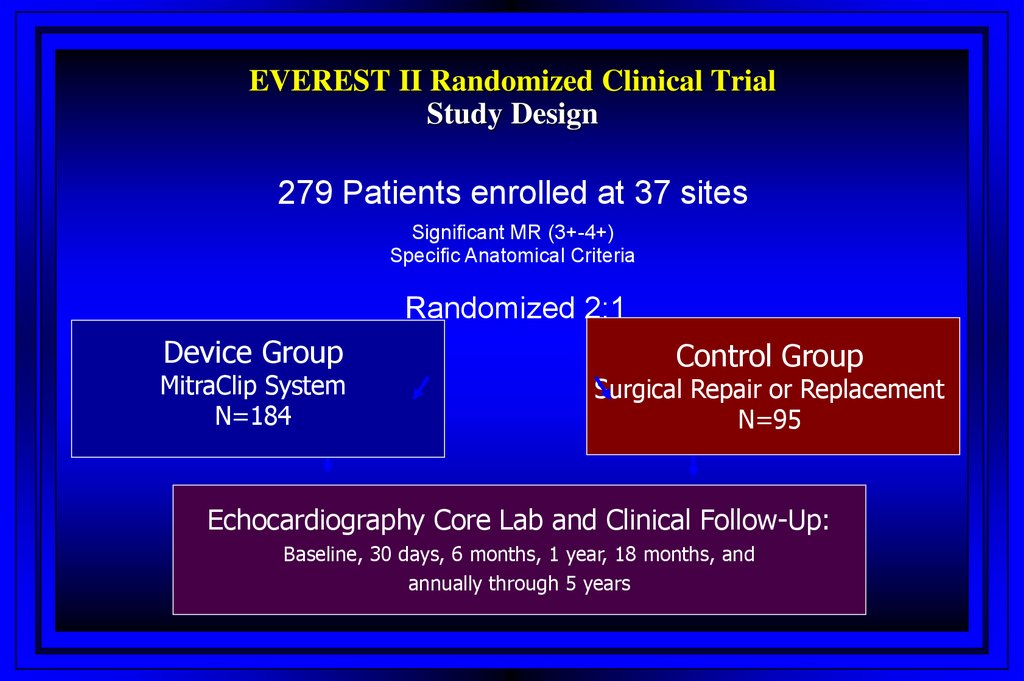
EVEREST II Randomized Clinical TrialStudy Design
279 Patients enrolled at 37 sites
Significant MR (3+-4+)
Specific Anatomical Criteria
Randomized 2:1
Device Group
MitraClip System
N=184
Control Group
Surgical Repair or Replacement
N=95
Echocardiography Core Lab and Clinical Follow-Up:
Baseline, 30 days, 6 months, 1 year, 18 months, and
annually through 5 years
69.
EVEREST II RCT: SummarySafety & effectiveness endpoints met
– Safety: MAE rate at 30 days
• MitraClip device patients: 9.6%
• MV surgery patients: 57%
– Effectiveness: Clinical Success Rate at 12 months
• MitraClip device patients: 72%
• MV Surgery patients: 88%
Clinical benefit demonstrated for MitraClip System and MV surgery
patients through 12 months
• Improved LV function
• Improved NYHA Functional Class
• Improved Quality of Life
Surgery remains an option after the MitraClip procedure