


 Промышленность
Похожие презентации:


")


Refrigerant systems and their energy performance
1.
Refrigerant systems and theirenergy performance
1.
2.
3.
4.
5.
6.
7.
What is efficiency
COP, EER, ESEER, IPLV, EUROVENT
Some benchmark of good COP
Simple method of measuring COP
Measuring and monitoring entire systems
What influences the efficiency of systems
Example best practice
Page
Page
Page
Page
Page
Page
Page
2
3 to
10 to
12 to
17 to
20 to
26 to
8
11
16
19
26
30
1
2.
What is efficiency• Efficiency is the relation between output and input
• In the refrigeration industry the output is the cooling capacity
measured in [kW] and the input is the power also measured in [kW]
which is need, to reach the desired cooling capacity
• In HVAC an refrigeration industry output power is always thermal
• Input power is either electrical or mechanical, except absorption and
adsorption chiller which are not scope of this presentation
• In HVAC and refrigeration industry
Efficiency = cooling capacity [kW] / power input [kW]
2
3.
Definition of efficiency COP• In the HVAC and refrigeration industry existing different abbreviations
terms of efficiency figures
• Most common and worldwide widely used is the COP
• COP is an abbreviation and stands for Coefficient Of Performance
COP = cooling capacity [kW] / power input [kW]
and as valid for full load (100% cooling capacity) only
• In the USA COP is sometimes given as
Efficiency = kW/ton = power input [kW] / cooling capacity [tons]
used in content with big chillers and refrigeration system or even as
used small systems (residential units)
COP = cooling capacity [BTU/h] / (power input [kW] * 3413) or
in content with heat pumps
COP = condensing capacity / [BTU/h] / (power input [kW] * 3414)
3
4.
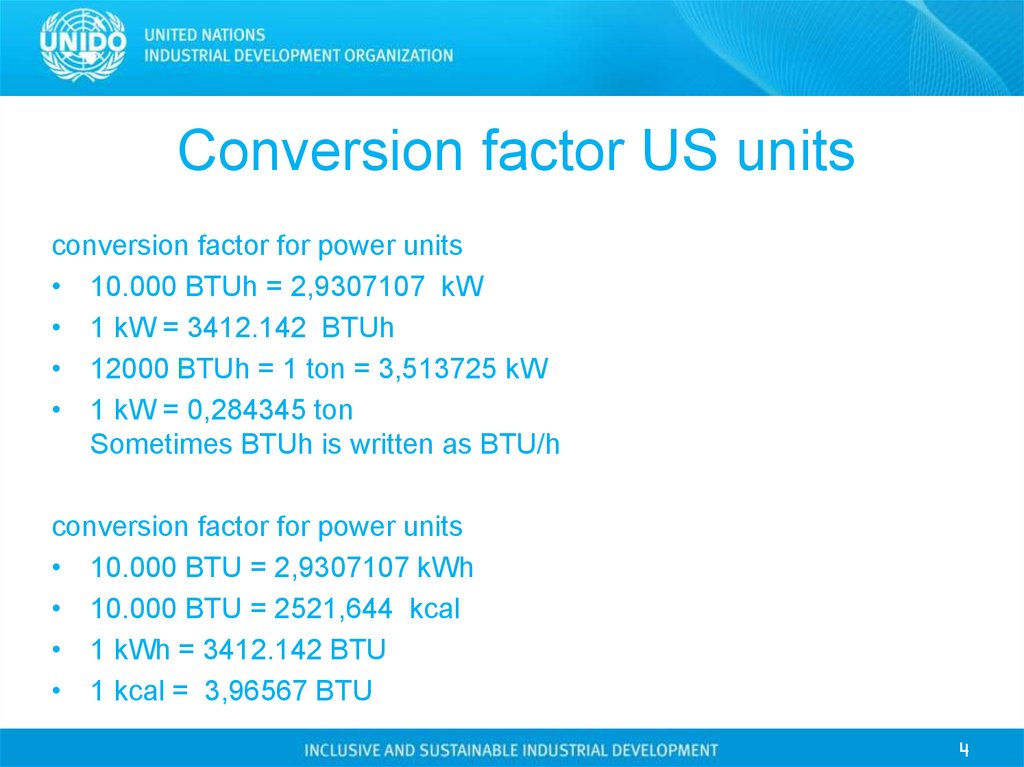
Conversion factor US unitsconversion factor for power units
• 10.000 BTUh = 2,9307107 kW
• 1 kW = 3412.142 BTUh
• 12000 BTUh = 1 ton = 3,513725 kW
• 1 kW = 0,284345 ton
Sometimes BTUh is written as BTU/h
conversion factor for power units
• 10.000 BTU = 2,9307107 kWh
• 10.000 BTU = 2521,644 kcal
• 1 kWh = 3412.142 BTU
• 1 kcal = 3,96567 BTU
4
5.
Definition of efficiency - EER• In Europe the same performance figure is called EER
• EER is an abbreviation and stands for Energy Efficient Ratio
• EER = cooling capacity [kW] / power input [kW]
and as valid for full load (100% cooling capacity) only
• The EER is in Europe always used for any kind of cooling application
EER = cooling capacity [kW] / power input [kW]
• In Europe the COP is used to specify the performance of heat pumps
COP = condensing capacity [kW] / power input [kW] this is equal to
COP = (cooling capacity + power input [kW]) / power input [kW]
5
6.
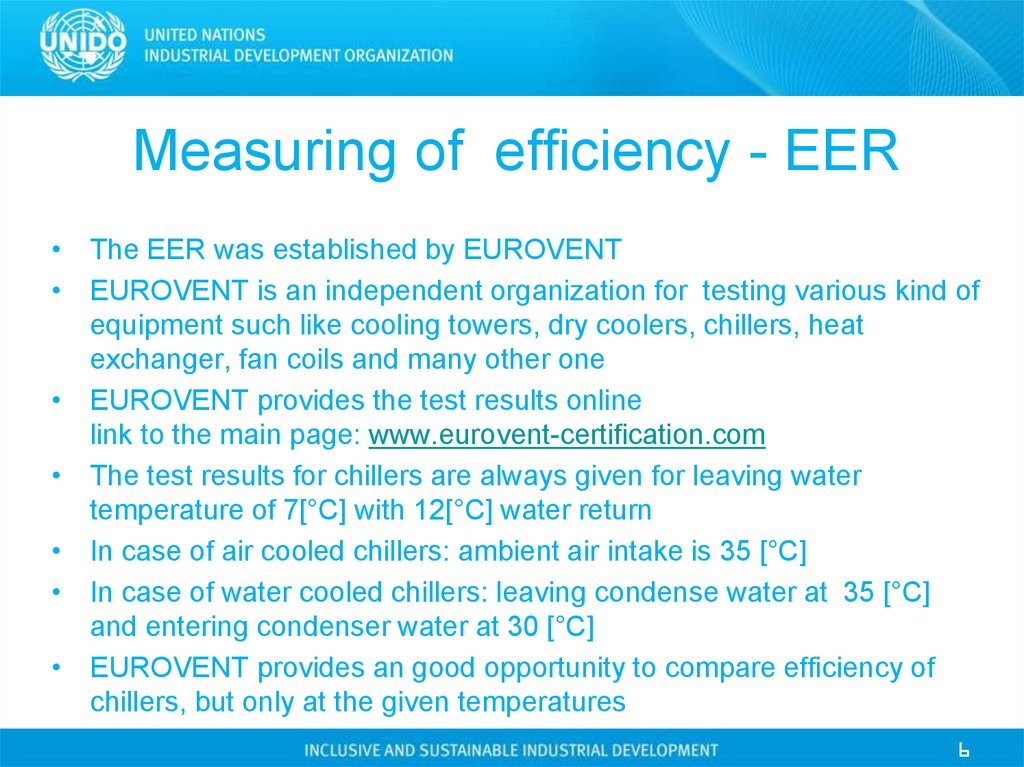
Measuring of efficiency - EER• The EER was established by EUROVENT
• EUROVENT is an independent organization for testing various kind of
equipment such like cooling towers, dry coolers, chillers, heat
exchanger, fan coils and many other one
• EUROVENT provides the test results online
link to the main page: www.eurovent-certification.com
• The test results for chillers are always given for leaving water
temperature of 7[°C] with 12[°C] water return
• In case of air cooled chillers: ambient air intake is 35 [°C]
• In case of water cooled chillers: leaving condense water at 35 [°C]
and entering condenser water at 30 [°C]
• EUROVENT provides an good opportunity to compare efficiency of
chillers, but only at the given temperatures
6
7.
Part Load Efficiency ESEER• EER is only valid for part load
• Chillers usually operate at full load only during a limited period of time
during a year working with EER is sometimes not useful to work with
• Therefore the part load performance is much closer to reality and
EUROVENT decided to certify, together with full load efficiency, an
average annual part load efficiency of chillers
• A study partly funded by the European Commission through SAVE
Program was performed and an index called ESEER – European
Seasonal Energy Efficiency Ratio- has been defined
• ESEER is similar to IPLV (Integrated Part Load Value) - used by ARI
in USA, takes into account several parameters in order to establish an
average use of chillers throughout Europe: weather data, building load
characteristics, operational hours etc.
7
8.
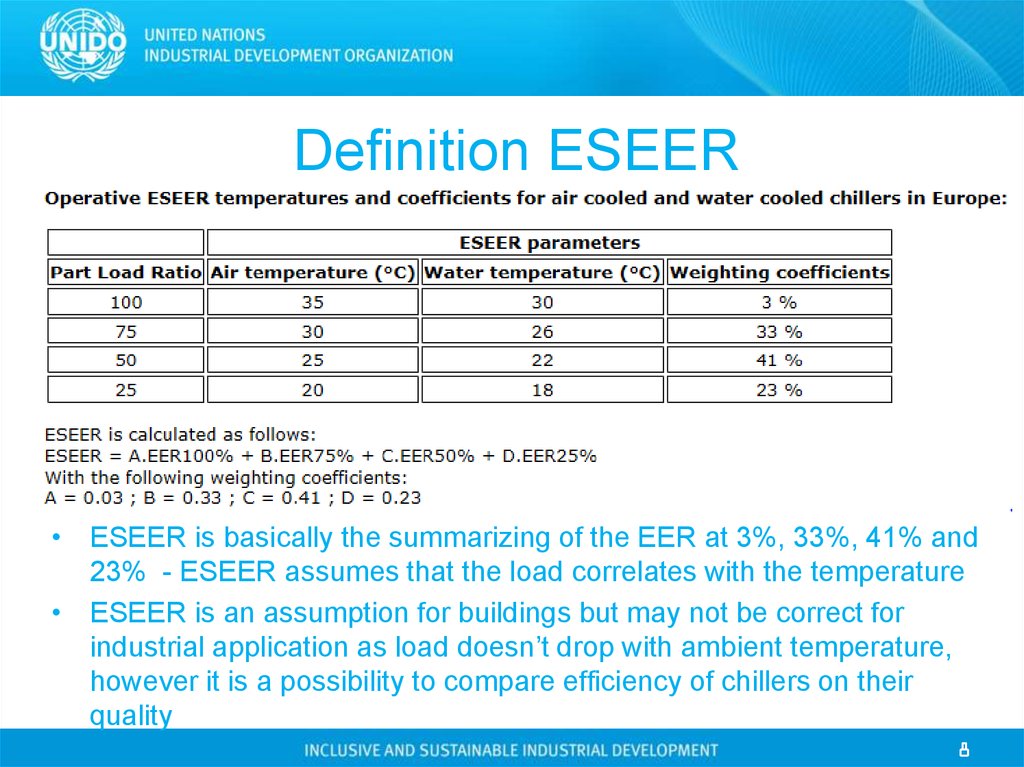
Definition ESEER• ESEER is basically the summarizing of the EER at 3%, 33%, 41% and
23% - ESEER assumes that the load correlates with the temperature
• ESEER is an assumption for buildings but may not be correct for
industrial application as load doesn’t drop with ambient temperature,
however it is a possibility to compare efficiency of chillers on their
quality
8
9.
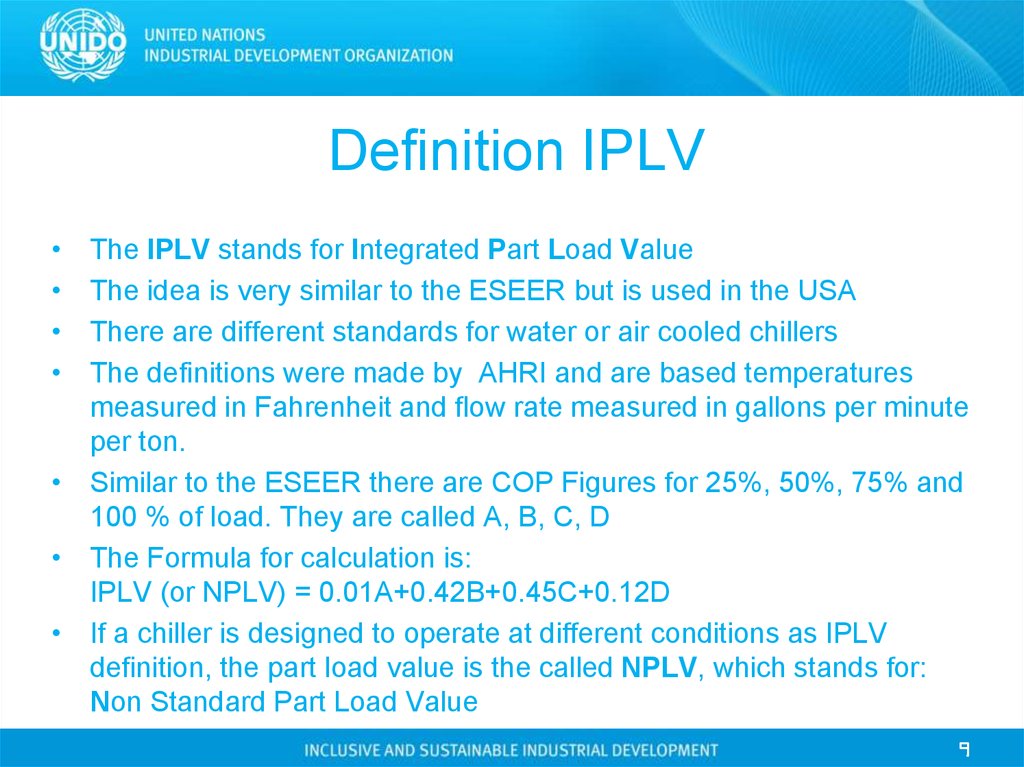
Definition IPLVThe IPLV stands for Integrated Part Load Value
The idea is very similar to the ESEER but is used in the USA
There are different standards for water or air cooled chillers
The definitions were made by AHRI and are based temperatures
measured in Fahrenheit and flow rate measured in gallons per minute
per ton.
• Similar to the ESEER there are COP Figures for 25%, 50%, 75% and
100 % of load. They are called A, B, C, D
• The Formula for calculation is:
IPLV (or NPLV) = 0.01A+0.42B+0.45C+0.12D
• If a chiller is designed to operate at different conditions as IPLV
definition, the part load value is the called NPLV, which stands for:
Non Standard Part Load Value
9
10.
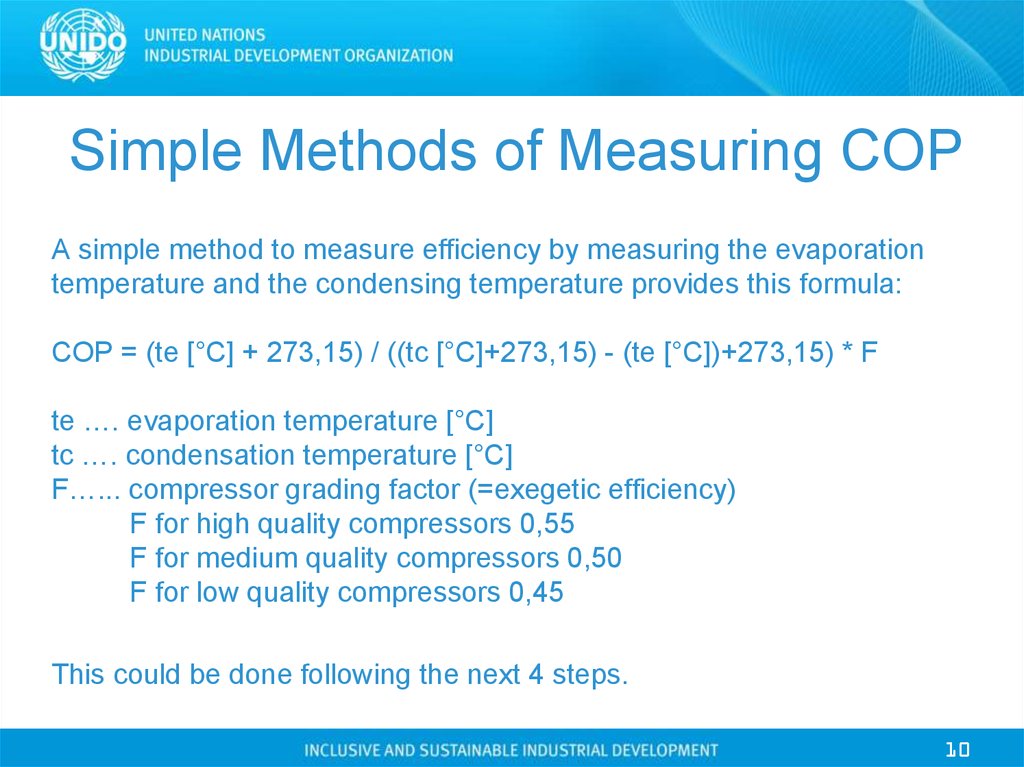
Simple Methods of Measuring COPA simple method to measure efficiency by measuring the evaporation
temperature and the condensing temperature provides this formula:
COP = (te [°C] + 273,15) / ((tc [°C]+273,15) - (te [°C])+273,15) * F
te …. evaporation temperature [°C]
tc …. condensation temperature [°C]
F…... compressor grading factor (=exegetic efficiency)
F for high quality compressors 0,55
F for medium quality compressors 0,50
F for low quality compressors 0,45
This could be done following the next 4 steps.
10
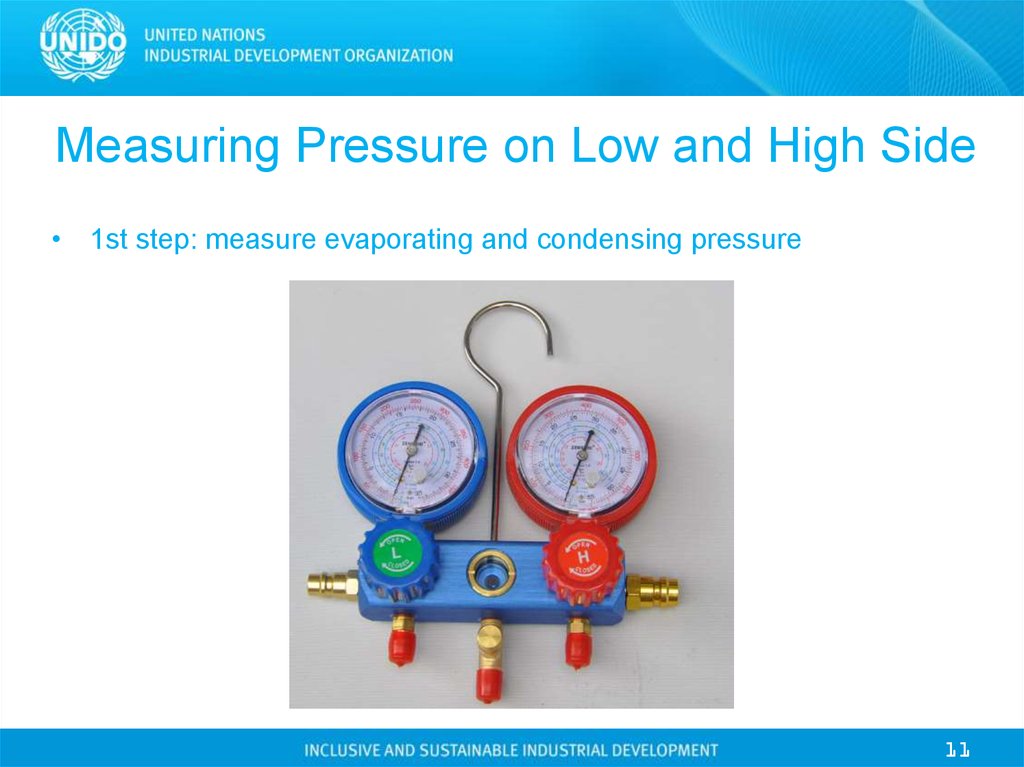
11.
Measuring Pressure on Low and High Side• 1st step: measure evaporating and condensing pressure
11
12.
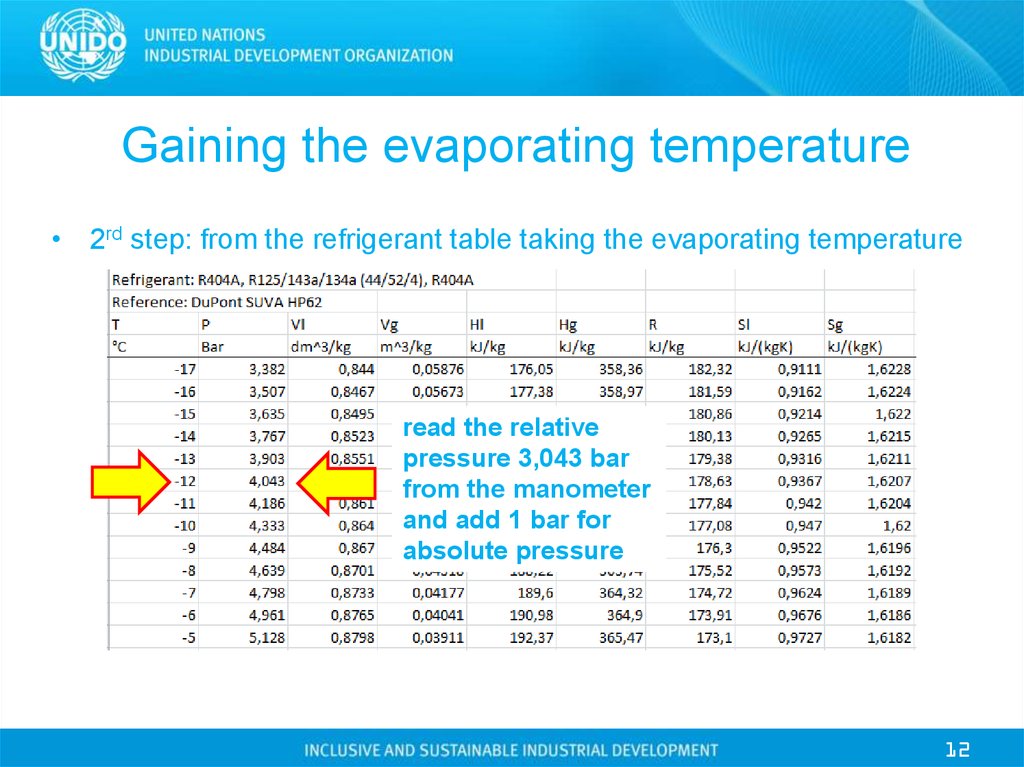
Gaining the evaporating temperature• 2rd step: from the refrigerant table taking the evaporating temperature
read the relative
pressure 3,043 bar
from the manometer
and add 1 bar for
absolute pressure
12
13.
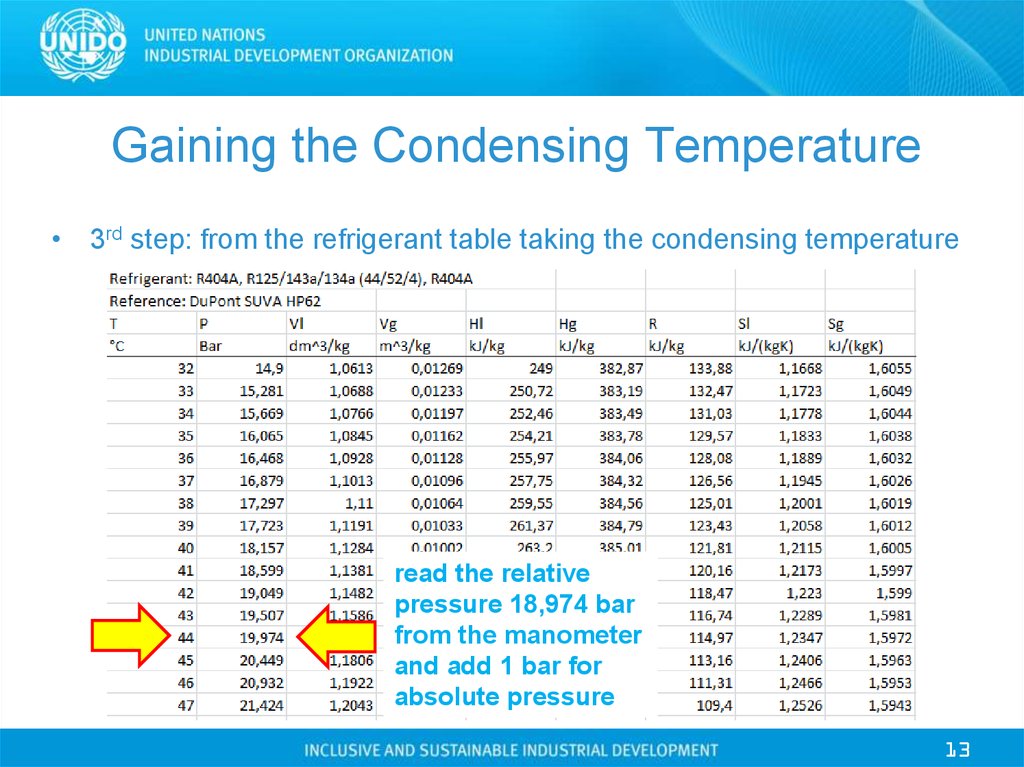
Gaining the Condensing Temperature• 3rd step: from the refrigerant table taking the condensing temperature
read the relative
pressure 18,974 bar
from the manometer
and add 1 bar for
absolute pressure
13
14.
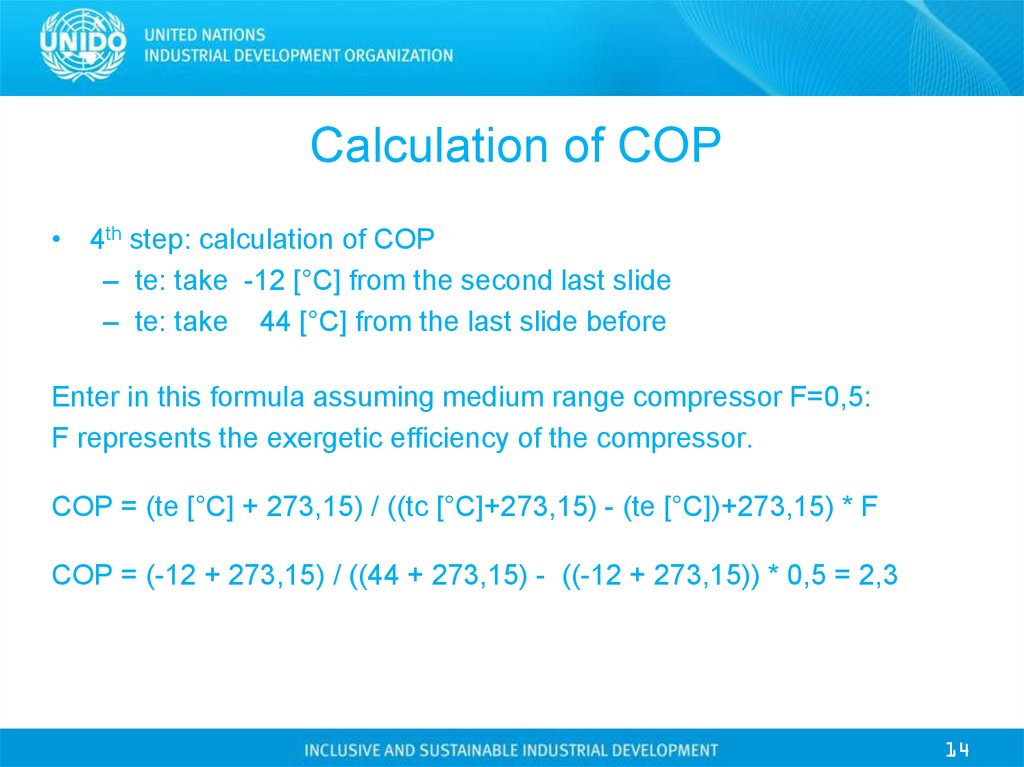
Calculation of COP• 4th step: calculation of COP
– te: take -12 [°C] from the second last slide
– te: take 44 [°C] from the last slide before
Enter in this formula assuming medium range compressor F=0,5:
F represents the exergetic efficiency of the compressor.
COP = (te [°C] + 273,15) / ((tc [°C]+273,15) - (te [°C])+273,15) * F
COP = (-12 + 273,15) / ((44 + 273,15) - ((-12 + 273,15)) * 0,5 = 2,3
14
15.
Measuring and monitoring entire systems• On complex systems it make sense to measure devices continuously
• For example a chiller plant with three chiller and three cooling towers
• The overall energy consumption comes from:
1. the chiller (three piece)
2. the cooling tower fans (three piece)
3. the condenser pumps (three piece)
4. the evaporator pumps (three piece)
• To know how the energy flows it is necessary to install measurement
instruments
• All the measurement instruments are linked together in a network
• In most cases they are communicating using a bus system
• Very common is the M-Bus
15
16.
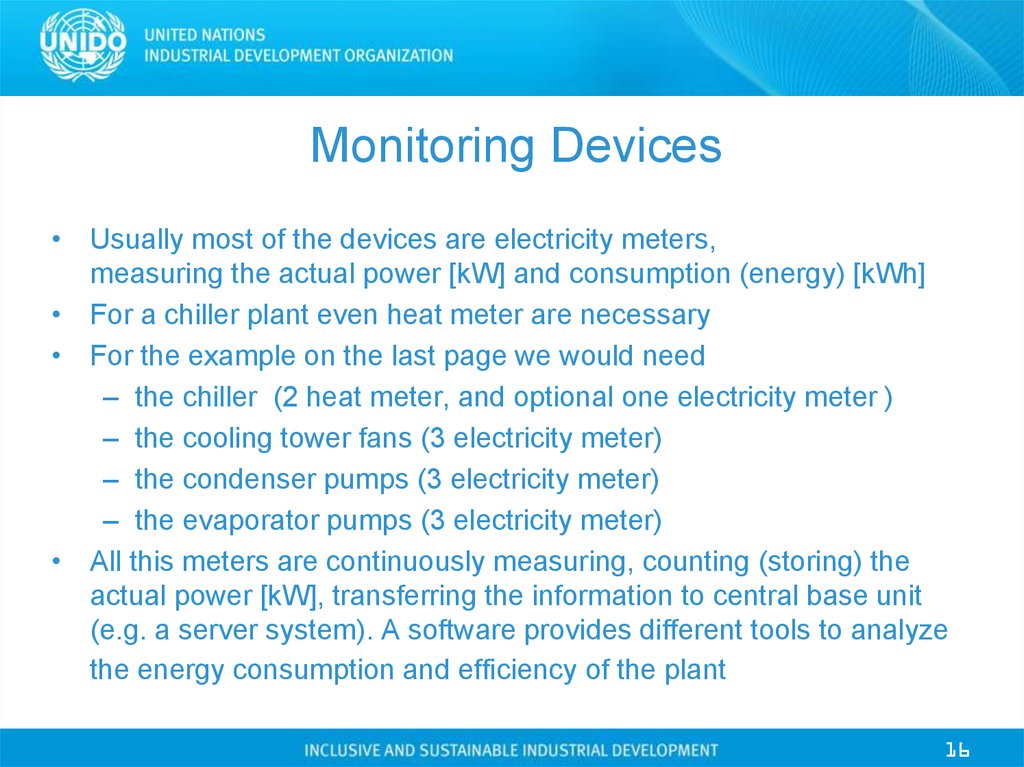
Monitoring Devices• Usually most of the devices are electricity meters,
measuring the actual power [kW] and consumption (energy) [kWh]
• For a chiller plant even heat meter are necessary
• For the example on the last page we would need
– the chiller (2 heat meter, and optional one electricity meter )
– the cooling tower fans (3 electricity meter)
– the condenser pumps (3 electricity meter)
– the evaporator pumps (3 electricity meter)
• All this meters are continuously measuring, counting (storing) the
actual power [kW], transferring the information to central base unit
(e.g. a server system). A software provides different tools to analyze
the energy consumption and efficiency of the plant
16
17.
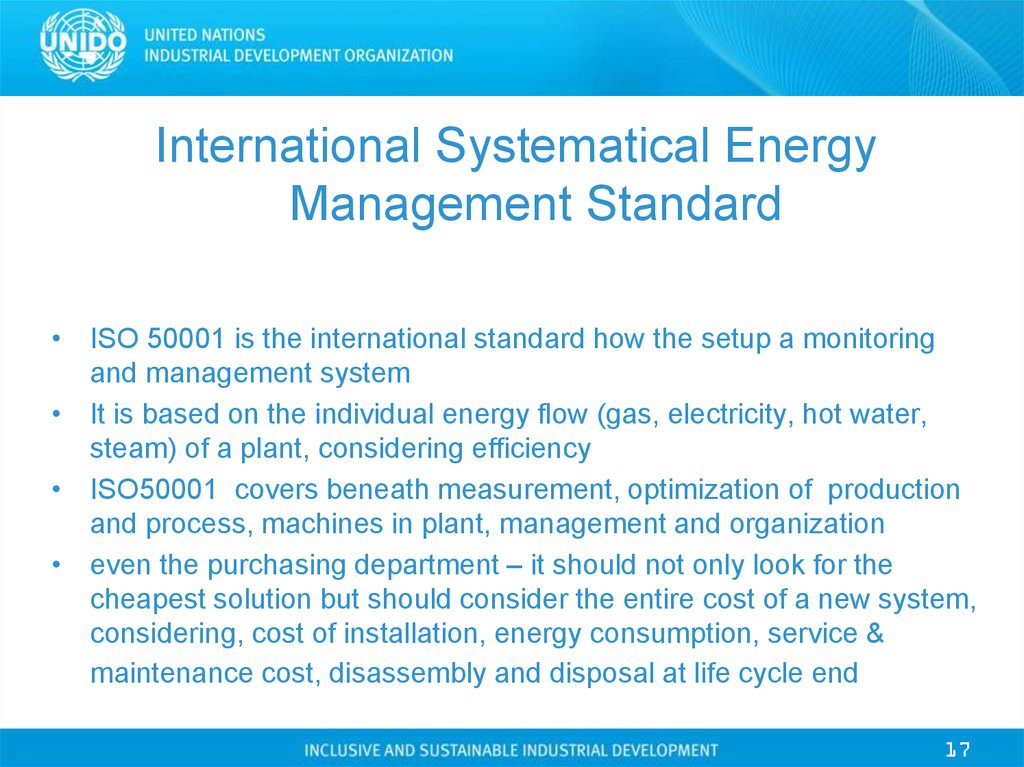
International Systematical EnergyManagement Standard
• ISO 50001 is the international standard how the setup a monitoring
and management system
• It is based on the individual energy flow (gas, electricity, hot water,
steam) of a plant, considering efficiency
• ISO50001 covers beneath measurement, optimization of production
and process, machines in plant, management and organization
• even the purchasing department – it should not only look for the
cheapest solution but should consider the entire cost of a new system,
considering, cost of installation, energy consumption, service &
maintenance cost, disassembly and disposal at life cycle end
17
18.
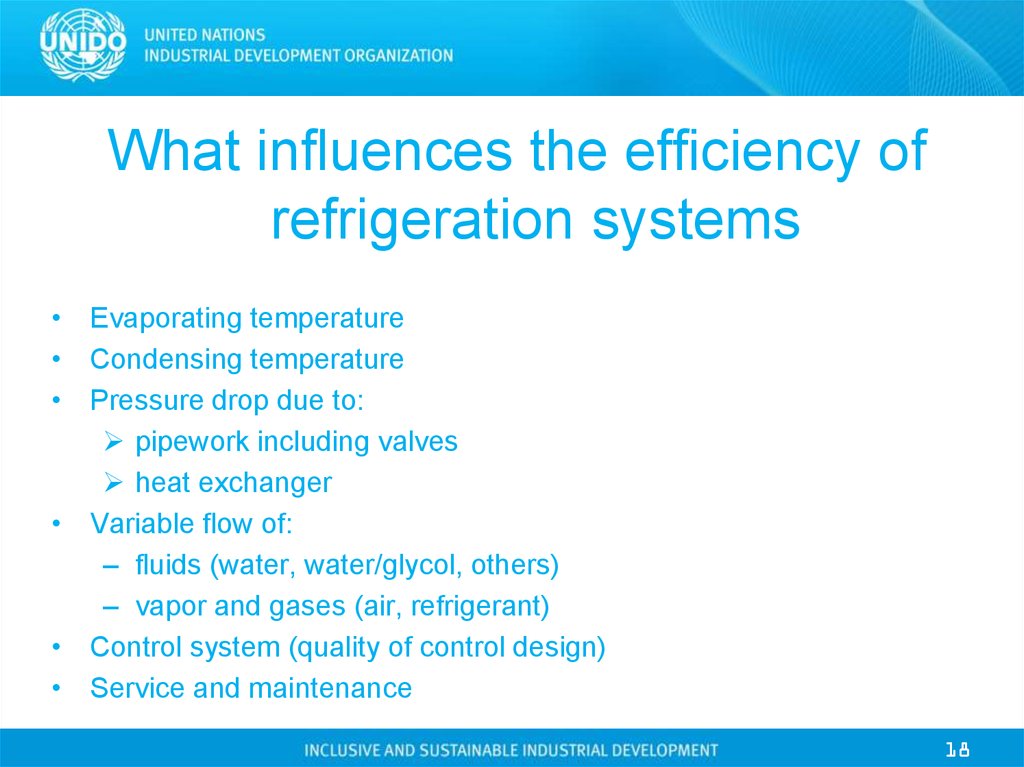
What influences the efficiency ofrefrigeration systems
• Evaporating temperature
• Condensing temperature
• Pressure drop due to:
pipework including valves
heat exchanger
• Variable flow of:
– fluids (water, water/glycol, others)
– vapor and gases (air, refrigerant)
• Control system (quality of control design)
• Service and maintenance
18
19.
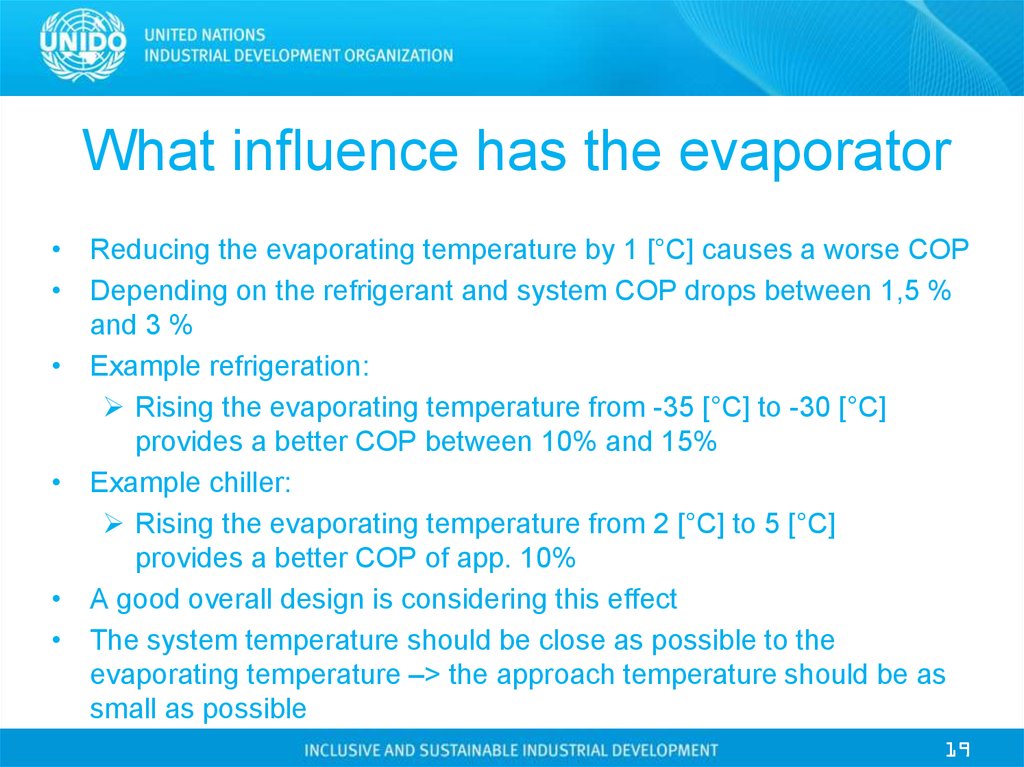
What influence has the evaporator• Reducing the evaporating temperature by 1 [°C] causes a worse COP
• Depending on the refrigerant and system COP drops between 1,5 %
and 3 %
• Example refrigeration:
Rising the evaporating temperature from -35 [°C] to -30 [°C]
provides a better COP between 10% and 15%
• Example chiller:
Rising the evaporating temperature from 2 [°C] to 5 [°C]
provides a better COP of app. 10%
• A good overall design is considering this effect
• The system temperature should be close as possible to the
evaporating temperature –> the approach temperature should be as
small as possible
19
20.
What influence has the condenser• Reducing the condensing temperature by 1 [°C] offers a better COP
• Depending on the refrigerant COP rises between 2 % and 3 %
• Example Refrigeration:
Lowering the condensing temperature from 50 [°C] to 45 [°C]
provides a better COP between 12% and 15%
• Example chiller:
Lowering the evaporating temperature from 40 [°C] to 35 [°C]
provides a better COP of app. 15%
• A good overall design is considering this effect
• The media outlet temperature of the condenser should be close as
possible to the coolant media temperature (air, water, water/glycol –>
the approach temperature should be as small as possible
20
21.
What influence has pressure drop• Each pipe, valve, heat exchanger have pressure drop
• Pressure drop is a loss, which has to be compensated
• Machines such like compressors, pumps and fans have to do this
compensation, and needing more energy (power) to do so
• There is a physical law, saying, that pressure drop is a square function
on volume flow. And the hydraulic power is pressure drop * flow
• Therefore pressure drop has a great impact on the energy
consumption of pumps, fans and even compressors
• As a refrigeration system is build of many components such like pipes,
valves or even pumps and fans, pressure drop has to be carefully
considered during the first design phase
• Too small diameter of pipes or to high pressor drops of heat
exchanger will immediately lead to inefficient systems
21
22.
What influence has variable flowAuxiliary devices such like pumps or fans are often on / off controlled
Today are electronic controllers available providing variable speed
Examples are frequency converters (FC) or phase cutting controllers
Using variable speed on pumps and fans, variable flow is possible
almost anywhere
One exception is the chilled water pump (needs always constant flow)
There is a physical law, saying, that energy consumption drops in a
cube function on any flow machine (examples are fans, pumps,
centrifugal compressors) when flow will be reduced
Example: Cooling Tower has 2 fans with 10 [kW] each at 100% load
At part load 50% with on / off control 1 fan with 10 [kW] is active
At part load 50% with FC control 2 fans are active 10*(1/2)³ =1,25 [kW]
22
23.
What influence has maintenance• And even service and maintenance has a huge influence of the energy
consumption of refrigeration systems, here are some examples:
• Dirty heat exchanger will dramatically lower the COP, a dirty
condenser will lower the COP between 5% and 15%
• The same is true for dirty or frozen evaporator
• Clogged filter will increase the pressure drop of the system an will lead
to much higher consumption
• And even the compressor needs service to make it smooth running
with a minimum of friction loss
• Or belt driven devices, e.g. on cooling tower fans. If the belt is not
stretched enough, the requires air flow is not given any more. As a
result the condensing temperature is rising, and this leads to a worse
COP
23
24.
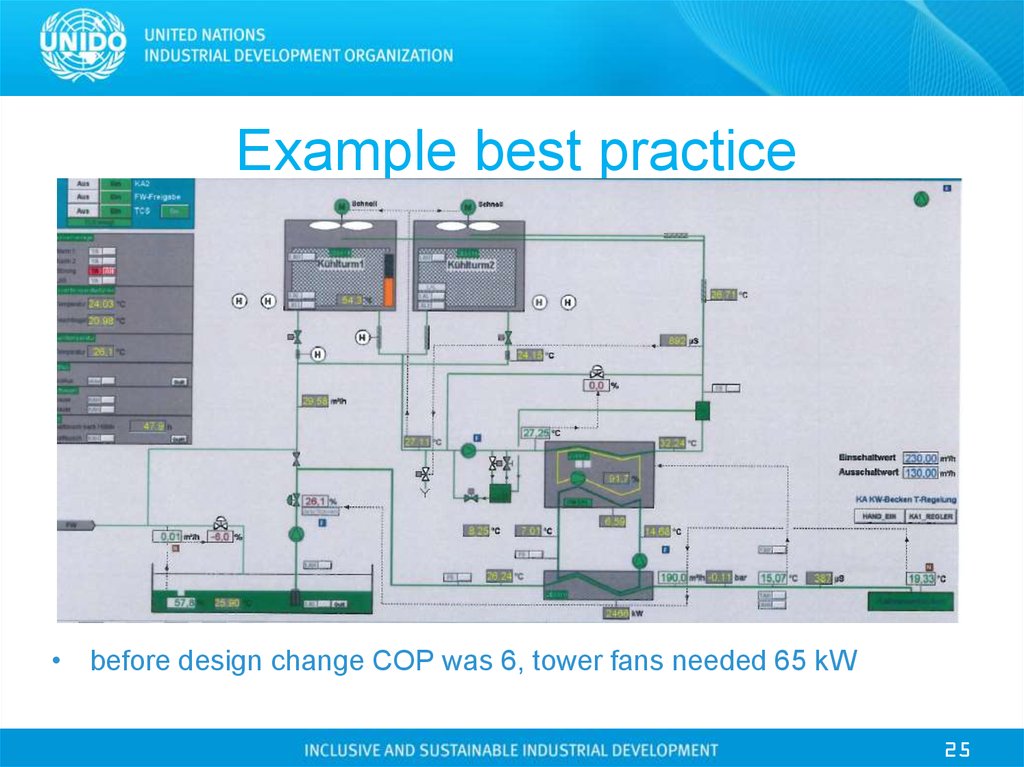
Example best practiceAn industrial plant has a 3 year old centrifugal chiller installed
The capacity of this chiller was prior modification 2500 [kW]
Chilled leaving water temperature was 7 [°C]
Condenser leaving water temperature was 32 [°C]
The COP was around 5,8
The customer suffered during hot summer temperature because the
desired capacity could not achieved
• Together with the customer we did a redesign of the hydraulic system
• It turns out that it is possible to run the system with far higher
temperatures du to design change – chilled water leaving is now
12[°C]
• An additional cooling tower with special control was added as well
24
25.
Example best practice• before design change COP was 6, tower fans needed 65 kW
25
26.
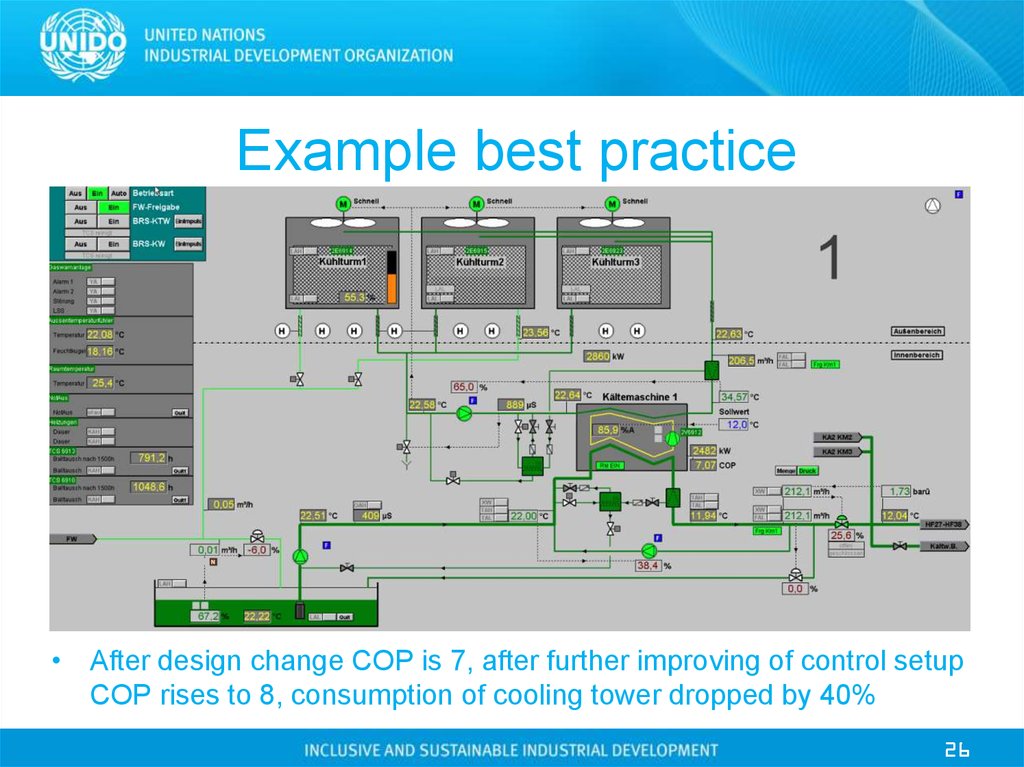
Example best practice• After design change COP is 7, after further improving of control setup
COP rises to 8, consumption of cooling tower dropped by 40%
26
27.
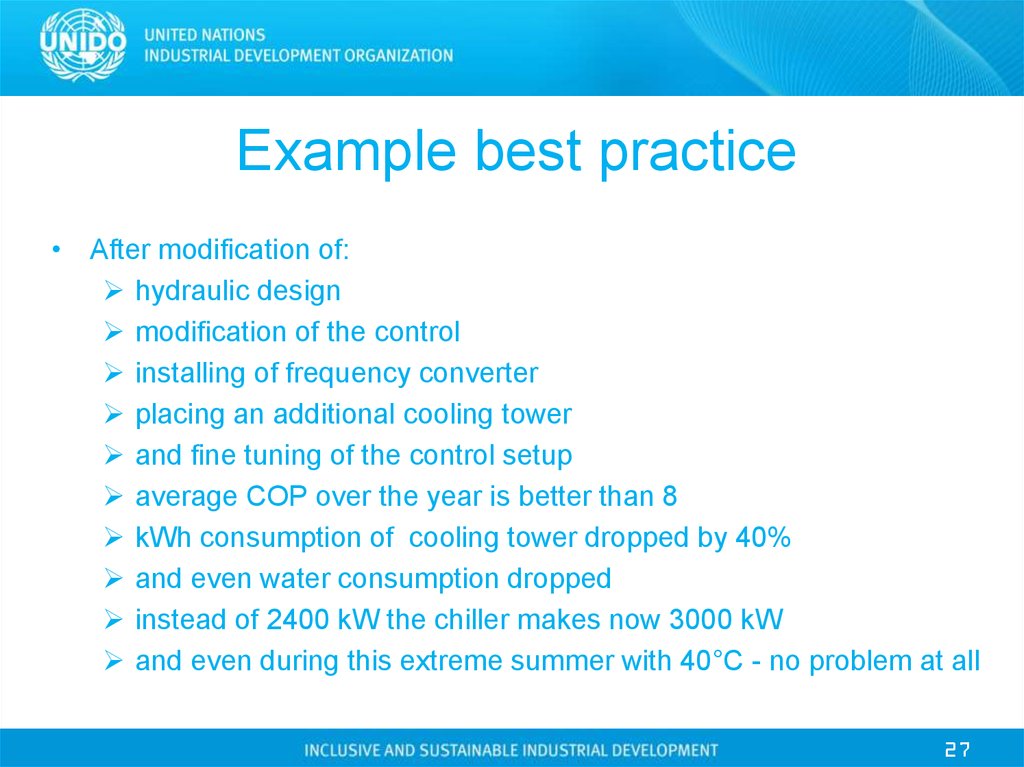
Example best practice• After modification of:
hydraulic design
modification of the control
installing of frequency converter
placing an additional cooling tower
and fine tuning of the control setup
average COP over the year is better than 8
kWh consumption of cooling tower dropped by 40%
and even water consumption dropped
instead of 2400 kW the chiller makes now 3000 kW
and even during this extreme summer with 40°C - no problem at all
27
28.
Some benchmark of good COPThe COP relates very much on the ambient temperature
High temperature causes high condensing temperature
As a result the power input and energy consumption is high
Also important is to do the measurement at full load
In addition the load (system) has to be stable
Another influence is the evaporation temperature – of course this
varies with the application
• In addition COP comparison between water and air cooled chillers is
not correct, as for air cooled chillers the fan power is included, but on
water cooled chillers it is not
• To check the entire system best way is to build the quotient of
η = cooling capacity [kW] / (Pi chiller + Pi fans + Pi pumps) [kW]
28
29.
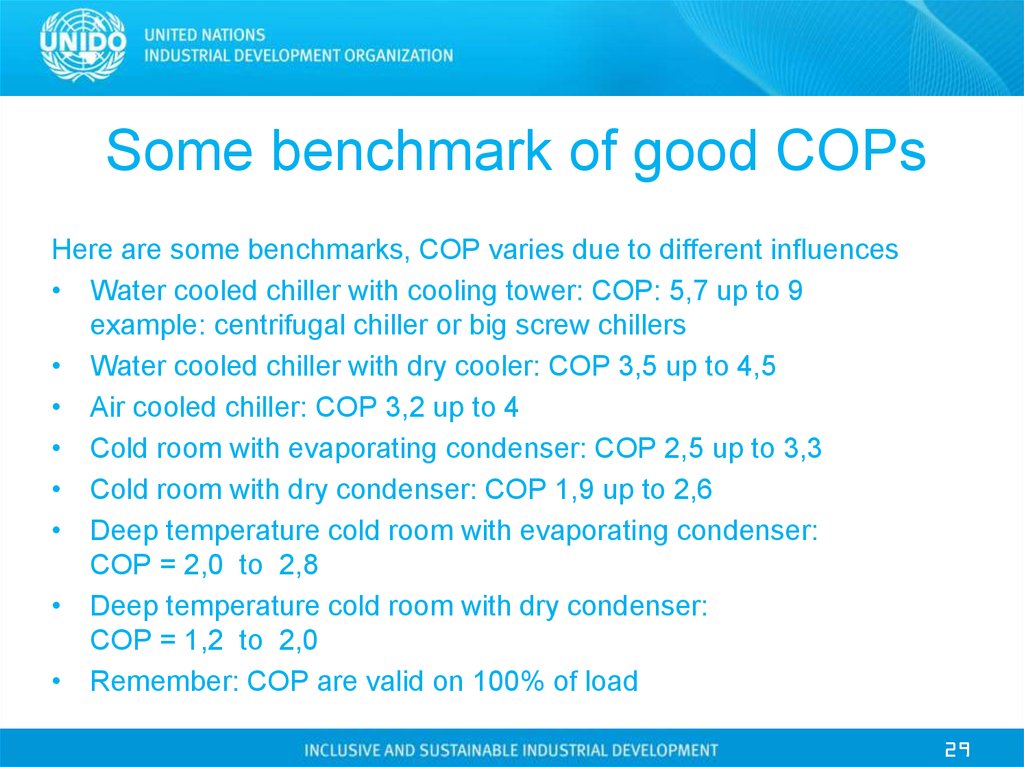
Some benchmark of good COPsHere are some benchmarks, COP varies due to different influences
• Water cooled chiller with cooling tower: COP: 5,7 up to 9
example: centrifugal chiller or big screw chillers
• Water cooled chiller with dry cooler: COP 3,5 up to 4,5
• Air cooled chiller: COP 3,2 up to 4
• Cold room with evaporating condenser: COP 2,5 up to 3,3
• Cold room with dry condenser: COP 1,9 up to 2,6
• Deep temperature cold room with evaporating condenser:
COP = 2,0 to 2,8
• Deep temperature cold room with dry condenser:
COP = 1,2 to 2,0
• Remember: COP are valid on 100% of load
29
30.
Thank you for your attentionFor more information:
Mr. Markus KALCHBRENNER
COFELY Gebäudetechnik GmbH
Phone: +7 495 941 99 78
Fax:
+7 495 941 99 69
Cell:
+7 963 721 97 75
Leberstr. 120
1110 Wien
E-mail: markus.kalchbrenner@cofely.ru
30