


 Английский язык
Похожие презентации:


Preparation of article materials for rating journals
1. Подготовка материалов статей для рейтинговых журналов March 28, 2018, 10:00 – 11:00pm
NSTUПодготовка материалов
статей для рейтинговых
журналов
March 28, 2018, 10:00 – 11:00pm
Elena N. Naumova
Professor of Mathematics
Tufts University, Boston MA USA
Elena.Naumova@tufts.edu
2. Content
Publication typesPublication structure
Main Elements
Title
Abstract
Data and Methods
Results
Discussion
Miscellaneous
Recommendations
2
Q&A
Visualization
and effective
communication
3. Main Principles
EvidenceEfficiency
Rule 1: A logical path, context, underlying
concepts, or results should rest on solid
evidence and facts.
Rule 2: Explanations of methods, results and
concepts should consider audience level
and interests.
Rule 3: Delivery should be user-friendly,
force to note the unexpected, motivate
questions, clarify statements.
Emphasis
3
4. Publication types
Original researchReviews
Systematic review
Meta-analysis
Case study
Opinion
Perspective
Commentary
Letter to the Editors
4
Book chapter
Different
weights in
different
disciplines
5. Publication: structure
Abstract. Offer brief structured summaryConsider time
commitment
to each part!
Introduction. Set the stage, identify significance,
novelty, originality; define long-term goals and
specific objectives.
Data and Methods. Describe data collected and
utilized in the study; describe methodology and
specific techniques of data collection and analysis
Results. Provide description of findings
Discussion and Conclusions. Justify methodology
for data collection and analysis; strengths and
limitations of the study; the context and
interpretation of findings.
Cited Literature
Acknowledgements
Supplementary Material
5
6. Publication: main elements
Title - full and running titlesAuthorship - roles and affiliation
Summaries - highlights, abstract and
conclusions
Data - primary and secondary data
sources, ownership and agreements
Methods - ownership and credits
Acknowledgments - funding, ownership,
credits, contributions
6
7. Publication: main elements
Title - full and running titlesSummaries - highlights,
abstract and conclusions
Introduction - set the
objectives
Authorship - order and roles
Affiliations
7
8. Abstract Outline
FieldsDisciplines
Problem
Study design
Data source
Analysis
Results
Conclusion
8
9. Publication: main elements
Data - primary and secondary datasources
Methods - order, logic, sequence,
notation
9
Gantt chart helps in foreseeing
the possible time a project task
can take and when tasks can
possibly be finished.
https://www.e-education.psu.edu/geog871/l5_p5.html
10. Publication: main elements
Results - core materialsSupplementary Material
Discussion - order, logic, sequence study
limitations and strength
Conclusion - funding, ownership, credits,
contributions
Bibliography - limits, rationale, selfcitation
Acknowledgments - funding, ownership,
credits, contributions
10
11. Use of visuals in a publication
Abstract - GraphicalAbstract
Introduction - Process flow,
conceptual mapping
Data and methods - Process
and data flow;
geographical and
conceptual mapping
Results - All types
Discussion - All types
Supplemental Materials - All
types
11
12. Schematics, Illustrations, Visuals
http://dx.doi.org/doi:10.1016/j.ijheh.2016.09.019Process-based
Structure-based
Covert a list or a table
into a visual
Simplify or clarify
complex structures
Compact information
12
Figure 1. Schematic of three spatial approaches (S: A, B, and
C). Households (Hi) and potential source taps (Tj) are first
selected based on same-day sampling (t), and then source
taps are selected based on measures of proximity (Euclidean
and network distances).
13. Process-based Visuals
Time course and cycles sequence of stepsFlow charts - sequence of
steps and a decision tree
Gantt charts - sequence of
steps, roles and milestones
Could be
oversimplified
overwhelming
confusing
13
FIG. 1 DATA PROCESSING STEPS AND
SUBSEQUENT SAMPLE SIZE REDUCTION
14. Structure-based Visuals
Hierarchy - organization,order, relationships
Relationship - properties,
qualities, quantities
Diagrams - sequence of
steps, roles and milestones
Covert a list or a table into a
visual
Simplify or clarify a complex
structure
Compact the volume
14
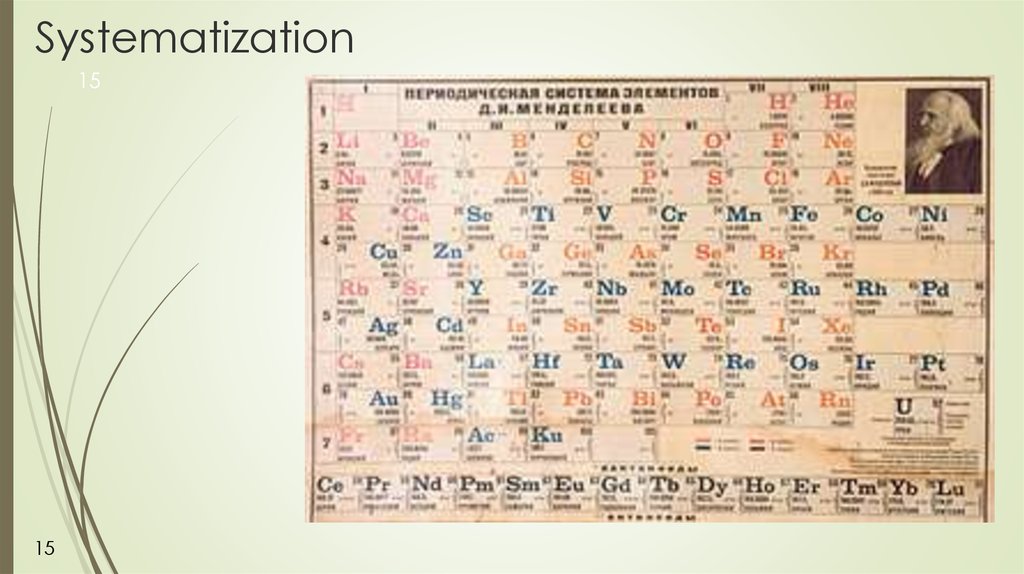
15.
Systematization15
15
16.
1616
Building process- and
structure- based graphs:
Compilation
Relationship
Organization
Properties
Advantages:
Big volume of data
Variety of data
Versatility
Teaching tool
Challenges:
Complex
Take time to understand
Color clash
Small font size
Solutions:
Testing for comprehension
Testing for perception
Arrangement
User control
17. Next steps:
Edit, review, seek feedbackRepeat
17