


")


 Costs Budget Schedule 8: Other (Nonproduction) Costs Budget For the Year Ended December 31, 2000")


 Английский язык
Похожие презентации:


")


Master budget
1. MASTER BUDGET
Chapter 62. Budget
Budget is a quantitative expression for aset time period of proposed future plan of
action by management.
It can cover both financial and nonfinancial
aspects of these plans and acts as a
blueprint for the company to follow in the
upcoming period.
3.
Budgets covering the financial aspectsquantify management’s expectations
regarding future income, cash flows, and
financial position.
Just as individual financial statements are
prepared covering past periods, so they
can be prepared covering future periodsfor example, a budgeted income
statement, a budgeted cash flow
statement, and a budgeted balance sheet.
4.
Well-managed organizations usually havethe following budgeting cycle:
1. Planning the organization as a whole as
well as of its subunits. The entire
management team agrees as to what is
expected.
2. Providing a frame of reference, a set of
specific expectations against which
actual results can be compared.
5.
3.4.
Investigating variations from plans. If
necessary, corrective action follows
investigation.
Planning again, considering feedback
and changed conditions.
6. Master budget
Master budget coordinates all thefinancial projections in the organization’s
individual budgets in a single
organizationwide set of budgets for a set
time period.
It embraces the impact of both operating
decisions and financing decisions.
7.
Operating decisions center on theacquisition and use of scare resources.
Financing decisions center on how to get
the funds to acquire resources.
8. Pro forma statements
The terminology used to describe budgetsvaries among organizations.
For example, budgeted financial
statements are sometimes called pro
forma statements.
9.
The budgeted financial statements ofmany companies include the budgeted
income statement, the budgeted balance
sheet, and the budgeted statement of cash
flows.
10. Coordination
Coordination is the meshing and balancingof all factors of production or service and
of all the departments and business
functions so that the company can meet its
objectives.
11. Communication
Communication is getting those objectivesunderstood and accepted by all
departments and functions.
12.
Coordination forces executives to think ofrelationships among individual operations,
departments, and the company as a
whole.
Coordination implies, for example, that
purchasing officers make material
purchase plans on the basis of production
requirements.
Also, production managers plan personnel
and machinery needs to produce the
number of products necessary to meet
revenue forecasts.
13.
For coordination to succeed,communication is essential.
The production manager must know the
sales plan.
The purchasing manager must know the
production plan, and so on.
Having a formal document such as the
budget is an effective way to communicate
a consistent set of plans to the
organization as a whole.
14.
Budgets should not be administered rapidly.Changing conditions call for changes in
plans.
A manager may commit to the budget, but a
situation might develop where some special
repairs or a special advertising program
would better serve the interests of the
organization.
The manager should not defer the repairs or
the advertising in order to meet the budget if
such actions will hurt the organization in the
long run. Attaining the budget should not be
an end in itself.
15.
The most frequently used budget period isone year.
The annual budget is often subdivided by
months for the first quarter and by quarters
for the remainder of the year.
The budgeted data for a year are
frequently revised as the year unfolds.
For example, at the end of the first quarter,
the budget for the next three quarters is
changed in light of new information.
16. Rolling budget
Businesses are increasingly using rollingbudgets.
Rolling budget is a budget or plan that is
always available for a specified future
period by adding a month, quarter, or year
in the future as the month, quarter, or year
just ended is dropped.
17.
Thus, a 12-month rolling budget for theMarch 2000 to February 2001 period
becomes a 12-month rolling budget for the
April 2000 to March 2001 period the next
month, and so on.
There is always a 12-month budget in
place.
Companies also frequently use rolling
budgets when developing five-year
budgets for long-run planning.
18.
Halifax Engineering is a machine shop thatuses skilled labor and metal alloys to
manufacture two types of aircraft
replacement parts- Regular and Heavy
Duty.
Halifax manager is ready to prepare a
master budget for the year 2000.
To keep our illustration manageable for
clarifying basic relationships, we make the
following assumptions:
19.
1.2.
3.
The only source of revenue is sales of
two parts. Non-sales-related revenue,
such as interest income, is assumed to
be zero.
Work-in-process inventory is negligible
and is ignored.
Direct material inventory and finished
goods inventory are costed using the
FIFO method.
20.
4.5.
6.
Unit costs of direct materials purchased
and finished goods sold remain
unchanged throughout the budget year
(2000).
Variable production costs are variable with
respect to direct manufacturing laborhours. Variable nonproduction costs are
variable with respect to the revenues.
For computing inventoriable costs, all
manufacturing costs (fixed and variable)
are allocated using a single allocation
base- direct manufacturing labor-hours.
21.
After carefully examining all relevant factors,the executives of Halifax Engineering
forecast the following figures for 2000:
Direct materials:
Material
111 alloy
Material 112 alloy
kilogram
$7 per kilogram
$10 per
Direct manufacturing labor $20 per hour
22.
Content of Product Regular Heavy-DutyUnit
111 Alloy
12 kg
12 kg
112 Alloy
6 kg
8 kg
Direct
labor
manufacturing 4 h
6h
23.
All direct manufacturing costs are variablewith respect to the units of output
produced. Additional information regarding
the year 2000 is as follows:
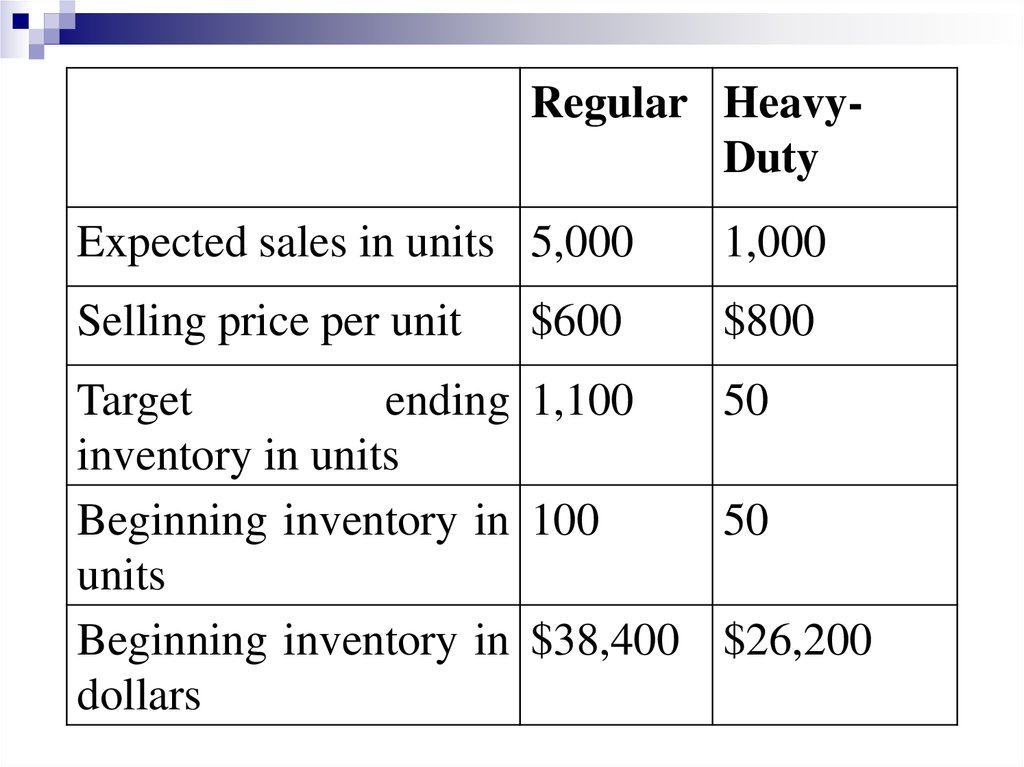
24.
Regular HeavyDutyExpected sales in units 5,000
1,000
Selling price per unit
$800
$600
Target
ending 1,100
50
inventory in units
Beginning inventory in 100
50
units
Beginning inventory in $38,400 $26,200
dollars
25.
111 Alloy 112 AlloyBeg. inventory in kg
7,000
6,000
Target end. inventory in 8,000
kg.
2,000
26.
At the anticipated output levels for theRegular and Heavy Duty aircraft parts,
management believes the following
manufacturing overhead costs will be
incurred:
27.
Manufacturing overhead costsVariable
$780,000
Fixed
$420,000
Other costs
Variable
475,000
Fixed
395,000
28.
Our task is to prepare a budgetedincome statement for the year 2000.
29.
STEPS IN PREPARINGAN OPERATING BUDGET
30. Step 1: Revenue Budget
Schedule 1: Revenue BudgetFor the Year Ended December 31, 2000
Selling
Total
Units
Price
Revenues
Regular
?
?
?
HeavyDuty
Total
?
?
?
?
31.
Schedule 1: Revenue BudgetFor the Year Ended December 31, 2000
Units
Regular
5,000
HeavyDuty
1,000
Total
Selling
Price
Total
Revenues
$600 $3,000,000
800
800,000
$3,800,000
32. Step 2: Production Budget (in Units)
BudgetedProduction
(units)
=
Budgeted
sales
(units)
+
Targeted
ending
finished
goods
inventory
(units)
-
Beginning
finished
goods
inventory
(units)
33.
Schedule 2: Production Budget (in Units)For the Year Ended December 31, 2000
Product
Regular
Heavy-Duty
Budgeted sales
(schedule 1)
Add: Target ending finished
goods inventory
Total requirements
?
?
?
?
?
?
Deduct: Beginning finished
goods inventory
Units to be produced
?
?
?
?
34.
Schedule 2: Production Budget (in Units)For the Year Ended December 31, 2000
Product
Regular
Heavy-Duty
Budgeted sales
(schedule 1)
Add: Target ending finished
goods inventory
Total requirements
5,000
1,000
1,100
50
6,100
1,050
Deduct: Beginning finished
goods inventory
Units to be produced
100
50
6,000
1,000
35. Step 3: Direct Materials Usage Budget and Direct Materials Purchase Budget
Schedule 3A:Direct Materials Usage Budget in
Kilograms and Dollars
For the Year Ended December 31, 2000
36.
Materials111 Alloy
112 Alloy
Direct materials to be used
in production of Regular
parts (see schedule 2)
?
?
Direct materials to be used
in production of HeavyDuty parts (see schedule 2)
?
?
Total direct materials to be
used (in kilograms)
?
?
37.
Materials111 Alloy
112 Alloy
Direct materials to be used
from beginning inventory
(under FIFO)
?
?
Multiply by: Cost per
kilogram of beginning
inventory
?
?
Cost of direct materials to be
used from beginning
inventory: (a)
?
?
38.
Materials111 Alloy
112 Alloy
Direct materials to be used
from purchases
?
?
Multiply by: Cost per
kilogram of purchased
materials
?
?
Cost of direct materials to be
used from purchases: (b)
?
?
Total cost of direct materials
to be used: (a)+(b)
?
?
39.
Schedule 3A:Direct Materials Usage Budget in
Kilograms and Dollars
For the Year Ended December 31, 2000
40.
Materials111 Alloy
112 Alloy
Direct materials to be used in
production of Regular parts
(see schedule 2)
72,000
36,000
Direct materials to be used in
production of Heavy- Duty
parts (see schedule 2)
12,000
8,000
Total direct materials to be
used (in kilograms)
84,000
44,000
41.
Materials111 Alloy
Direct materials to be used
from beginning inventory
(under FIFO)
Multiply by: Cost per
kilogram of beginning
inventory
Cost of direct materials to be
used from beginning
inventory: (a)
112 Alloy
7,000
6,000
$7
$10
$49,000
$60,000
42.
Materials111 Alloy
Direct materials to be used
from purchases
112 Alloy
77,000
38,000
$7
$10
Cost of direct materials to be
used from purchases: (b)
$539,000
$380,000
Total cost of direct materials
to be used: (a)+(b)
$588,000
$440,000
Multiply by: Cost per
kilogram of purchased
materials
43.
Purchases ofdirect
materials
=
Usage of
direct
materials
+
Target ending
inventory of direct
materials
Beginning
inventory of
direct
materials
44.
Schedule 3B:Direct Materials Purchases Budget
For the Year Ended December 31, 2000
45.
Material111 Alloy
112 Alloy
Direct materials to be used in
production (in kilograms)
from schedule 3A
?
?
Add: Target ending direct
materials inventory (in
kilograms)
?
?
Total requirements (in
kilogram)
?
?
46.
Material111 Alloy
112 Alloy
Total requirements (in
kilogram)
?
?
Deduct: Beginning direct
materials inventory (in
kilograms)
?
?
Direct materials to be
purchased (in kilograms)
?
?
47.
Material111 Alloy
112 Alloy
Direct materials to be
purchased (in kilograms)
?
?
Multiply by: Cost per
kilogram of purchased
materials
?
?
Total direct materials
purchase costs
?
?
48.
Material111 Alloy
Direct materials to be used in
production (in kilograms)
from schedule 3A
Add: Target ending direct
materials inventory (in
kilograms)
Total requirements (in
kilogram)
112 Alloy
84,000
44,000
8,000
2,000
92,000
46,000
49.
Material111 Alloy
Total requirements (in
kilogram)
112 Alloy
92,000
46,000
Deduct: Beginning direct
materials inventory (in
kilograms)
7,000
6,000
Direct materials to be
purchased (in kilograms)
85,000
40,000
50.
Material111 Alloy
Direct materials to be
purchased (in kilograms)
Multiply by: Cost per
kilogram of purchased
materials
Total direct materials
purchase costs
112 Alloy
85,000
40,000
$7
$10
$595,000
$400,000
51.
Step 4: Direct Manufacturing Labor BudgetSchedule 4: Direct Manufacturing Labor Budget
For the Year Ended December 31, 2000
52.
OutputUnits
Produc
ed
(sched
ule2)
Direct Total Hourly
Manuf Hours Wage
acturin
rate
g
LaborHours
per
Unit
Total
Regular
?
?
?
?
?
HD
?
?
?
?
?
Total
?
?
53.
OutputUnits
Produc
ed
(sched
ule2)
Regular
6,000
HD
1,000
Total
Direct Total Hourly
Manuf Hours Wage
acturin
rate
g
LaborHours
per
Unit
4
24,000
$20
6
6,000
30,000
20
Total
$480,000
120,000
$600,000
54.
Step 5: Manufacturing Overhead BudgetSchedule 5: Manufacturing Overhead Budget
For the Year Ended December 31, 2000
55.
At Budgeted Level of30,000 Direct
Manufacturing LaborHours
Variable manufacturing
overhead costs
?
Fixed Manufacturing
overhead costs
?
Total manufacturing
overhead costs
?
56.
At Budgeted Level of30,000 Direct
Manufacturing LaborHours
Variable manufacturing
overhead costs
Fixed Manufacturing
overhead costs
Total manufacturing
overhead costs
$780,000
420,000
$1,200,000
57.
Step 6: Ending Inventory BudgetSchedule 6A:
Computation of Unit Costs of
Manufacturing Finished Goods in 2000
58.
111 Alloy112 Alloy
Cost
Product
per
Regular
Heavy- Duty
Unit
Inputs Amount Inputs Amount
of
Input
?
?
?
?
?
?
?
?
?
?
Direct
Manufacturing
Labor
?
?
?
?
?
Manufacturing
Overhead
Total
?
?
?
?
?
?
?
59.
CostProduct
per
Regular
Heavy- Duty
Unit
Inputs Amount
Inputs
Amount
of
Input
111 Alloy
112 Alloy
Direct
Manufacturing
Labor
Manufacturing
Overhead
Total
$ 7
10
20
12
6
4
$ 84
60
80
12
8
6
$ 84
80
120
40
4
160
6
240
$384
$524
60.
Schedule 6B:Ending Inventory Budget
December 31, 2000
61.
KgCost per
Kg
?
?
?
112 alloy
Finished
goods
Regular
?
Unit
?
?
?
Cost per
Unit
?
HD
Total End
Inv
?
?
?
Direct
materials
111 alloy
Total
?
?
?
?
62.
Cost perKg
Kg
Direct
materials
111 alloy
112 alloy
Finished
goods
Regular
HD
Total End
Inv
8,000
$ 7
Total
$56,000
2,000
10
20,000
Cost per
Unit
Unit
1,100
$384 $422,400
50
524
$76,000
26,200 $448,600
$524,600
63.
Step 7: Cost of Goods Sold BudgetSchedule 7: Cost of Goods Sold Budget
For the Year Ended December 31, 2000
64.
FromTotal ($)
Schedule
Beginning finished goods
inventory, January 1, 2000
Given
Cost of goods manufactured
6A
Cost of goods available for sale
Deduct: Ending finished goods
inventory, December 31, 2000
Cost of goods sold
64,600
?
?
6B
?
?
65.
FromTotal ($)
Schedule
Beginning finished goods
inventory, January 1, 2000
Given
Cost of goods manufactured
6A
Cost of goods available for sale
Deduct: Ending finished goods
inventory, December 31, 2000
Cost of goods sold
64,600
2,828,000
2,892,600
6B
448,600
2,444,000
66. Step 8: Other (Nonproduction) Costs Budget Schedule 8: Other (Nonproduction) Costs Budget For the Year Ended December 31, 2000
Variable Costs?
Fixed Costs
?
Total Costs
?
67.
Variable Costs$475,000
Fixed Costs
395,000
Total Costs
$870,000
68.
Halifax EngineeringBudgeted Income Statement
For the Year Ended December 31, 2000
69.
RevenuesSchedule ?
?
COGS
Schedule ?
?
Gross Margin
Operating Costs
Operating
Income
?
Schedule ?
?
?
70.
RevenuesSchedule 1
$3,800,000
COGS
Schedule 7
2,444,000
Gross Margin
Operating Costs
Operating
Income
1,356,000
Schedule 8
870,000
$486,000