


 Английский язык
Похожие презентации:


Article format
1.
2. Article format is :
ARTICLEFORMAT IS :
TITLE
AUTHORS
ABSTRACT
INTRODUCTION
MATERIALS AND METHODS
RESULTS
TABLES AND GRAPHS
DISCUSSION& Conclusion
REFERENCES (LITERATURE CITED)
3. Results
RESULTS1. This is where you present the
results you've gotten. Use graphs
and tables if appropriate, but also
summarize your main findings in
the text. Do NOT discuss the
results or speculate as to why
something happened; that goes
in the Discussion.
4.
2. You don't necessarily have toinclude all the data you've gotten
during the semester. This isn't a
diary.
5.
3. Use appropriate methods ofshowing data. Don't try to
manipulate the data to make it look
like you did more than you actually
did.
6. TABLES AND GRAPHS
1. If you present your data in atable or graph, include a
title describing what's in
the table.
7.
2. Don't use a table or graph justto be "fancy". If you can
summarize the information in
one sentence, then a table or
graph is not necessary.
8.
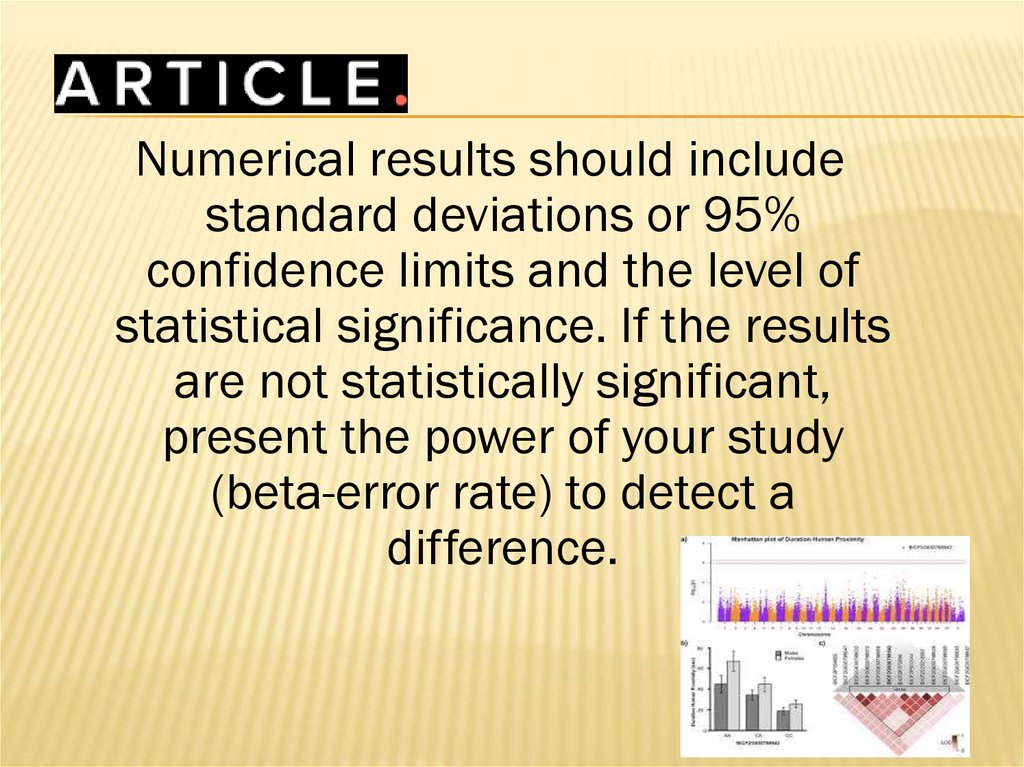
Numerical results should includestandard deviations or 95%
confidence limits and the level of
statistical significance. If the results
are not statistically significant,
present the power of your study
(beta-error rate) to detect a
difference.
9.
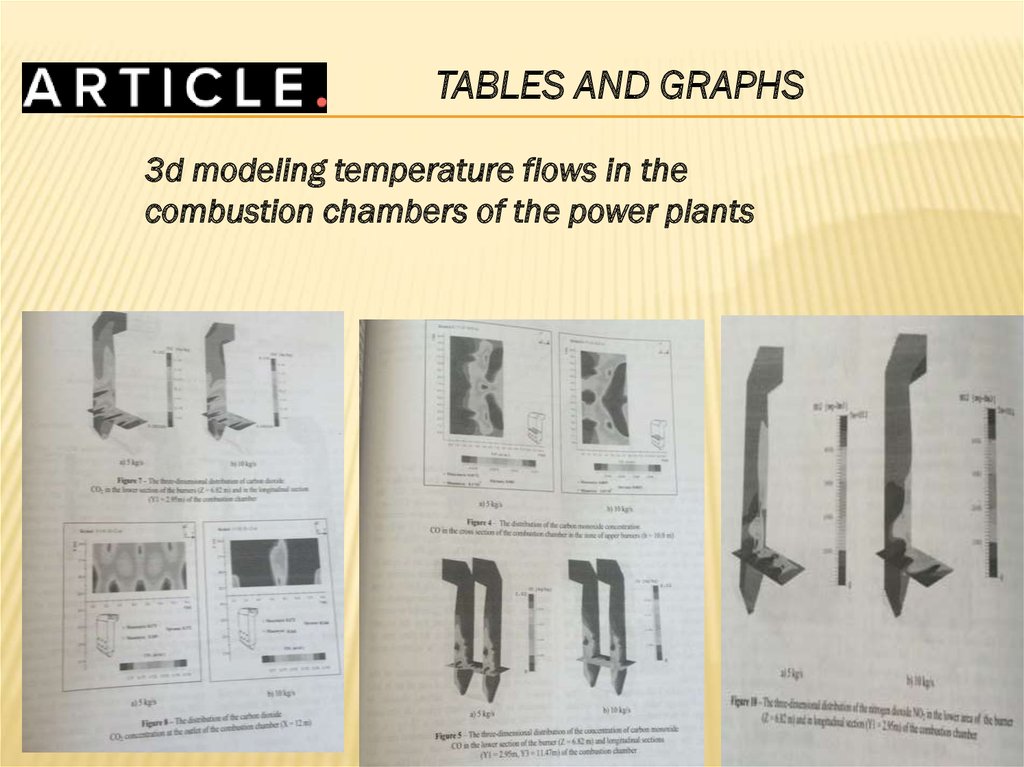
TABLES AND GRAPHS3d modeling temperature flows in the
combustion chambers of the power plants