


 Экономика
Похожие презентации:
")


Definition capacity
1. 2 CAPACITY
1.2.
3.
4.
5.
6.
Learning goals: After this chapter You will be able to
describe different ways to measure capacity, establish
maximum capacity and calculate capacity utilization,
discuss long- and short-term strategies to ease bottlenecks
and the concept of the theory-of-constraints approach,
explain the reasons for economies and diseconomies of
scale,
discuss strategic issues such as capacity cushions, timing
and sizing options and linkages with other decisions,
calculate capacity gaps and then evaluate plans for filling
them and
describe how waiting-line models, simulation and decision
trees can assist capacity decisions.
JAP
1
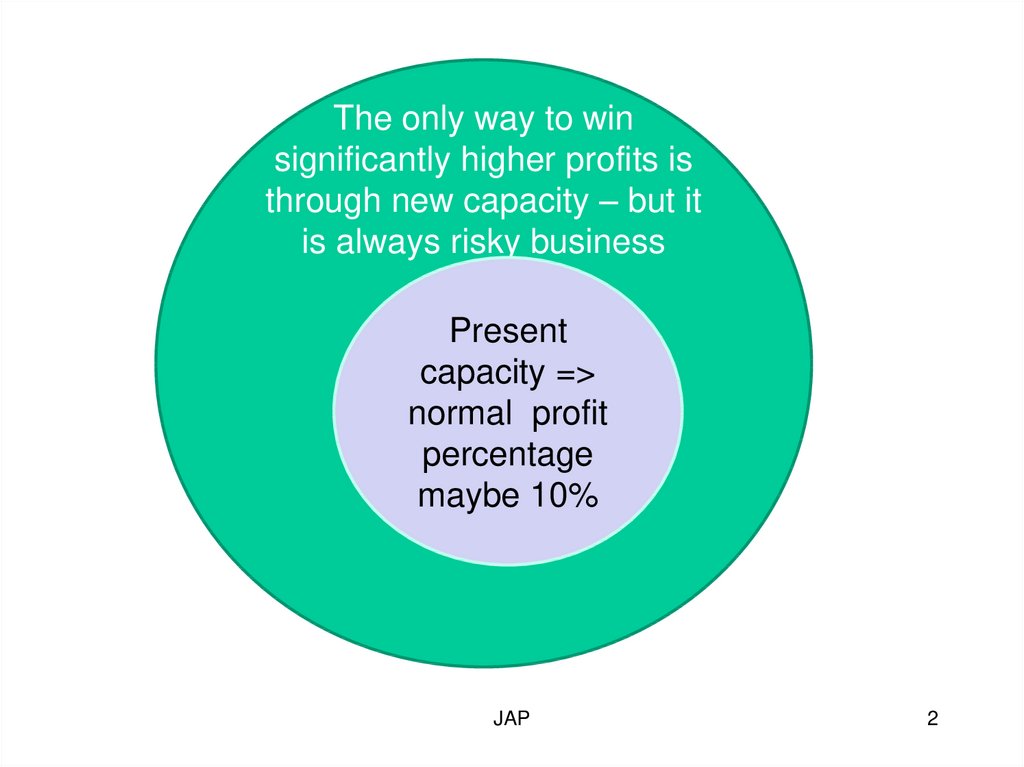
2.
The only way to winsignificantly higher profits is
through new capacity – but it
is always risky business
Present
capacity =>
normal profit
percentage
maybe 10%
JAP
2
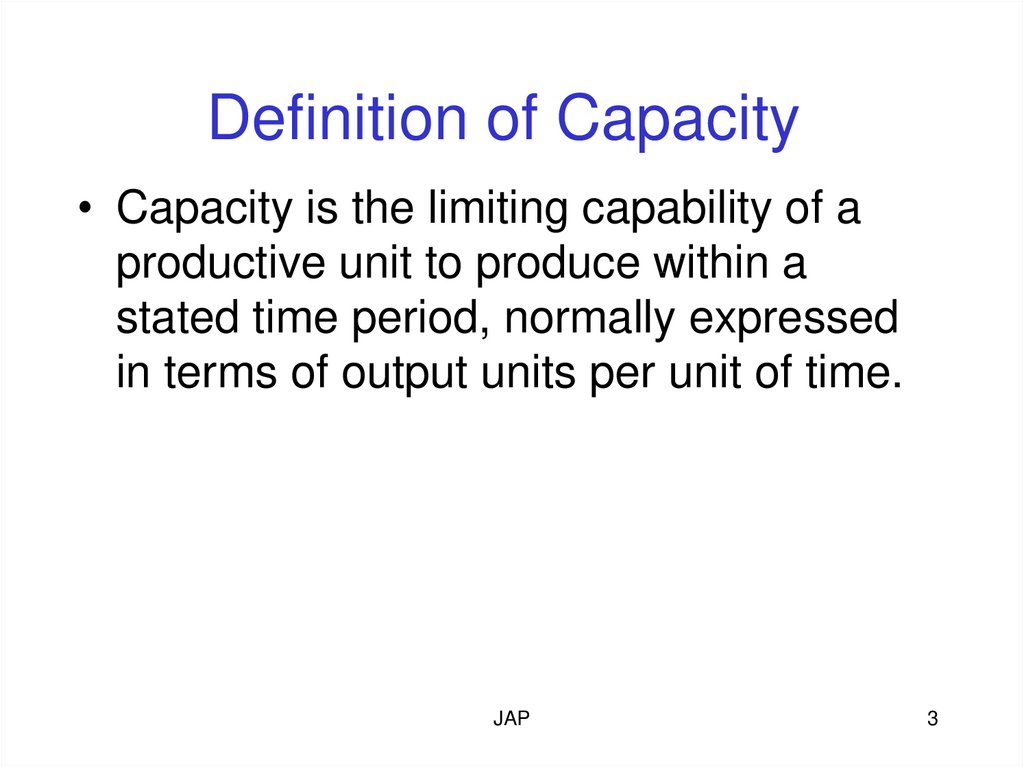
3.
Definition of Capacity• Capacity is the limiting capability of a
productive unit to produce within a
stated time period, normally expressed
in terms of output units per unit of time.
JAP
3
4.
Fabrication Facilities - infrastructure ascapacity, case Technip Ltd
Main Fabrication Workshops
Spar Section Workshop
Total area
40.000 m
Workshop area 4.000 m2, 100 m x 40 m
Door 20 m x 18 m
Lifting height 18 m, cranes 2 x 80 tonnes
Workshop 130 x 28 m
• Door 27,7 x 26 m
• Lifting height 25 m, 2 x 100 t
• Lifting height 16 m, 50 t
Workshop 130 x 28 m
Door 19,5 x 10,8 m
Lifting height 12 m, 2 x 50 t, 1 x 60 t
Workshop 190 x 38 m
Door 34,6 x 14,4 m
Lifting height 14 m, 2 x 80 t
Lifting height 13 m, 60 t
JAP
4
4
5. Measures of capacity
• Work shop – machine hours, labor (work)hours / day / week / month / year…
• Steel plant – tons of steel produced
• Saw mill – cubic meters of sawn timber
• Power plants – megawatts of electricity , kg’s
of steam, megawatts of heat
• Transportation (carrier) – ton kilometers, load
carrying capacity
JAP
Notice! all in a
certain period of
time
5
6. DECIDING THE CAPACITY ?
DECIDING THEPRODUCTS AND SERVICES
OFFERED
DECIDING HOW AND
BY WHOM THEY ARE
PRODUCED
SHORT TERM
CAPACITY PLANS:
-WORKFORCE SIZE
-OVERTIME BUDGETS
-INVENTORIES
LONG TERM
CAPACITY PLANS:
-FACILITIES
-EQUIPMENT
JAP
6
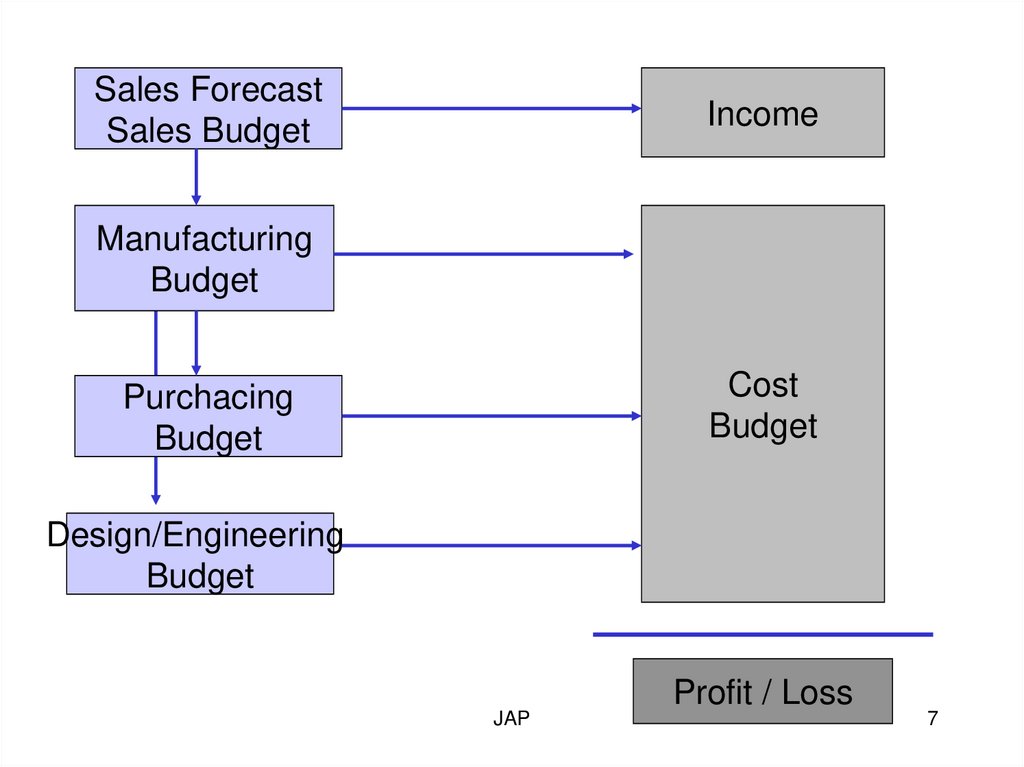
7.
Sales ForecastSales Budget
Income
Manufacturing
Budget
Cost
Budget
Purchacing
Budget
Design/Engineering
Budget
JAP
Profit / Loss
7
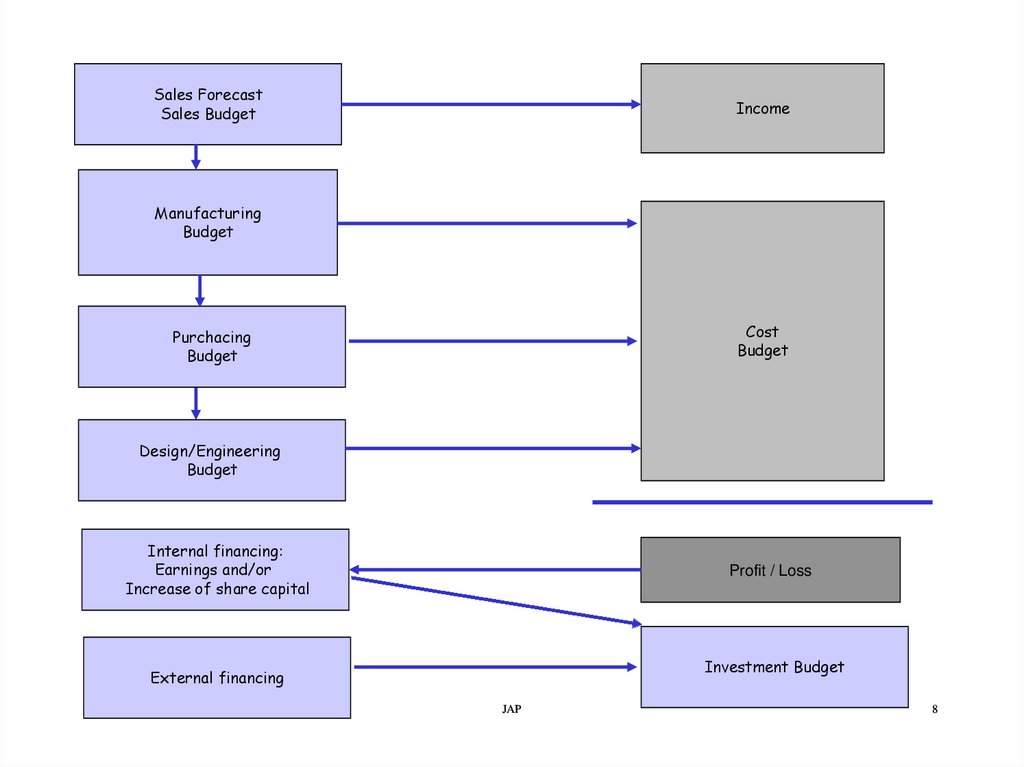
8.
Sales ForecastSales Budget
Income
Manufacturing
Budget
Cost
Budget
Purchacing
Budget
Design/Engineering
Budget
Internal financing:
Earnings and/or
Increase of share capital
Profit / Loss
Investment Budget
External financing
JAP
8
9.
DEFINITIONS OF CAPACITY:Capacity = the maximum rate of output for a process.
Utilization = The degree to which equipment, space or
labor is currently being used.
Utilization =
Average output rate
Maximum capacity
100%
Peak capacity or
Effective capacity
JAP
9
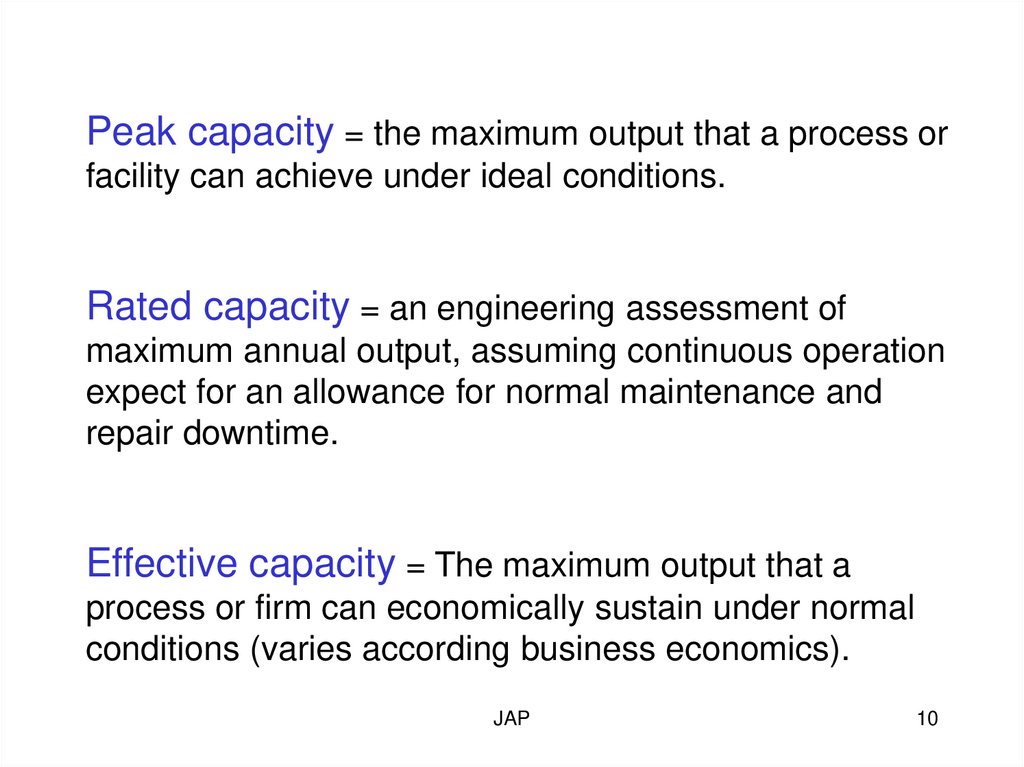
10.
Peak capacity = the maximum output that a process orfacility can achieve under ideal conditions.
Rated capacity = an engineering assessment of
maximum annual output, assuming continuous operation
expect for an allowance for normal maintenance and
repair downtime.
Effective capacity = The maximum output that a
process or firm can economically sustain under normal
conditions (varies according business economics).
JAP
10
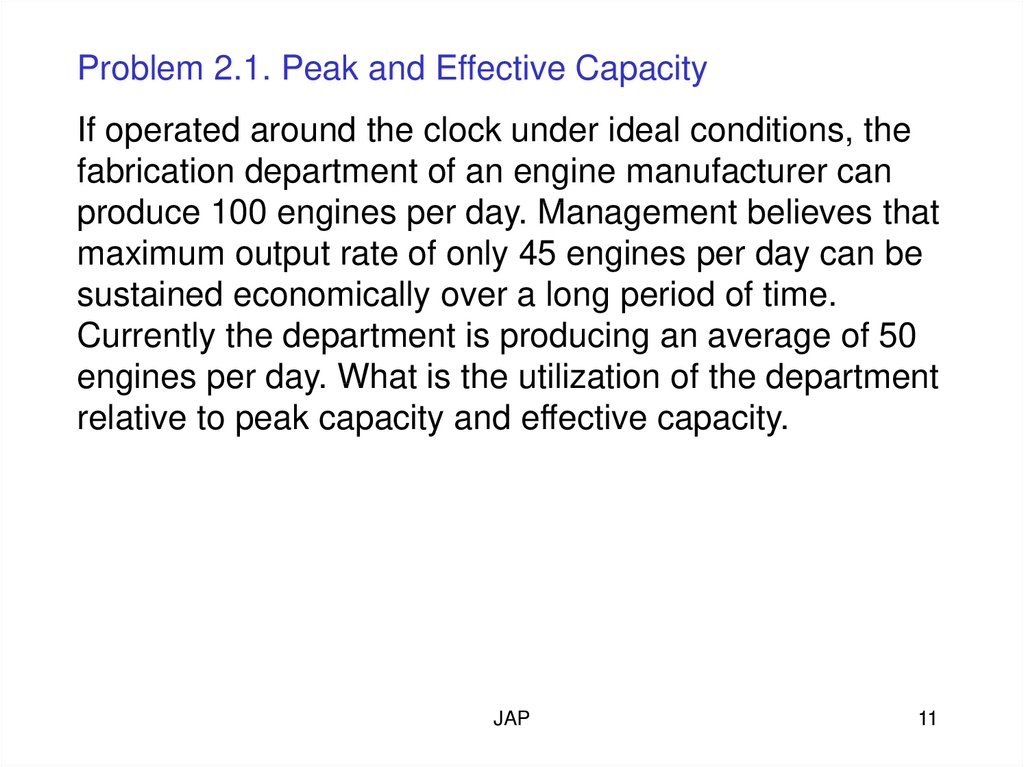
11.
Problem 2.1. Peak and Effective CapacityIf operated around the clock under ideal conditions, the
fabrication department of an engine manufacturer can
produce 100 engines per day. Management believes that
maximum output rate of only 45 engines per day can be
sustained economically over a long period of time.
Currently the department is producing an average of 50
engines per day. What is the utilization of the department
relative to peak capacity and effective capacity.
JAP
11
12.
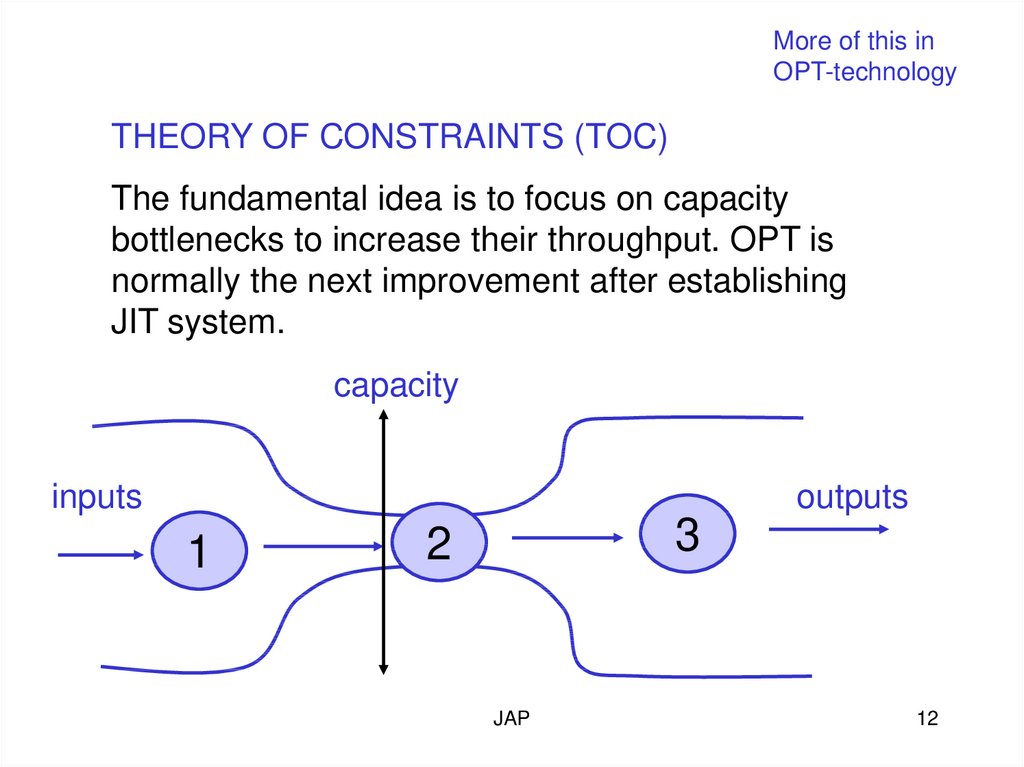
More of this inOPT-technology
THEORY OF CONSTRAINTS (TOC)
The fundamental idea is to focus on capacity
bottlenecks to increase their throughput. OPT is
normally the next improvement after establishing
JIT system.
capacity
inputs
outputs
1
3
2
JAP
12
13.
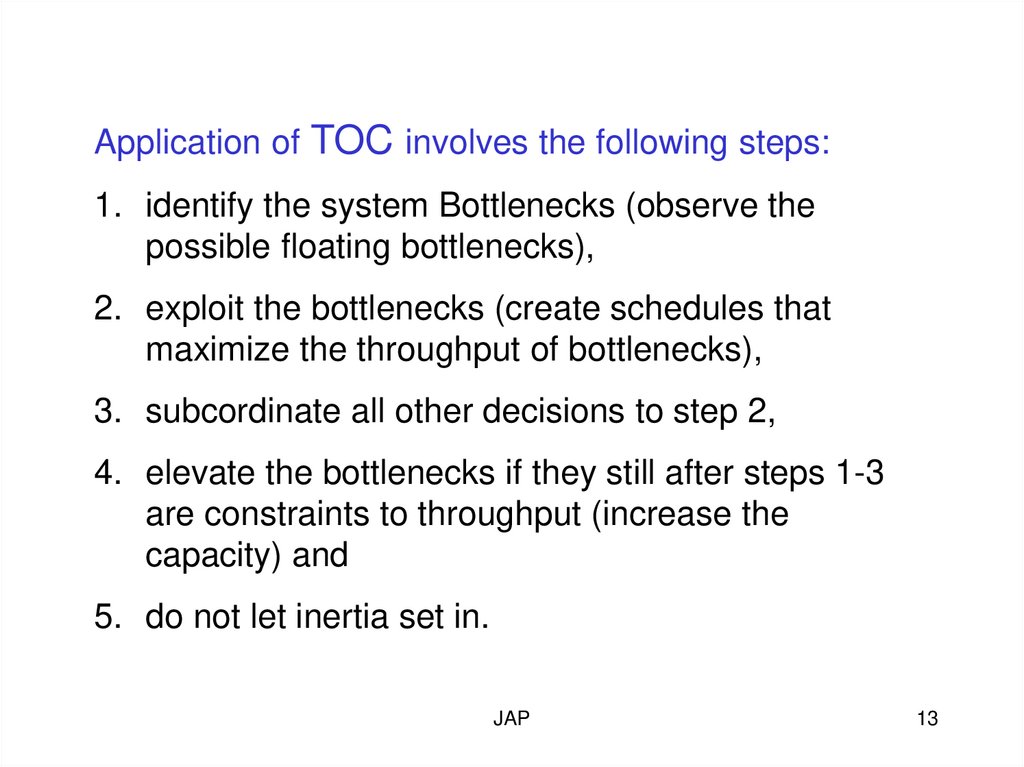
Application of TOC involves the following steps:1. identify the system Bottlenecks (observe the
possible floating bottlenecks),
2. exploit the bottlenecks (create schedules that
maximize the throughput of bottlenecks),
3. subcordinate all other decisions to step 2,
4. elevate the bottlenecks if they still after steps 1-3
are constraints to throughput (increase the
capacity) and
5. do not let inertia set in.
JAP
13
14.
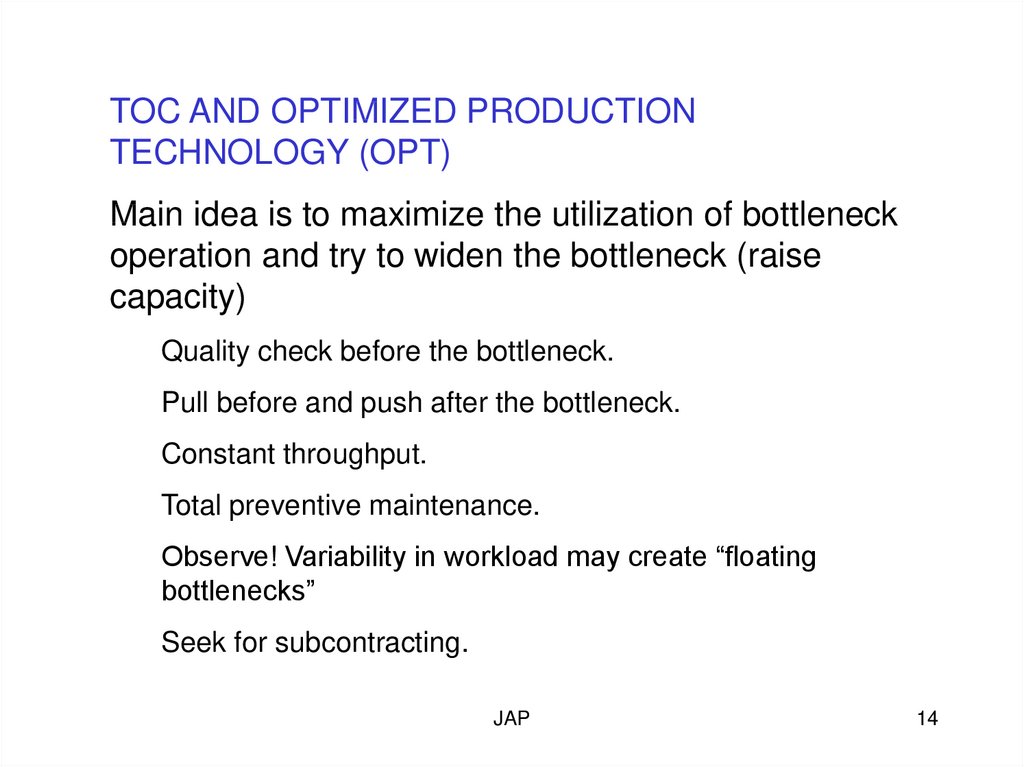
TOC AND OPTIMIZED PRODUCTIONTECHNOLOGY (OPT)
Main idea is to maximize the utilization of bottleneck
operation and try to widen the bottleneck (raise
capacity)
Quality check before the bottleneck.
Pull before and push after the bottleneck.
Constant throughput.
Total preventive maintenance.
Observe! Variability in workload may create “floating
bottlenecks”
Seek for subcontracting.
JAP
14
15.
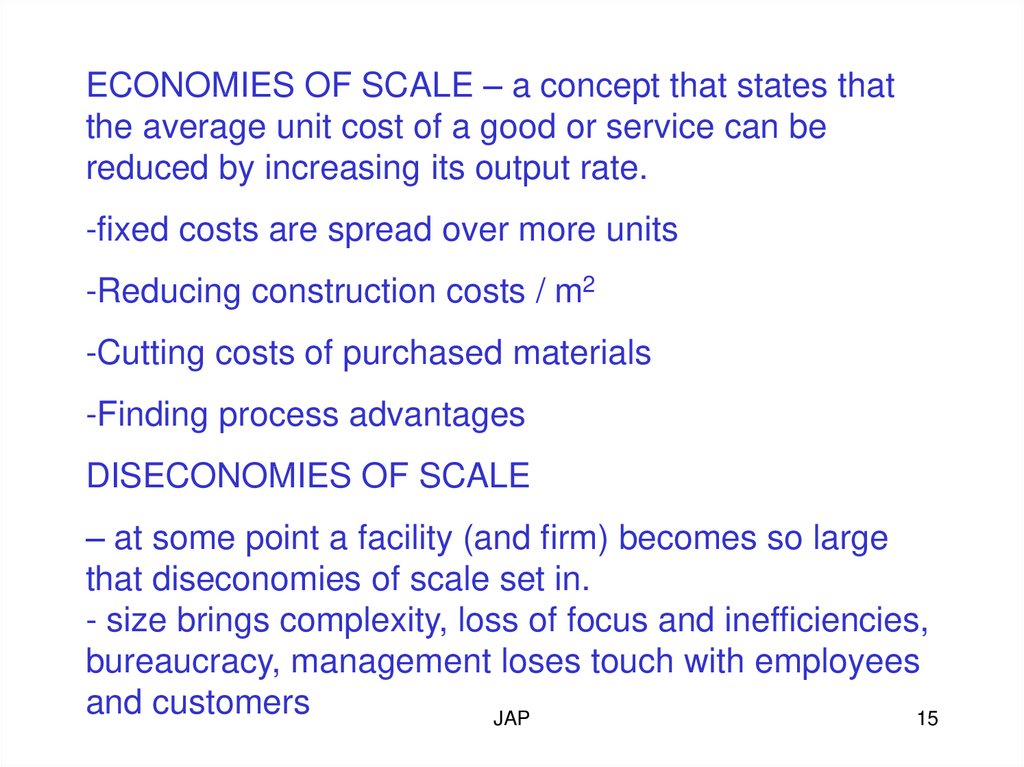
ECONOMIES OF SCALE – a concept that states thatthe average unit cost of a good or service can be
reduced by increasing its output rate.
-fixed costs are spread over more units
-Reducing construction costs / m2
-Cutting costs of purchased materials
-Finding process advantages
DISECONOMIES OF SCALE
– at some point a facility (and firm) becomes so large
that diseconomies of scale set in.
- size brings complexity, loss of focus and inefficiencies,
bureaucracy, management loses touch with employees
and customers
JAP
15
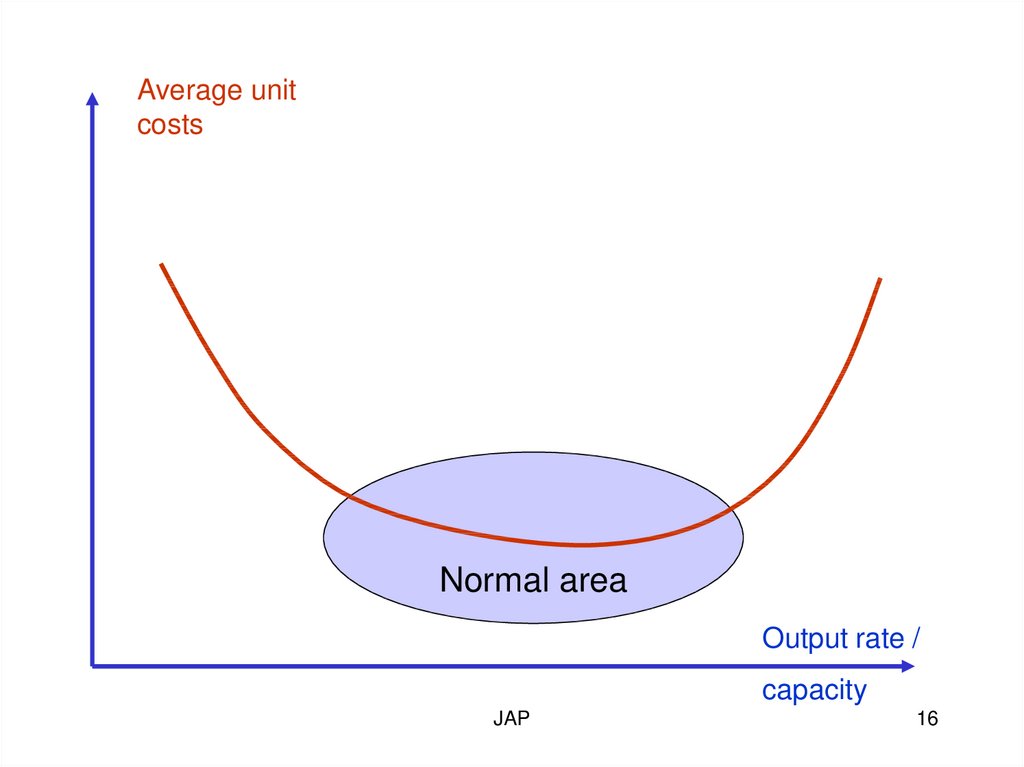
16.
Average unitcosts
Normal area
Output rate /
capacity
JAP
16
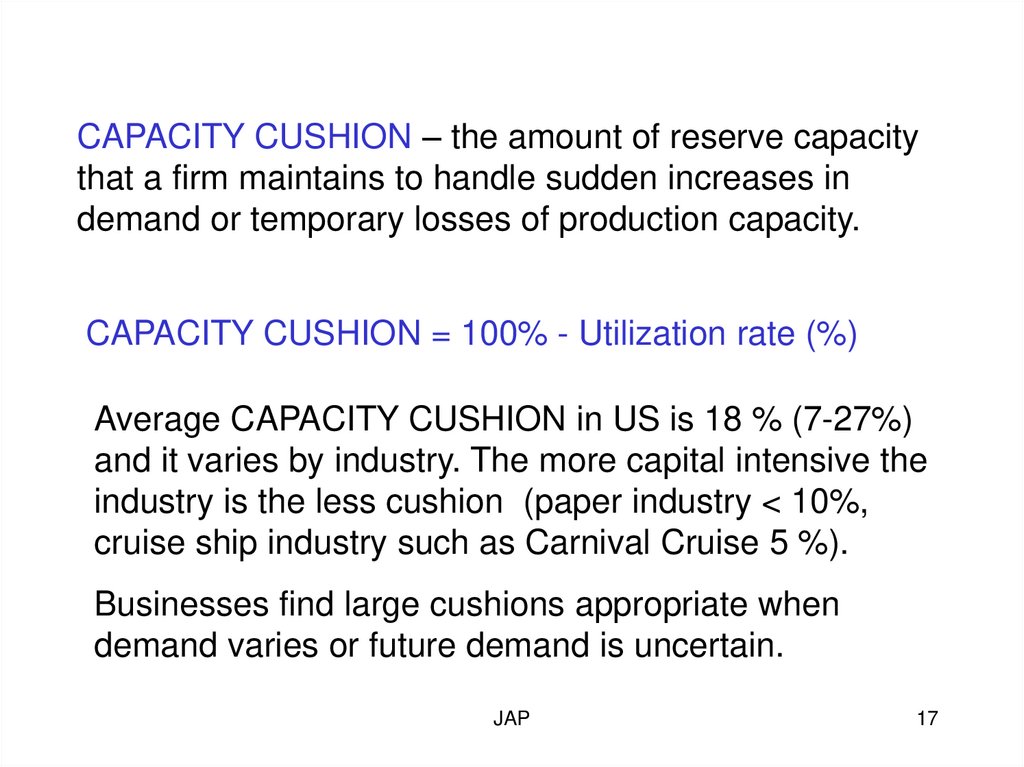
17.
CAPACITY CUSHION – the amount of reserve capacitythat a firm maintains to handle sudden increases in
demand or temporary losses of production capacity.
CAPACITY CUSHION = 100% - Utilization rate (%)
Average CAPACITY CUSHION in US is 18 % (7-27%)
and it varies by industry. The more capital intensive the
industry is the less cushion (paper industry < 10%,
cruise ship industry such as Carnival Cruise 5 %).
Businesses find large cushions appropriate when
demand varies or future demand is uncertain.
JAP
17
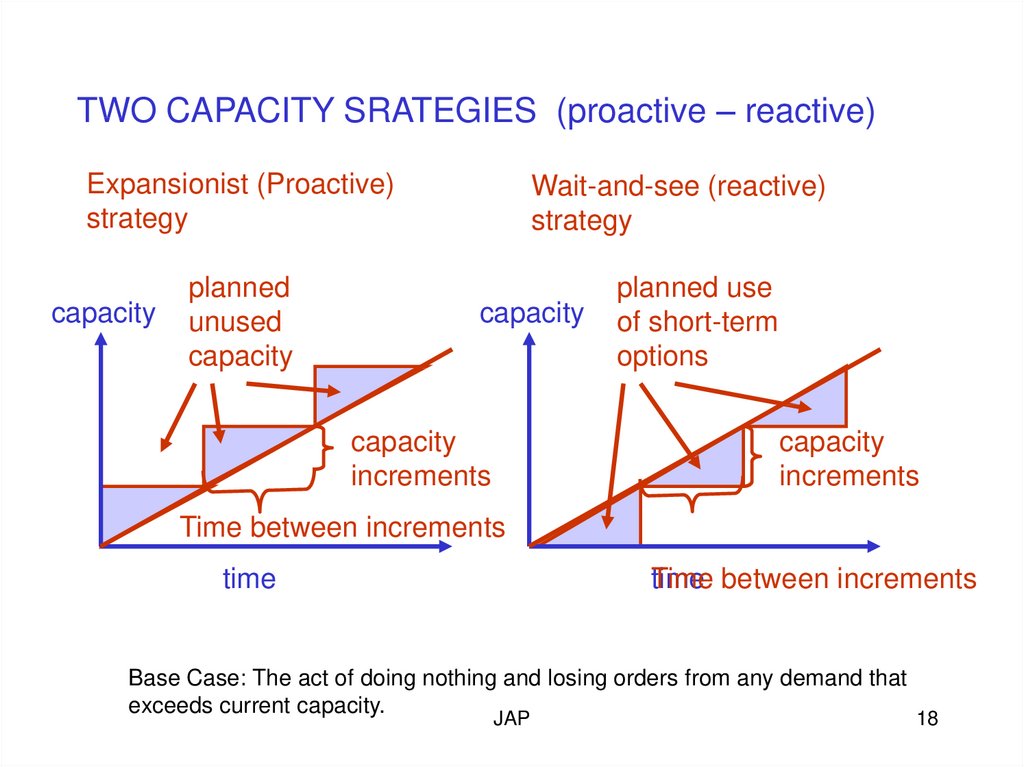
18.
TWO CAPACITY SRATEGIES (proactive – reactive)Expansionist (Proactive)
strategy
capacity
planned
unused
capacity
Wait-and-see (reactive)
strategy
capacity
capacity
increments
planned use
of short-term
options
capacity
increments
Time between increments
time
time between increments
Time
Base Case: The act of doing nothing and losing orders from any demand that
exceeds current capacity.
JAP
18
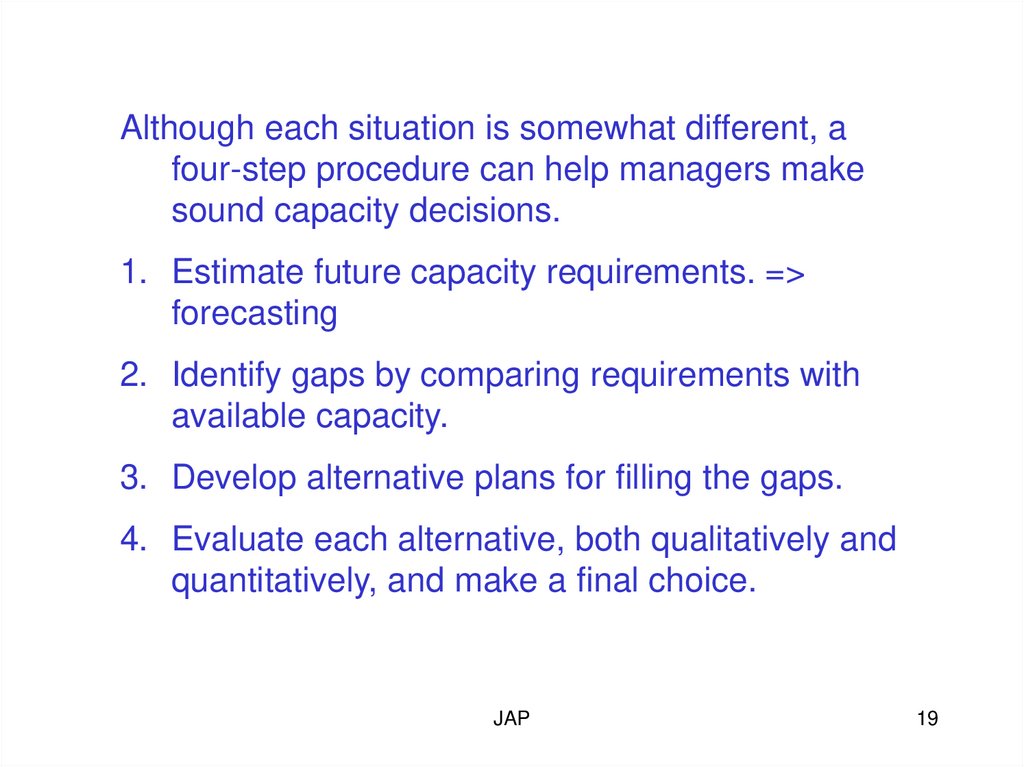
19.
Although each situation is somewhat different, afour-step procedure can help managers make
sound capacity decisions.
1. Estimate future capacity requirements. =>
forecasting
2. Identify gaps by comparing requirements with
available capacity.
3. Develop alternative plans for filling the gaps.
4. Evaluate each alternative, both qualitatively and
quantitatively, and make a final choice.
JAP
19
20.
STEP 1. ESTIMATE CAPACITY REQUIREMENTSand setup
NUMBER OF
MACHINES
PROCESSING HOURS REQUIRED / YEAR
=
REQUIRED
HOURS AVAILABLE FROM ONE MACHINE
(M)
PER YEAR AFTER DEDUCTING DESIRED
CUSHION
Sum [D*p+(D/Q)*s]products 1->n
Where
M=
N * ( 1-(C/100))
D = number of units (customer) forecast per year
p=
processing time (in hours per unit or customer)
N = total
number of hours per year during which the process operates C = desired
capacity cushion
Q = number of
units in each lot (lot size)
s = setup time (in
hours) per lot
JAP
20
21.
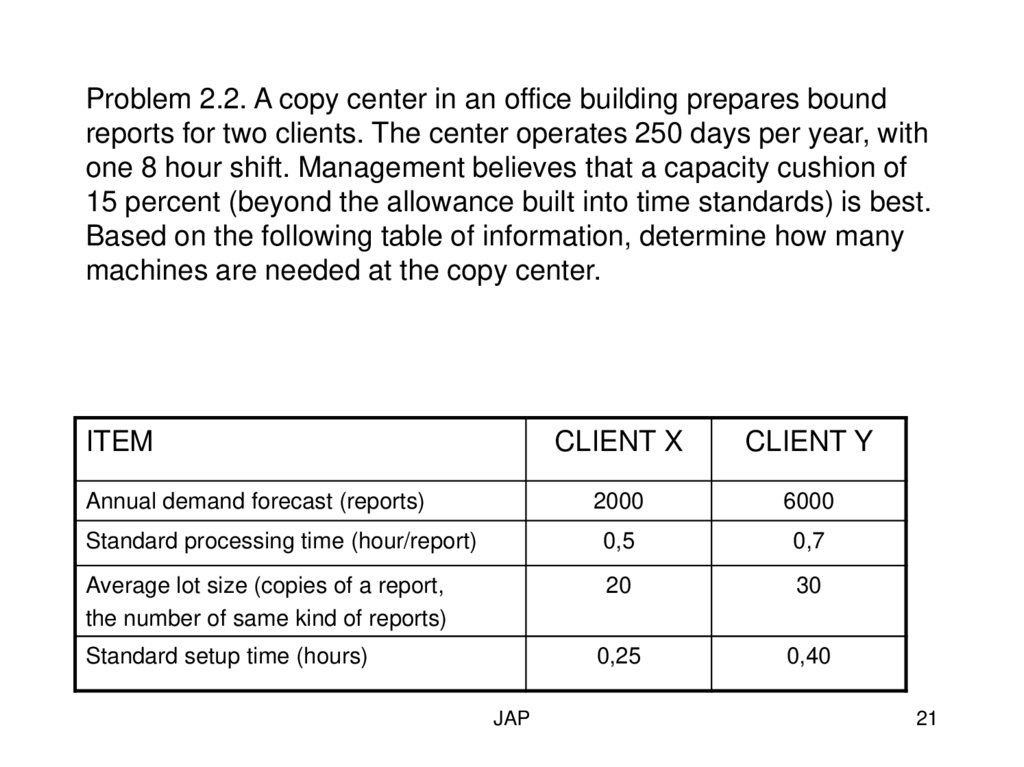
Problem 2.2. A copy center in an office building prepares boundreports for two clients. The center operates 250 days per year, with
one 8 hour shift. Management believes that a capacity cushion of
15 percent (beyond the allowance built into time standards) is best.
Based on the following table of information, determine how many
machines are needed at the copy center.
ITEM
CLIENT X
CLIENT Y
2000
6000
Standard processing time (hour/report)
0,5
0,7
Average lot size (copies of a report,
the number of same kind of reports)
20
30
0,25
0,40
Annual demand forecast (reports)
Standard setup time (hours)
JAP
21
22.
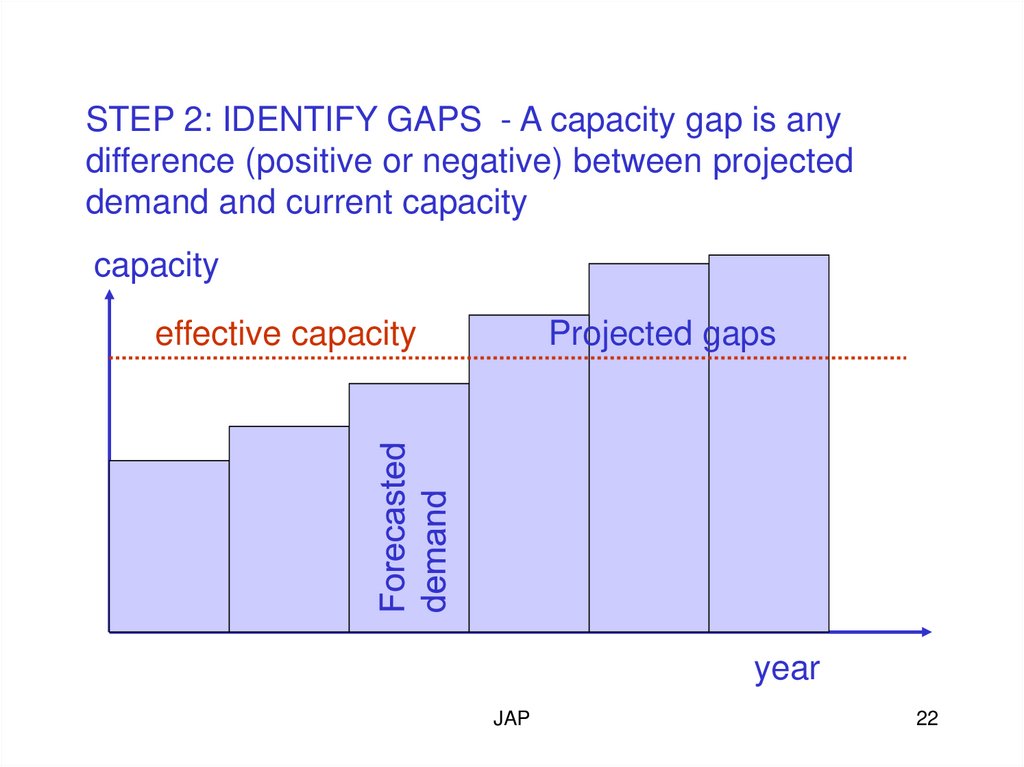
STEP 2: IDENTIFY GAPS - A capacity gap is anydifference (positive or negative) between projected
demand and current capacity
capacity
effective capacity
Projected gaps
year
JAP
22
23.
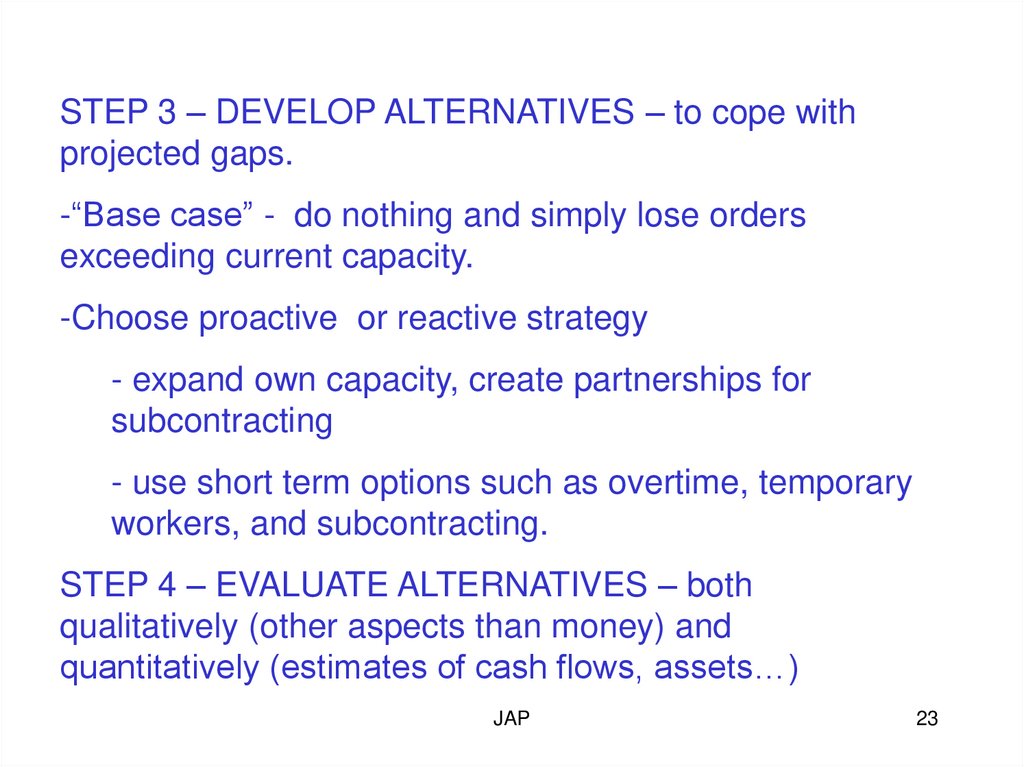
STEP 3 – DEVELOP ALTERNATIVES – to cope withprojected gaps.
-“Base case” - do nothing and simply lose orders
exceeding current capacity.
-Choose proactive or reactive strategy
- expand own capacity, create partnerships for
subcontracting
- use short term options such as overtime, temporary
workers, and subcontracting.
STEP 4 – EVALUATE ALTERNATIVES – both
qualitatively (other aspects than money) and
quantitatively (estimates of cash flows, assets…)
JAP
23
24.
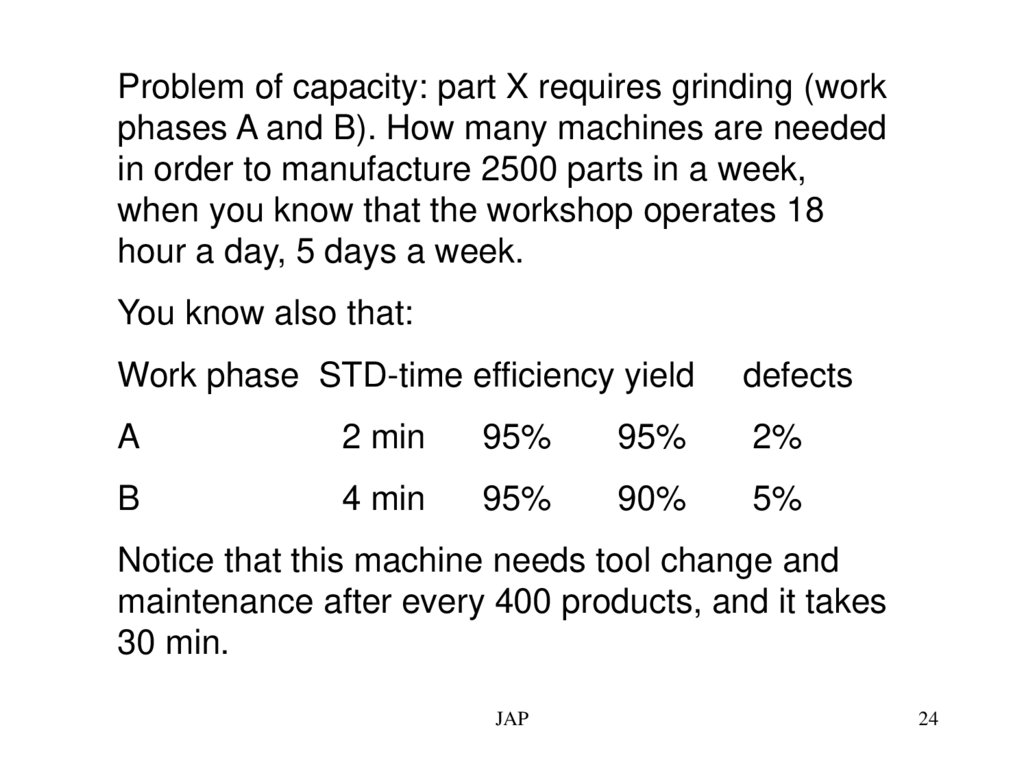
Problem of capacity: part X requires grinding (workphases A and B). How many machines are needed
in order to manufacture 2500 parts in a week,
when you know that the workshop operates 18
hour a day, 5 days a week.
You know also that:
Work phase STD-time efficiency yield
defects
A
2 min
95%
95%
2%
B
4 min
95%
90%
5%
Notice that this machine needs tool change and
maintenance after every 400 products, and it takes
30 min.
JAP
24
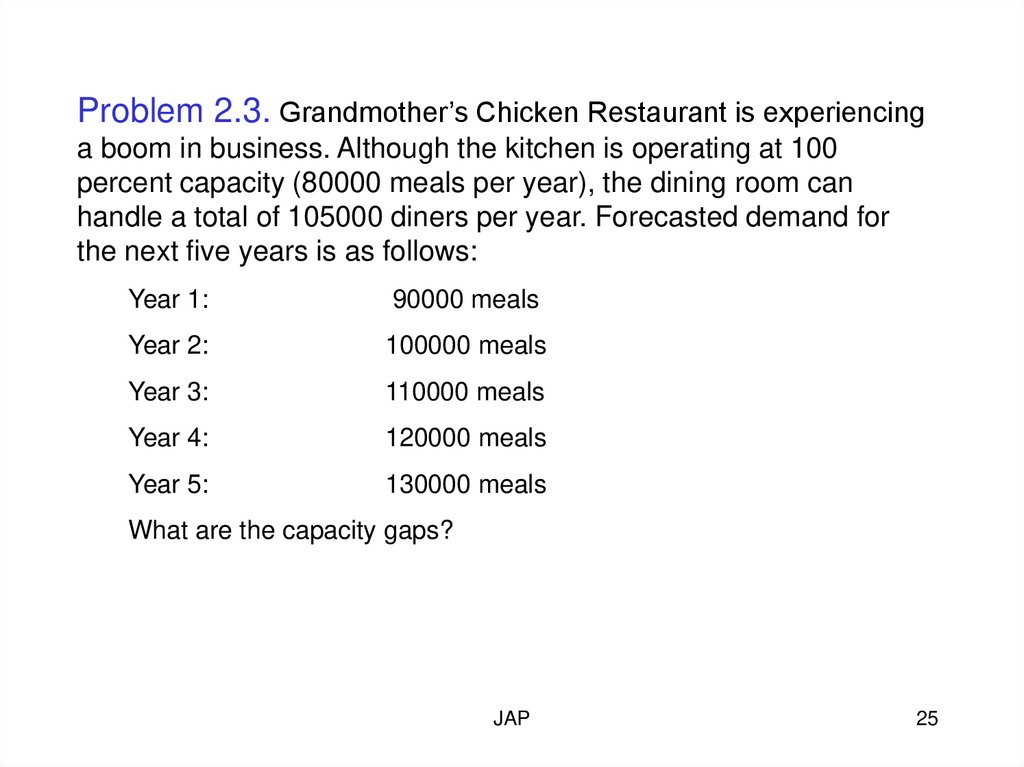
25.
Problem 2.3. Grandmother’s Chicken Restaurant is experiencinga boom in business. Although the kitchen is operating at 100
percent capacity (80000 meals per year), the dining room can
handle a total of 105000 diners per year. Forecasted demand for
the next five years is as follows:
Year 1:
90000 meals
Year 2:
100000 meals
Year 3:
110000 meals
Year 4:
120000 meals
Year 5:
130000 meals
What are the capacity gaps?
JAP
25
26.
Problem 2.4. Evaluating the alternatives:One alternative for Grandmothers kitchen is to expand both the
kitchen and the dining room now, bringing their capacities up to
130000 meals per year. The initial investment would be 200000
€, made at the end of this year (year 0). The average meal is
process at 10 €, and the before tax-profit margin is 20 percent. (6
€ covers variable costs and 2 € goes toward fixed costs. The
remaining 2 € goes to pretax profit.) What are the pretax cash
flows from this project for the next five years compared to those
of the base case doing nothing?
Cash flow is the difference between the flows of funds into and
out of an organization over a period of time, including revenues,
costs and changes is assets and liabilities.
JAP
26
27. TOOLS FOR CAPACITY PLANNING: WAITING LINE MODELS - Because arrival time to a work center and processing time varies, waiting
line models use probabilitydistributions to provide estimates of average customer
delay time, average length of waiting line and utilization
of the work center.
SIMULATION – More complex waiting line problems
must be analyzed with simulation. It can identify
process’s bottlenecks and appropriate capacity
cushions.
DECISION TREES
JAP
27
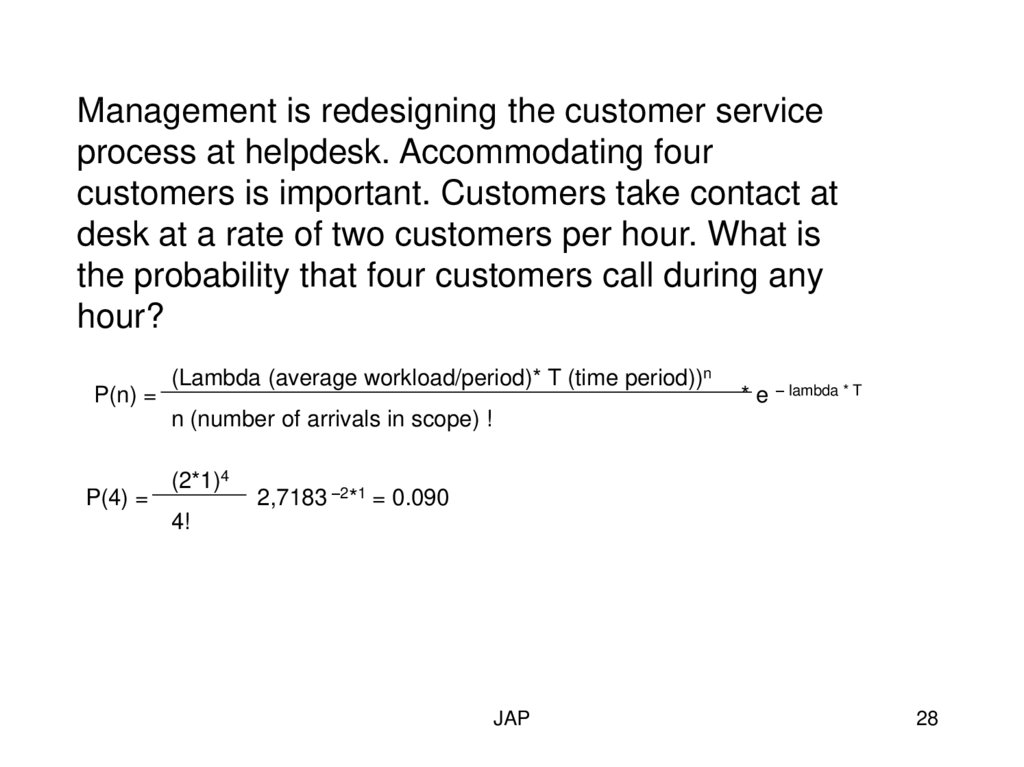
28.
Management is redesigning the customer serviceprocess at helpdesk. Accommodating four
customers is important. Customers take contact at
desk at a rate of two customers per hour. What is
the probability that four customers call during any
hour?
P(n) =
(Lambda (average workload/period)* T (time period))n
*e
– lambda * T
n (number of arrivals in scope) !
P(4) =
(2*1)4
2,7183 –2*1 = 0.090
4!
JAP
28
29.
Problem 2.5. Finding break even quantityA machine job is considering to start with a new
product of their own offered at 200 € per product. The
fixed costs per year are about 100000 € and variable
costs about 100 € per product. What is the break
even quantity for this product. Use both algebraic and
graphic approaches to get the answer.
2.6. Then proceed with Sensitivity Analysis by testing
different changes for each factor of the new product.
JAP
29
30. Decision is a schematic model of alternatives available to the decision maker, along with their possible consequences
Expected payoff 1Event
node
Expected payoff 2
Expected payoff 3
Expected payoff 4
1.
Decision
Possible 2.
decision
Expected payoff 5
Expected payoff 6
Event
node
Expected payoff 7
JAP
Expected payoff 8
30
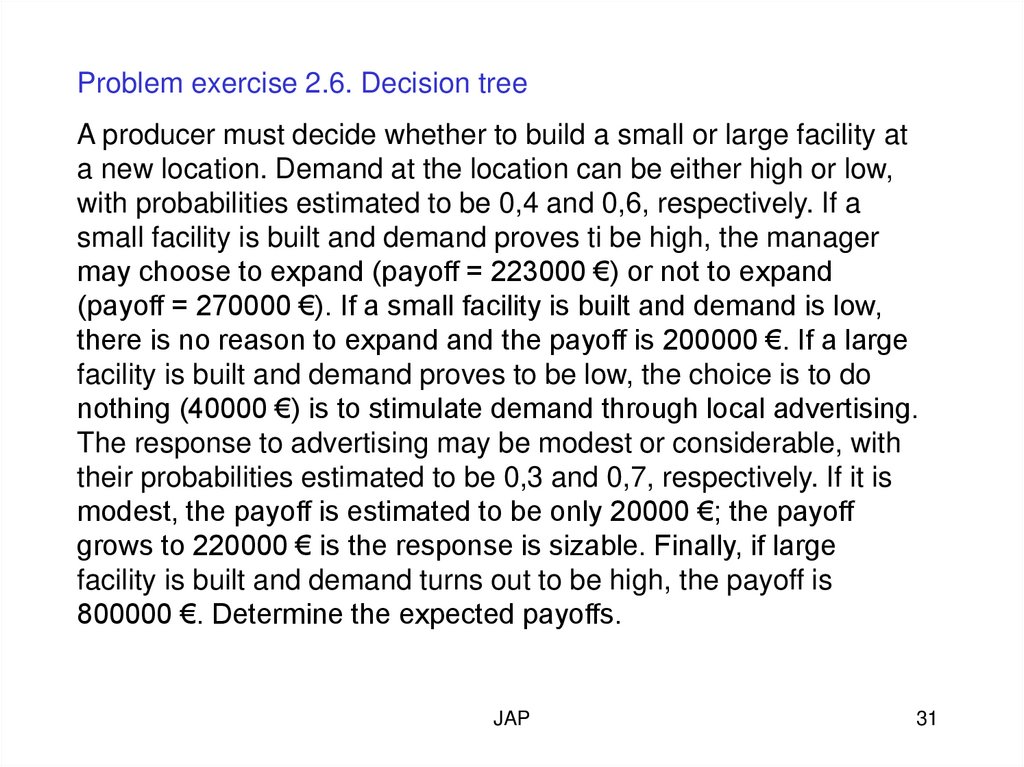
31.
Problem exercise 2.6. Decision treeA producer must decide whether to build a small or large facility at
a new location. Demand at the location can be either high or low,
with probabilities estimated to be 0,4 and 0,6, respectively. If a
small facility is built and demand proves ti be high, the manager
may choose to expand (payoff = 223000 €) or not to expand
(payoff = 270000 €). If a small facility is built and demand is low,
there is no reason to expand and the payoff is 200000 €. If a large
facility is built and demand proves to be low, the choice is to do
nothing (40000 €) is to stimulate demand through local advertising.
The response to advertising may be modest or considerable, with
their probabilities estimated to be 0,3 and 0,7, respectively. If it is
modest, the payoff is estimated to be only 20000 €; the payoff
grows to 220000 € is the response is sizable. Finally, if large
facility is built and demand turns out to be high, the payoff is
800000 €. Determine the expected payoffs.
JAP
31
32.
2.7 A machine job is considering to start with anew product of their own offered at 200 € per
product. The fixed costs per year are about
100000 € and variable costs about 100 € per
product.
What is the break even quantity for this product?
Use both algebraic and graphic approaches to get
the answer.
JAP
32