


")


Behavioural Finance.")


 Экономика
Похожие презентации:


The Stock Market, the Theory of Rational Expectations, and the Efficient Markets Hypothesis
1.
The Stock Market, the Theory of RationalExpectations, and the Efficient Markets
Hypothesis
Extra Material-(Narrated Power Point
http://highered.mcgrawhill.com/sites/0072946733/student_view0/chapter7/narrated_powerpoint_presentation.
html
http://www.karlwhelan.com/Teaching/International%20Monetary/part12.pdf
Article on stock valuation
http://www.gurufocus.com/stock-market-valuations.php
On analysis of stock market
http://education.wallstreetsurvivor.com/Stock-Market-Forecast-2010-Q1
© 2008 Pearson Education Canada
7.1
2.
Ch 7: Stock Markets and Efficient Market Hypothesis. (*)Topics:
1. The price of common stock;
2. The Generalized Dividend Model and the Gordon Growth Model;
3. The theory of Rational Expectations and its applications in financial markets
(Efficient Market Hypothesis);
4. Empirical evidence on the Efficient Market Hypothesis.
Learning Objective.
To understand how stocks are valued and to examine the Efficient Market
Hypothesis.
Equities/Stocks, like bonds as financial, are one of the key assets in the
personal wealth portfolio of individuals, as well as one of the several ways of
obtaining external finance for productive organizations. This chapter discusses
the fundamental theories that help us in computing the price of the stock, and in
explaining what forces cause prices to vary over time, including the important
role of expectations in influencing the expected returns on equities.
© 2008 Pearson Education Canada
7.2
3.
The Markets for Stocks. (*)In Canada, stocks are traded in two types of markets: organized stock exchanges(like
Toronto Stock exchange) and over-the-counter(OTC) markets.
Stock Exchanges are organized markets where trading takes place in a central facility,
either electronically through a broker or by open bidding. The Toronto Stock Exchange
(TSE) is the largest stock exchange in Canada. Equities are traded in Toronto while
derivative products are traded in the Montreal stock exchange.
Aggregate Stock Indexes
The aggregate movement of individual stocks is measured by stock indexes. The most
famous stock index is the Dow Jones Industrial Average, which currently contains thirty
large firms. The S&P (Standard and Poor’s) 500 Stock Index contains five hundred
stocks and is a value-weighted price index. It is considered the benchmark index for
large stocks traded and contains about 80 percent of the value of all U.S. stocks. The
Nasdaq index is also value-weighted and is heavily influenced by the large technology
stocks that trade on the NASDAQ market.
Toronto Stock Exchange 300 (TSE300), which was an index of 300 stocks traded at
the Toronto Stock Exchange. Recently, TSE300 has been replaced by the S&P
(Standard and Poor’s)/TSX composite index.
© 2008 Pearson Education Canada
7.3
4. Common Stock
• Common stock is the principal way thatcorporations raise equity capital.
• Stockholders have the right to vote and be the
residual claimants of all funds flowing to the
firm.
• Dividends are payments made periodically,
usually every quarter, to stockholders.
© 2008 Pearson Education Canada
7.4
5. Several Kinds of “Value”
• There are several types of value, of which we are concernedwith four:
– Book Value – The carrying value on the balance sheet of the firm’s
equity (Total Assets less Total Liabilities)
– Tangible Book Value – Book value minus intangible assets (goodwill,
patents, etc)
– Market Value - The price of an asset as determined in a competitive
marketplace
– Intrinsic Value - The present value of the expected future cash flows
discounted at the decision maker’s required rate of return
6. 9.1 Reading Stock Listings
• The following newspaper stock listing isusually printed as a horizontal string of
information
• The listing is for IBM, which is traded on the
New York Stock Exchange
rentice Hall
6
7. Reading Stock Listings
rentice HallReading Stock Listings
Yr Hi
Yr Lo
123 1/8 93 1/8
Stock
IBM
Sym
IBM
Div
4.84
Yld %
4.2
PE
16
Vol 100
14591
Day Hi
Day Lo Close
115
113
Net Chg
114 3/4 +1 3/8
7
8. Reading Stock Listings
rentice HallReading Stock Listings
– Hi = 123 1/8: The highest price the stock has
traded at over the last 52 weeks
– Lo = 93 1/8: The lowest price the stock has traded
at over the last 52 weeks
– Stock = IBM: The stock’s name
– Sym = IBM: The stock’s symbol
8
9. Reading Stock Listings
rentice HallReading Stock Listings
– Div = 4.84: The last quarterly dividend multiplied
by 4
– Yld % = 4.2: Dividend yield; (Annualized dividend
÷ stock price)
– PE = 16: Price-to-earnings; (Latest price ÷ last 4
actual dividends)
– Vol 100s = 14591*100; Volume of exchange
traded shares
9
10. Reading Stock Listings
rentice HallReading Stock Listings
– Hi = 115: Highest share price of the day
– Lo = 113: Lowest share price of the day
– Close = 114 3/4: Days closing share price
– Chg = 1 3/8: Change in closing price from previous
trading day
10
11.
The price of common stock. (*)Common stocks have two sources of future returns: future cash flows of
dividends(which are periodic-like quarterly- payments) and the sale price of the
stock when it is sold (yielding capital gain). Common stocks, compared to bond
and other assets, carry greater risk of fluctuations in returns, and, therefore,
must potentially pay a greater rate of return to induce investors to buy the
stocks. This is referred to as the required rate of return (discussed below).
The equity valuation model, discussed below, relates the present stock price to
the present value of its future cash flows(dividends and capital gains) in the
same way that a bond is priced in terms of its future cash flows(coupon
payments).
© 2008 Pearson Education Canada
7.11
12. Equation Total Return
Copyright © 2007 Pearson Addison-Wesley.All rights reserved.
9-12
13. Rate of Total Return
ion CanadaRate of Total Return
Dividend Yield Capital Gain Yield
Dividend
100% Selling Price - Purchase Price 100%
Original Price
10-13
14. One-Period Valuation Model
Div1P1
P0
(1 ke ) (1 ke )
P0 = the current price of the stock
Div1 = the dividend paid at the end of year 1
ke = the required return on investment in equity
P1 = the sale price of the stock at the end of the first period
© 2008 Pearson Education Canada
7.14
15. Generalized Dividend Valuation Model
The value of stock today is the present value of all future cash flowsP0
Dn
Pn
D1
D2
...
(1 ke )1 (1 ke ) 2
(1 ke ) n (1 ke ) n
If Pn is far in the future, it will not affect P0
Dt
P0
t
t 1 (1 ke )
The price of the stock is determined only by the present value of
the future dividend stream
© 2008 Pearson Education Canada
7.15
16. Gordon Growth Model
D0 (1 g)D1
P0
(ke g) (ke g)
D0 = the most recent dividend paid
g = the expected constant growth rate in dividends
ke = the required return on an investment in equity
Dividends are assumed to continue growing at a constant rate forever
The growth rate is assumed to be less than the required return on equity
© 2008 Pearson Education Canada
7.16
17.
According to the above model, current stock prices depend onthree factors: (a)current dividends, (b) expected growth rate of
dividends, and (iii) the required return on equity, which in turn is
the sum of two components: available alternative risk free return,
and the riskiness of the stock.
This approach is also termed as the fundamentalist approach,
which argues that fundamentals, such as the flow of anticipated
dividends of a company, determine the price of its stocks.
© 2008 Pearson Education Canada
7.17
18. Example 9.1 Stock Prices and Returns
Copyright © 2007 Pearson Addison-Wesley.All rights reserved.
9-18
19. Example 9.1 Stock Prices and Returns
Copyright © 2007 Pearson Addison-Wesley.All rights reserved.
9-19
20. Example Valuing a Firm with Constant Dividend Growth
Copyright © 2007 Pearson Addison-Wesley.All rights reserved.
9-20
21. Example 9.2 Valuing a Firm with Constant Dividend Growth
Copyright © 2007 Pearson Addison-Wesley.All rights reserved.
9-21
22. Factors Affecting Stock Prices
ion Canada
Business cycles
Interest rate changes
Investor sentiment about
– Economy,
– Earnings
– And markets
10-22
23.
• interest rate = risk free rate +risk premium, ke = rf + rp
• then
D0
P
rf rp g
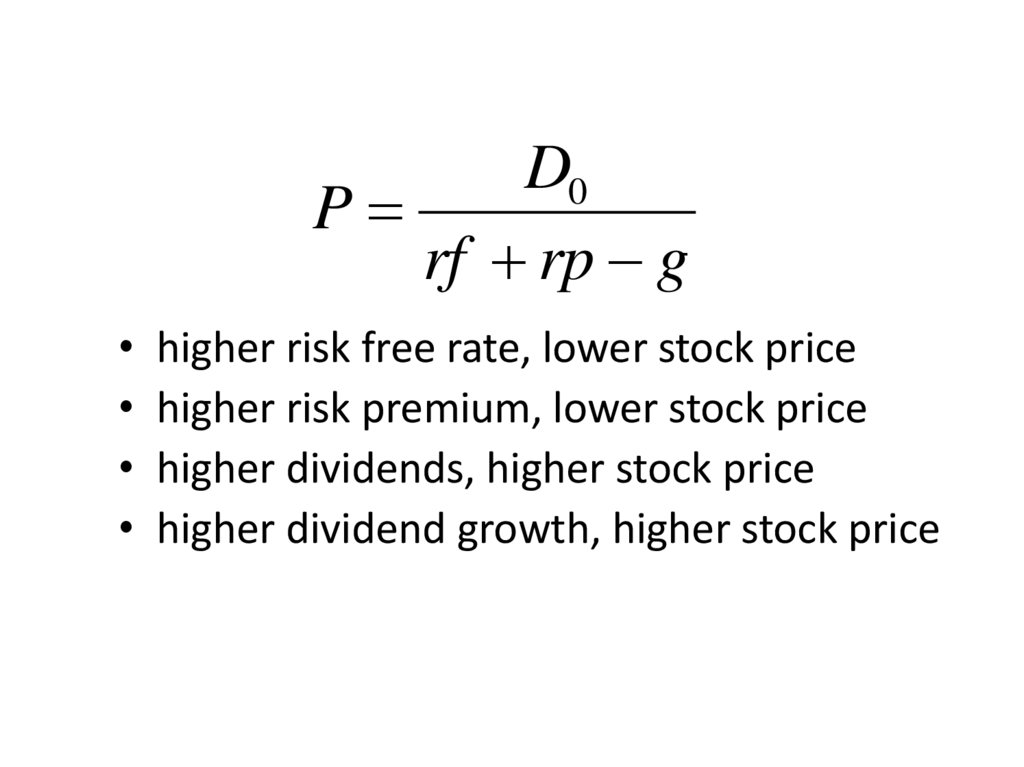
24.
D0P
rf rp g
higher risk free rate, lower stock price
higher risk premium, lower stock price
higher dividends, higher stock price
higher dividend growth, higher stock price
25. example
• D = $2, g = 2%, rf = 3%, rp = 5%• P= $2/(.03+.05-.02)
• P = $2/.06 = $33.33
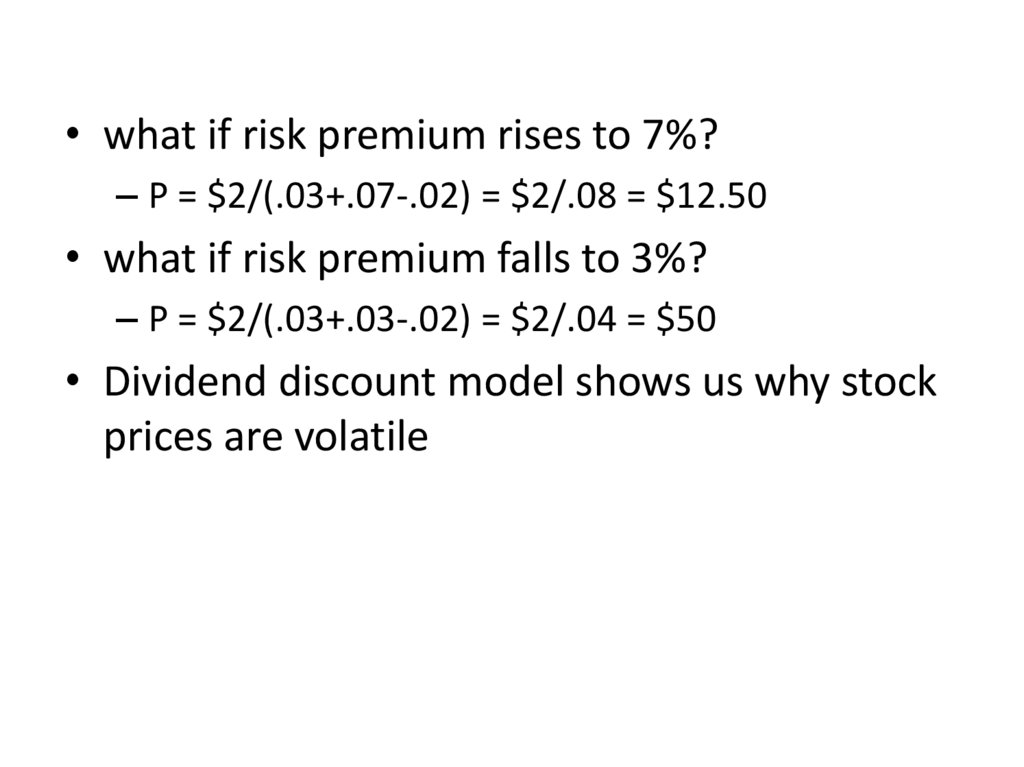
26.
• what if risk premium rises to 7%?– P = $2/(.03+.07-.02) = $2/.08 = $12.50
• what if risk premium falls to 3%?
– P = $2/(.03+.03-.02) = $2/.04 = $50
• Dividend discount model shows us why stock
prices are volatile
27.
Gordon Model- Applications.The effect of monetary policy.
The Gordon’s growth model can explain the effect of monetary policy on the stock’s price(intrinsic
value). It may be noted that monetary Policy affects the stock prices in two ways: (i) through
changes in the required return rate, KReq, (through changing rf , return on risk free securities) and
(ii)through influencing g. First, when bond returns decline( that is lower interest rates), investors in
the stock market investors are willing to accept lower equity returns, which means higher P0.
Second, when interest rates are reduced, economy expands(through increase in aggregate
demand), profitability and dividends increase, resulting in higher, stock prices, P0.
Economic conditions, uncertainties and Financial markets crisis.
When the economy enters a recessionary phase, stock prices start falling, predicated on the fear
that the companies’ profits would be adversely affected during economic slowdown. The falling
stock prices, during recessionary conditions( as evidenced in 2009 stock markets crash) and
associated economic uncertainties, can be explained by rising KReq (through larger risk premium
component, rp, required to induce investors to invest in securities). Thus, in a bear market, the KReq
will be higher than in a bull market.
The growth prospects of the economy in general and of companies in particular(reflected in g)
would have effect on the stock price movements.
© 2008 Pearson Education Canada
7.27
28.
Price-Earnings Ratio: The price/earnings ratio, which equals to thecompany’s net income divided by its earnings per share, is a widely
popular ratio reported for stocks. Earnings per share (EPS) is
calculated to be equal to the company’s net income minus the
dividends paid to preferred stockholders and divided by the number
of common shares outstanding.
A higher P/E ratio, usually, reflects a higher expectation of future company’s
growth potential, while a relatively low P/E ratio reflects that there is less
potential for rapid growth of the company.
The factors that contribute to an increase in P/E ratio of a company may
include, higher earnings growth rate of the company and higher
than expected dividend amount announced by the company etc.
© 2008 Pearson Education Canada
7.28
29. Price Earnings Valuation Method (Cont’d)
The PE ratio can be used to estimate the
value of a firm’s stock.
The product of the PE ratio times the
expected earnings is the firm’s stock price.
(P/E) x E = P
© 2008 Pearson Education Canada
7.29
30. Stock Analysis
Fundamental analysis
– Quantitative analysis
Based on financial statements
– Qualitative analysis
ion Canada
More subjective
Examines management skill
Technical analysis
– Examines past performance
Of firm and market
10-30
31.
How the Market sets Stock Prices.(a)Theory of Rational Expectations in Financial Markets
( Efficient Market Hypothesis).
(b) Behavioural Finance
(a)The theory of Rational Expectations and its applications
in financial markets (Efficient Market Hypothesis).
Forecasting future stock prices
As the value of a share of stock is dependent on the expected future
income from that stock, it is essential to understand how people
form expectations in the market.
One well known mechanism, explaining how do people form
expectations about future behavior of economic variables, like stock
prices is known as the Rational Expectations model.
© 2008 Pearson Education Canada
7.31
32.
Rational ExpectationsRational expectations theory views expectations as being identical to
the best guess of the future (the optimal forecast) that uses all available
Xe = Xof
If we applying the Rational expectations Hypothesis in calculating a Stock's
Intrinsic Value , it can be shown that stock prices should equal a discounted
present-value sum of expected future dividends, is usually known as
the dividend-discount model.
That is, the prices in a financial market will be set so that the optimal forecast
of a security’s return using all available information equals the security’s
equilibrium return. The theory of Rational expectations, thus, assumes that
outcomes that are being forecasted do not differ systematically from the
market equilibrium results .
Random Walk
The theory of rational expectations says that the actual price will only deviate from
the expectation if there is an 'information shock' caused by information unforeseeable at
the time expectations were formed. Thus, changes in stock prices follow a random walk.
The term random walk describes a movement of a variable whose future value can
not be predicted on the basis of the today`s values.
© 2008 Pearson Education Canada
7.32
33.
The Efficient MarketThe efficient-market hypothesis (EMH) asserts that financial markets are
"informationally efficient", or that prices on traded assets (e.g.,stocks,
bonds, or property) already reflect all available information.
This framework seeks to explain the random walk hypothesis by positing that only new
information will move stock prices significantly, and since new information is presently
unknown and occurs at random, future movements in stock prices are also unknown
and, thus, move randomly.
Therefore, according to theory, it is impossible to consistently outperform the market by
using any information that the market already has.
In strong-form efficiency, share prices reflect all information, public and private, and
no one can earn excess returns.
The efficient-market hypothesis requires that agents have rational expectations; that on
average the population is correct (even if no one person is) and whenever new relevant
information appears, the agents update their expectations appropriately.
34. Implications of the Theory of Rational Expectations
Even though a rational expectation equals the optimalforecast using all available information, a prediction based
on it may not always be perfectly accurate
– It takes too much effort to make the expectation the best
guess possible.
– Best guess will not be accurate because predictor is unaware
of some relevant information.
© 2008 Pearson Education Canada
7.34
35. Implications
• If there is a change in the way a variablemoves, the way in which expectations
of the variable are formed will change
as well.
• The forecast errors of expectations will, on
average, be zero and cannot be predicted
ahead of time.
© 2008 Pearson Education Canada
7.35
36. Efficient Markets: An Application of Rational Expectations
RecallThe rate of return from holding a security equals the sum of the capital
gain on the security, plus any cash payments divided by the
initial purchase price of the security.
Pt 1 Pt C
R
Pt
R = the rate of return on the security
Pt 1 = price of the security at time t + 1, the end of the holding period
Pt = price of the security at time t , the beginning of the holding period
C = cash payment (coupon or dividend) made during the holding period
© 2008 Pearson Education Canada
7.36
37. Implications of the EMH for the stock market: Investing in the Stock Market:
• Recommendations from investment advisorscannot help us outperform the market.
• A hot tip is probably information already
contained in the price of the stock.
• Stock prices respond to announcements only
when the information is new and unexpected.
• A “buy and hold” strategy is the most sensible
strategy for the small investor.
© 2008 Pearson Education Canada
7.37
38. Evidence Against Market Efficiency
Small-firm effect
January Effect
Market Overreaction
Excessive Volatility
Mean Reversion
New information is not always immediately
incorporated into
stock prices
• Chaos and fractals
© 2008 Pearson Education Canada
7.38
39. (b)Behavioural Finance.
• The lack of short selling (causingover-priced stocks) may be explained by loss
aversion.
• The large trading volume may be explained by
investor overconfidence.
• Stock market bubbles may be explained by
overconfidence and social contagion.
© 2008 Pearson Education Canada
7.39
40.
(b) Behavioural Finance.Behavioral economists attribute the imperfections in financial markets
to a combination of cognitive biases such as overconfidence,
overreaction, representative bias, information bias, and various other
predictable human errors in reasoning and information processing.
Empirical evidence has been mixed, but has generally not supported
strong forms of the efficient-market hypothesis.
Speculative economic bubbles are an obvious anomaly, in that the market
often appears to be driven by buyers operating on irrational exuberance,
who take little notice of underlying value. These bubbles are typically
followed by an overreaction of frantic selling, allowing shrewd investors to buy
stocks at bargain prices.
41.
• Bubbles– Large gaps between actual asset price and
fundamental value
– Internet stock bubble of late 1990s
– Housing bubble?
• Eventually the bubble bursts!
42. In the Generalized Dividend Valuation Model equation:
P0n
t 1
i.
Dt
1
ke
t
Pne
1
ke
n
“Fundamentals”:
n
Dt
1 k
t 1
ii.
Dn
Pn e
(1 ke ) n
(1 ke ) n
D1
D2
1
(1 ke )
(1 ke ) 2
e
t
D1
D2
1
2
(1 ke ) (1 ke )
Pn e
(1 ke ) n
“Bubble”:
wi
Dn
(1 ke )n
43. Implications of efficiency evidence
• very difficult for average person to beat themarket
– trying to do so generates trading costs
• the alternative
– buy-and-hold diversified portfolio
– indexing
44. conclusion
• stock market price behavior combines– fundamentals
– investor psychology
• markets are not perfectly efficient
– field of behavioral economics, finance
On rational Expectations
http://www.tcd.ie/Economics/staff/whelanka/topic4.pdf
Stocks Valuation
http://www.gurufocus.com/stock-market-valuations.php
Stock Dividend Model
http://thismatter.com/money/stocks/valuation/dividend-discount-model.htm