


")
")
 --The 1996 Health Meeting of China’s Central Gov.")


. Infant mortality rate(IMR). Crude death rate(CDR). Life expectancy(LE)")


")


")


 Медицина
Похожие презентации:


")


The Health Care System and Public Health in China
1. The Health Care System and Public Health in China
Jesse Huang MB MHPE MPH MBAAssistant President and Dean for Continuing Education
Professor of Epidemiology
Chinese Academy of Medical Sciences
Peking Union Medical College
Email:pumcjesse@yahoo.com.cn
Tel: 6529-5986 13910822961
2.
I will discuss…• China’s Health Care System
• Public Health in China
3.
China and its Health Care System• Basic Statistics/Economic status
• System overview
• Who pay for health services?
• Government’s health policies
4. China:Basic Statistics
• Area: 9.6 million km2• Total population: 1.27 billion (2000)
• Population in rural areas: 63.8
• Administrative Region: 31 provinces
• GDP: 8,940.4 billion RMB
• Number of health agencies: 330 thousand
• Number of health workers: 5.568 million
• Number of school of public health: 36
•Source : China statistical year book,2001
5. Economic Status by Province, 1999
Source : China statistical year book,20006. Health Care System
The organization structure of Chinese health Care systemState Department
The Ministry of
Health
Chinese Academy of Medical Science
Chinese Academy of Preventive
Medicine
Medical Colleges and Universities
Drug and Bioengineering Product
Research
Institute
General
and
Specialized hospital
Health Care System
Government of
Provincial,
Municipal,
Autonomous Region
Regional Administrative
Office
Government of Municipal,
County, District
Township government,
Subdistrict Office
Villagers’ committee,
Neighborhood
residents’ committee
Prov Dept of
Health
Local Dept.of Health
District department
of Health
Three tiered
prevention and
health care
system
Epidemic Prevention Station
Maternity and Children Health Care
Hospital (Clinic)
Drug Inspection Station
General and Specialized hospital
Epidemic Prevention Station
Maternity and Children Health Care
Hospital (Clinic)
Drug Inspection Station
Municipal (District) hospital, County
hospital, Epidemic Prevention Station,
Endemic Disease Prevention Station
Maternity and Children Health Care
Hospital (Clinic), Secondary Health School
Township hospital (clinic), District
hospital
Outpatient clinic
Village health station, Red Cross
health station
7. Health Network of Three Tiered in Rural Area
County HospitalAgencies: 2008
Workers:487684
County Epidemic
Prevention Station
Agencies: 1657
Workers:87468
Township hospital(Clinic)
Agencies: 47928
Workers:1163700
Township hospitals
Agencies:693518
Workers:1282310
County Maternity and
Child Health Hospital
Agencies: 1387
Workers:49313
8. China Health Information System
Ministry of Health, P.R.ChinaCenter of Information of
MOH
China CDC
Institute of Medical
Information, CAMS
Other
Health Project
Univ.directly under MOH
Provincial Dept of Health
Facilities of
Diseases
Control
and
Health
Supervision
at all levels
Local Health Dept
Health Units
Local Health Dept
Prevention
Medicine
Education
Research,
and
Execution
Facilities
Research Institutions
of Medical Science
Medical Colleges
9. Who pay for health services ?
• 1949-1977 free health services for the entireurban population, government pay system
• 1978-1996 government & hospital paid health
services
• 1996-now government, collective &
individual paid health services
10.
The Medical Expenditure Per CapitalOutpatient (Unit: RMB)
Contain
Average medical
expenditure to per
person-time
The cost of drug
Absolute
number
proportion
The cost of Treatment
and examination
Absolute
number
The
range of
increase
(%)
proportion
1990
10.9
7.4
67.9
2.1
19.3
12.4
1995
39.9
25.6
64.2
9.1
22.8
33.8
1997
61.6
37.8
61.4
9.7
15.7
17.4
1999
79.0
47.4
59.5
14.4
18.2
14.8
2000
85.8
50.3
58.6
16.8
19.6
8.6
11.
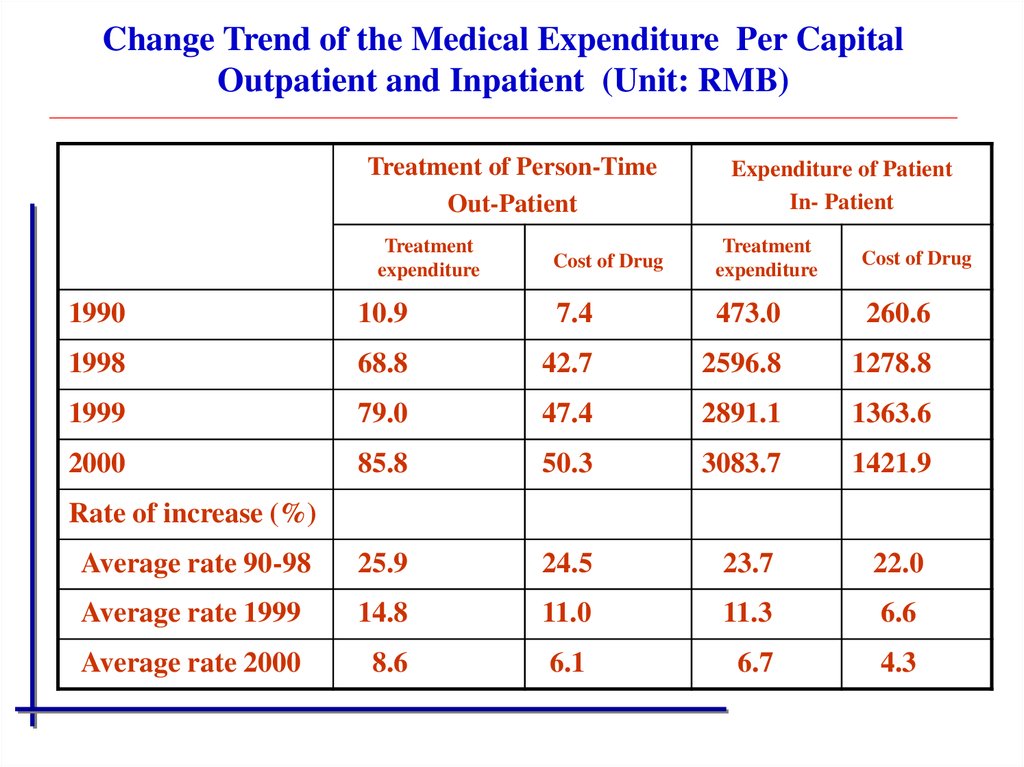
Change Trend of the Medical Expenditure Per CapitalOutpatient and Inpatient (Unit: RMB)
Treatment of Person-Time
Out-Patient
Treatment
expenditure
Expenditure of Patient
In- Patient
Cost of Drug
Treatment
expenditure
Cost of Drug
1990
10.9
7.4
473.0
260.6
1998
68.8
42.7
2596.8
1278.8
1999
79.0
47.4
2891.1
1363.6
2000
85.8
50.3
3083.7
1421.9
Average rate 90-98
25.9
24.5
23.7
22.0
Average rate 1999
14.8
11.0
11.3
6.6
Average rate 2000
8.6
6.1
6.7
4.3
Rate of increase (%)
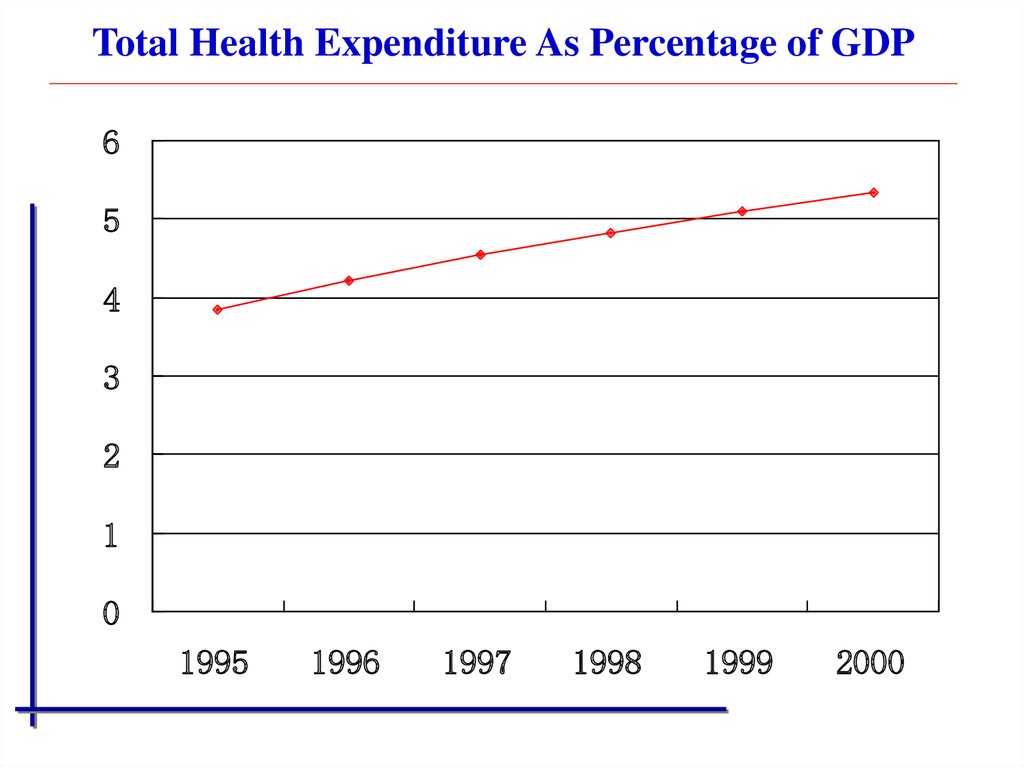
12. Total Health Expenditure 1995-2000 Unit:RMB
Index1.Total health expenditure 100 000 000
卫生总费用
The budgetary health expenditure by Gov.(%)
政府预算支出
Health expenditure by society %
社会卫生支出
Health expenditure by individual %
个人卫生支出
2.The total health expenditure by per capita
人均卫生总费用
3。The percentage to GDP by health expenditure(%)
卫生总费用占GDP%
4。GDP(100 000 000)
国内生产总值
The absolute value of the national
total health expenditure and total
health expenditure per capita
increased in successive years
1995
2257.8
17.0
32.7
50.3
This proportion of GDP showed increasing
trend, but
it is still
lower than
of the
1996
1997
1998
1999that 2000
countries of OECD.
2857.2
3384.9
3776.5
4178.6
4764.0
16.1
29.6
54.3
15.4
15.6
15.3
14.9
27.7
26.6
25.5
24.5
The percentage of the individual
expenditure showed increasing, Gov.
56.9
57.8 expenditure
59.2
60.6
and society
showed
decreasing trend
110.1
143.3
179.7
205.2
245.6
318.1
3.86
4.21
4.55
4.82
5.10
5.33
58478
67885
74463
78345
82068
89404
13. The proportion of the total health expenditure in China1990-1995
6050
The percentage to GDP(%)
40
Government
Society
30
Individual
20
10
0
1990
1991
1992
1993
1994
1995
1998
14.
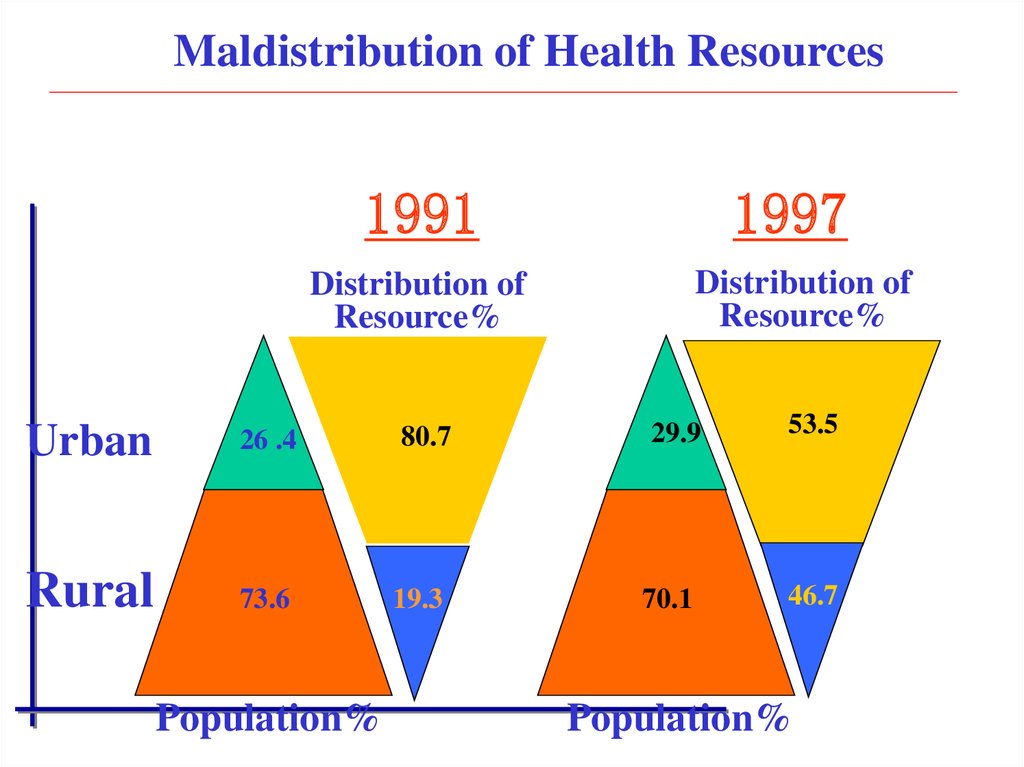
Maldistribution of Health Resources1991
1997
Distribution of
Resource%
Distribution of
Resource%
Urban
26 .4
80.7
29.9
53.5
Rural
73.6
19.3
70.1
46.7
Population%
Population%
15.
Total Health Expenditure As Percentage of GDP6
5
4
3
2
1
0
1995
1996
1997
1998
1999
2000
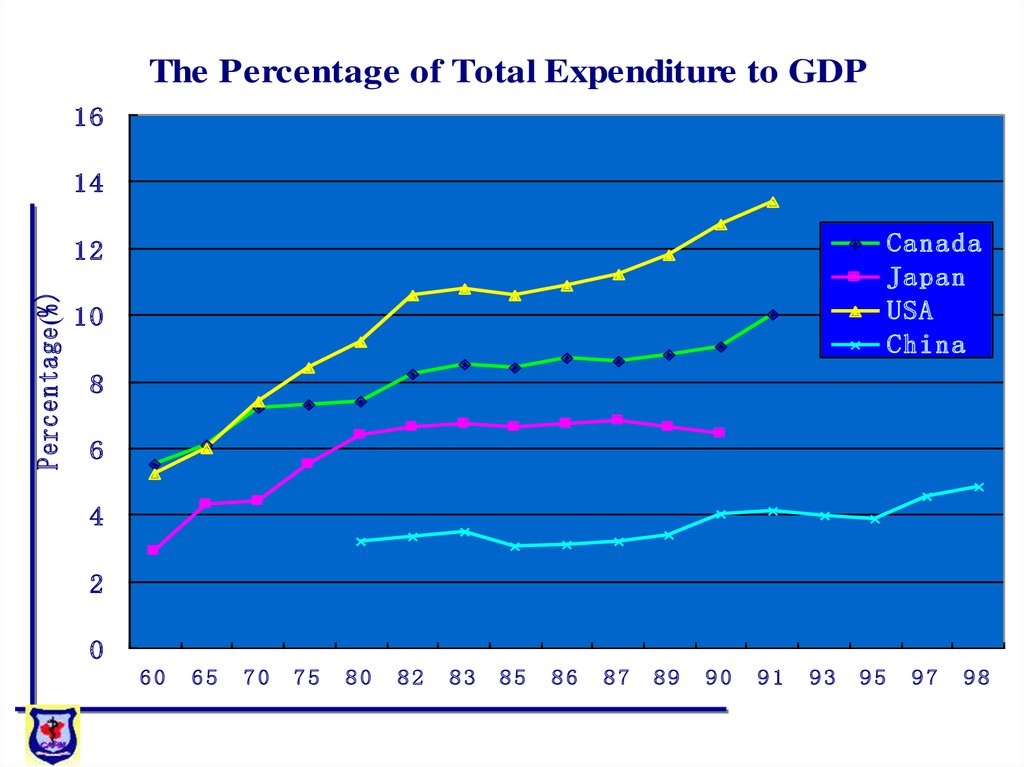
16.
The Percentage of Total Expenditure to GDP16
14
Canada
Japan
USA
China
Percentage (%)
12
10
8
6
4
2
0
60
65
70
75
80
82
83
85
86
87
89
90
91
93
95
97
98
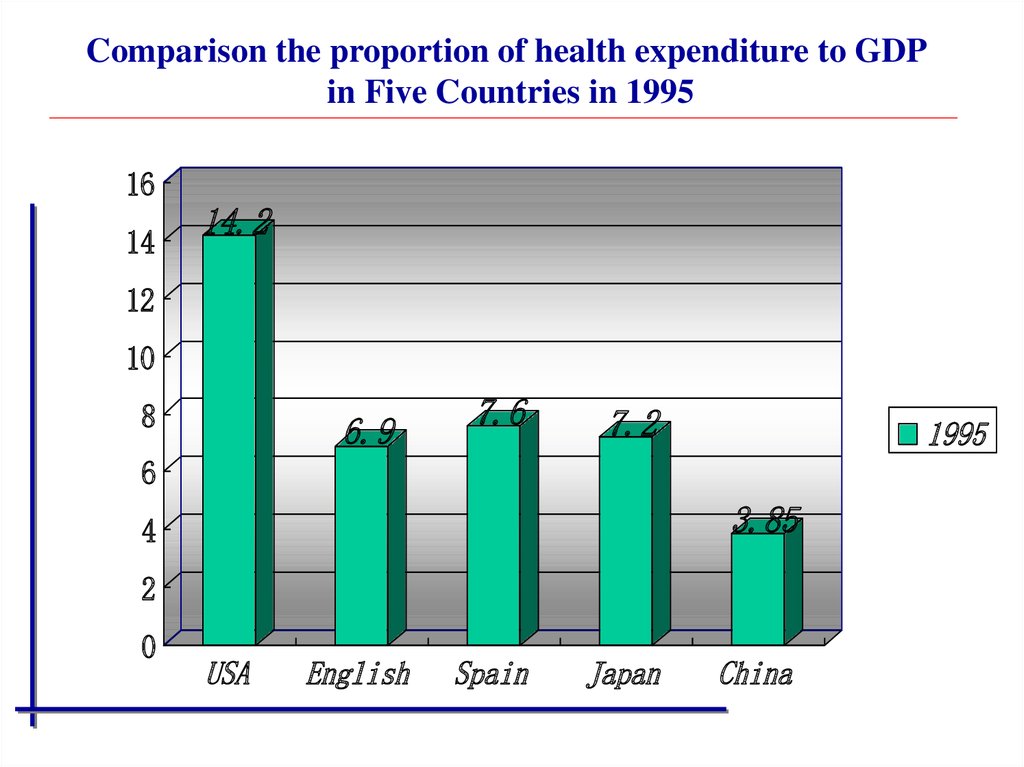
17.
Comparison the proportion of health expenditure to GDPin Five Countries in 1995
16
14
14.2
12
10
8
6.9
7.6
7.2
1995
6
3.85
4
2
0
USA
English
Spain
Japan
China
18. Health Policy in China(1950s)
• Meet health needs of the workers,peasants and soldiers
• Put the prevention first
• Combine the Western and Chinese
Traditional Medicine
• Link the health care work with the mass
movement
19. Health Policy in China(1980s)
Put the prevention first
Rely on the advanced scientific progress
Mobilize the whole society to participate in
Equal emphasis on the Western and
Chinese Traditional Medicine
• Serve for people’s health
20. Health Policy in China(2000s) --The 1996 Health Meeting of China’s Central Gov.
• Emphasize on the health work in the ruralareas
• Put the prevention first
• Equal emphasis on the Western and
Chinese traditional medicine
• Rely on the science and education
• Mobilize the whole society to participate in
21.
Public Health in China• History of Public Health
• Public Health Achievements
• Public Health Challenges
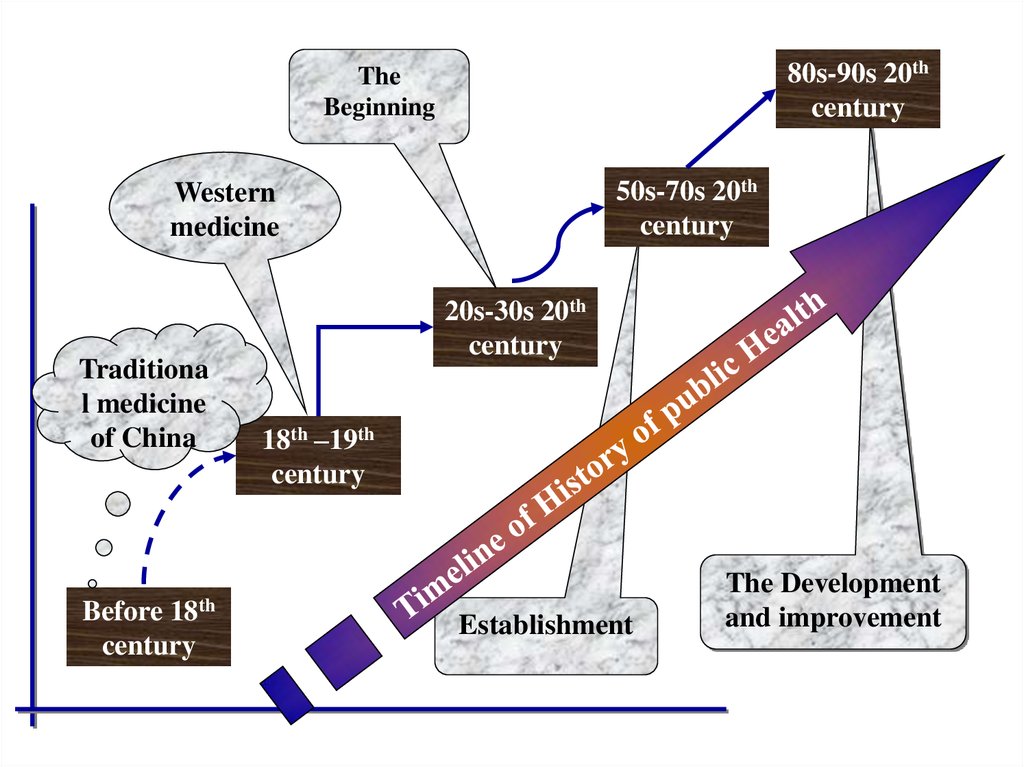
22. Brief History of PH in China
• Before the Eighteenth Century• The Eighteenth –Nineteenth Century
• The 20s-30s of the Twentieth Century
• The 50s-70s of the Twentieth Century
• The 80s-90s of the Twentieth Century
23. Brief History of PH in China --before of the eighteenth century
• The Yellow Emperor’ s Canon Medicine – the earliestand most comprehensive theory of traditional Chinese
medicine The Ancientry philosophy of PH: The best
medical doctor should know how to deal a disease
before it developed
• Disease involves two aspects: pathogen and body
resistance, both should be considered when dealing
with disease prevention.
• Holistic health: regular life, a proper diet, an
appropriate exercise, harmony in mental and emotional
activities
24. Brief History of PH in China -- the 18th –19th century
• Book on epidemic febrile diseases• Experience of diagnosing and treating
• Western(modern) medicine into China in 1830s,
by Christian missionaries
25. Brief History of PH in China -- the 20s-30s of 20th century
• The western medical hospital in China, represented byPeking Union Medical College Hospital
• The first Department of Public Health within PUMC in
1921, by Dr. John B. Grant, who was the Far-East
representative of RF
• A model of health-care community in Ding County,
Hebei province, as an educational field of department
of PH in 1928
• An early example of primary health care system was
established in Ding county during 1932-1937 by Prof.
Chen Zhi-qian
26. Brief History of PH in China -- the 50s-70s of 20th century
• Coping the public health system of the formerSoviet Union in 1950s
• Setting up an anti-epidemic system in 1950s
• Separate public health school from clinical
medicine in 1950s
• Forming Patriotic Health Campaign, established
PHC
• Barefoot doctor system in rural areas in 1960s
• Red cross clinic system in urban areas in 1960s
27. Brief History of PH in China -- the 50s-70s of 20th century
The great sanitary awakening
Preventing acute infectious diseases
Health education
Free basic immunization
Established three-tiered PHC network
A war against ‘four devils’: flies, mice, mosquitoes and
sparrows
• In the 1960s-1970s
controlled many serious epidemics of communicable
diseases, such as cholera, plague and malaria
28. Brief History of PH in China -- the 80s-90s of 20th century
• The rapid development of public health inChina
reform and open policy
development of science and technology and
education
the primary health care in China
international collaboration
• Established and perfected health three-tiered
network
• Strengthened maternal and child health
• Expanded program immunization
29.
80s-90s 20thcentury
The
Beginning
50s-70s 20th
century
Western
medicine
Traditiona
l medicine
of China
18th
Before
century
20s-30s 20th
century
18th –19th
century
Establishment
The Development
and improvement
30. Birth rate(BR). Infant mortality rate(IMR). Crude death rate(CDR). Life expectancy(LE)
YearBR(%)
IMR(‰)
DR(‰)
LE(Year)
1950
37.0
195
18.0
40.8
1960
20.9
121
25.4
49.5
1970
33.4
61
7.6
63.2
1980
18.2
47
6.3
67.8
1990
21.1
38
6.7
70.9
1999
15.32
33
6.46
72.0
(1998)
31. Leading Causes of Death
OrderUrban
Rural
1
Cancer
COPD
2
Stroke
Cancer
3
Heart Dis.
Stroke
4
COPD
Heart Dis.
5
Injury
Injury
32. Birth Rate Decreased
Birth Rate (‰)40
35
30
36
(‰)
16.6
25
20
15
10
5
year
19
99
19
95
19
90
19
85
19
80
19
75
19
70
19
65
19
60
19
55
19
50
19
49
0
(‰)
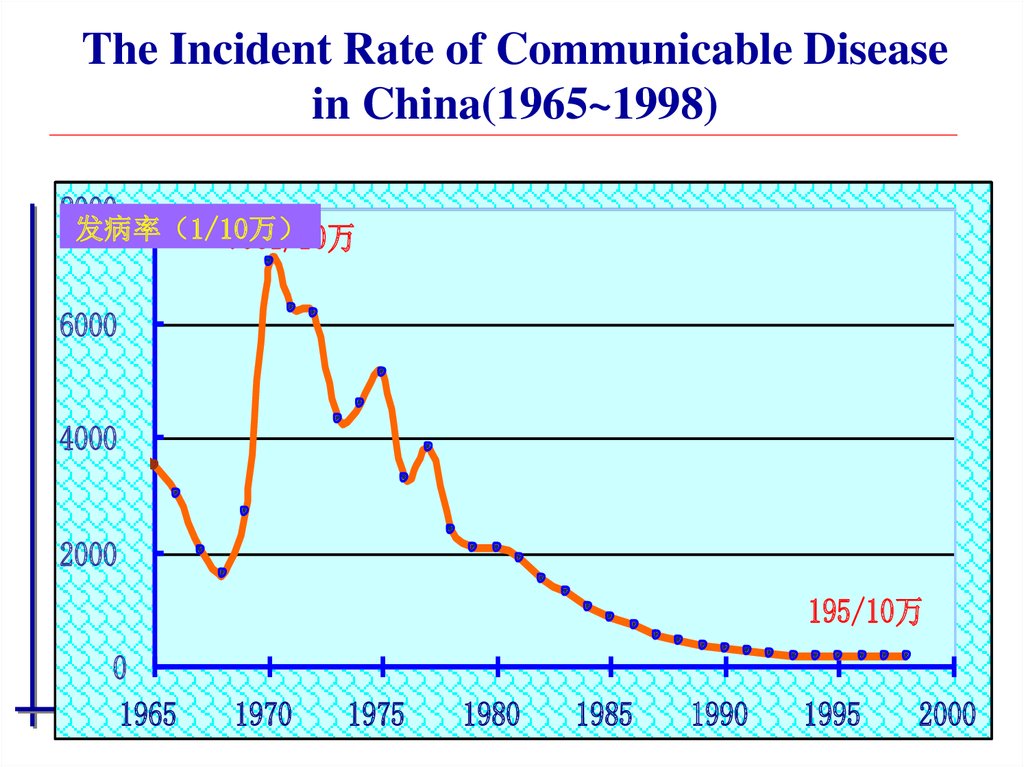
33.
The Incident Rate of Communicable Diseasein China(1965~1998)
8000
发病率 1/10万
7061/10万
6000
4000
2000
195/10万
0
1965
1970
1975
1980
1985
1990
1995
2000
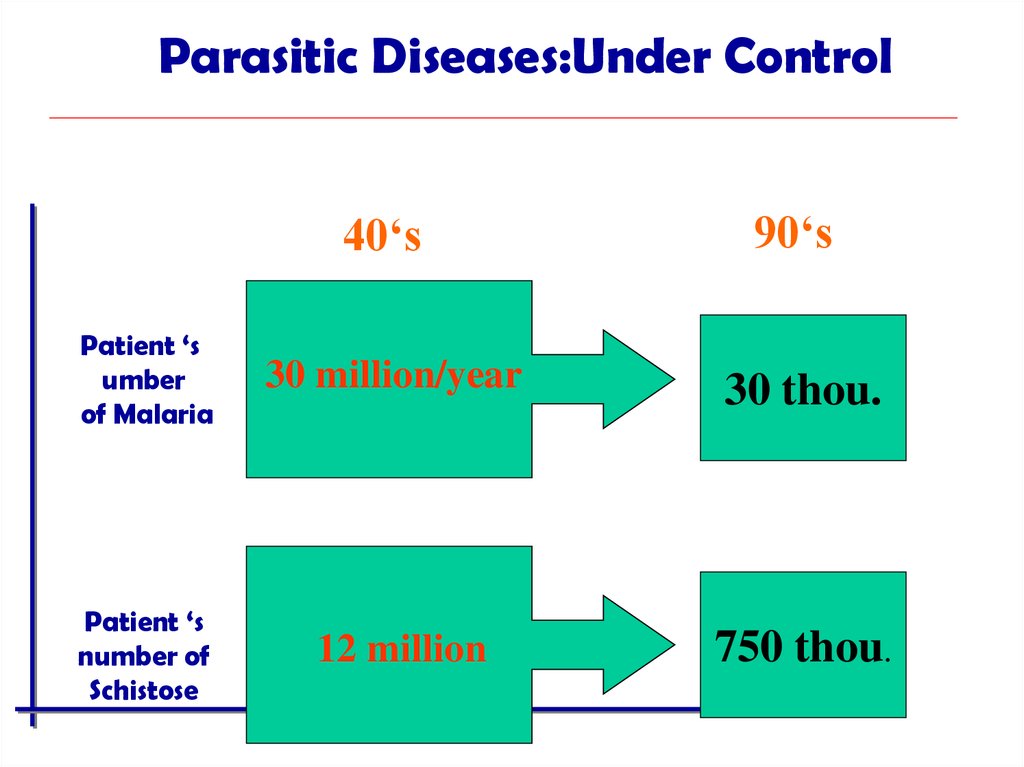
34.
Parasitic Diseases:Under Control40‘s
90‘s
Patient ‘s
umber
of Malaria
30 million/year
30 thou.
Patient ‘s
number of
Schistose
12 million
750 thou.
35. Proportion of different infectious disease cases 1965-1995 (%)
95Year
Gastrointestina
l
90
Transmitted by
sex or blood
80
70
Vector-borne and
natural endemic
Respiratory
60
50
0
20
40
60
80
100
36. Patriotic Sanitation Campaign
污水处理Kill mouse
Sanitary privy
Clear
environment
Sewage
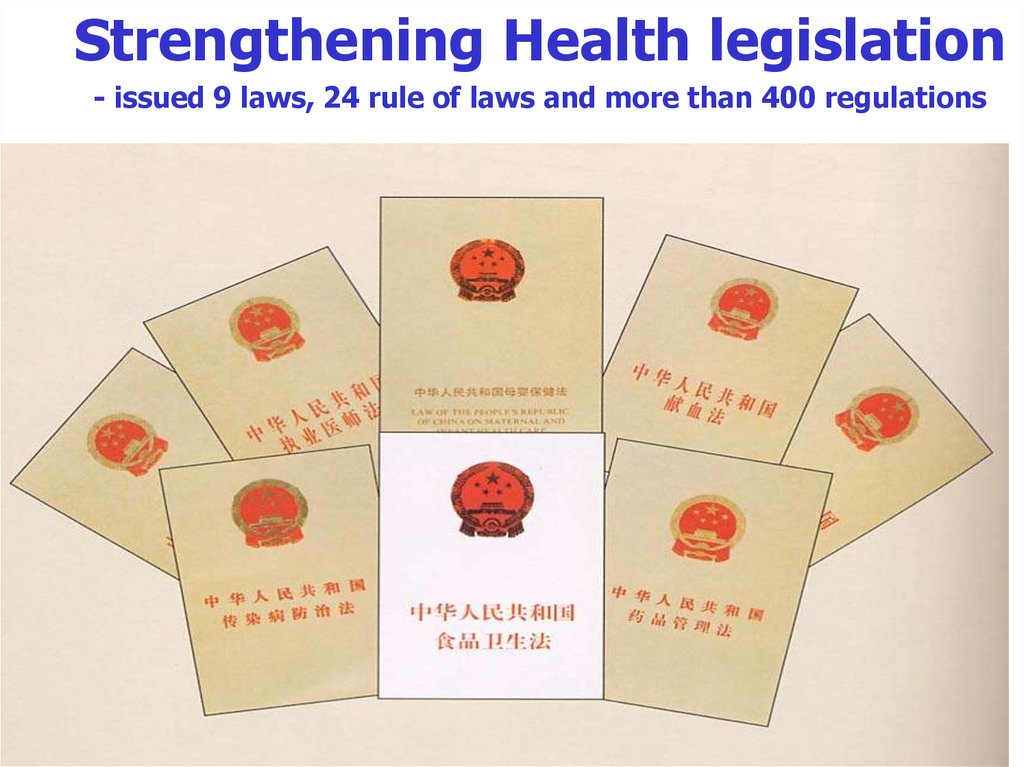
37.
Strengthening Health legislation- issued 9 laws, 24 rule of laws and more than 400 regulations
38. Development of Epidemic Prevention Institutions
7000283000
300000
Number of Health Workers
6000
250000
Number of Health Agencies
5900
5000
200000
4000
150000
3000
100000
2000
1000
50000
500
2500
0
1952
1957
0
1965
1975
1980
1985
1990
1995
1999
39.
World Health Report 2000 Selected IndicatorsAttainment of Goals
达标成就
Performance
效能
Health level
健康水平
DALY
Responsiveness
反应性水平
Fairness in financial
contribution
资金捐助
公正性
On level of
health
按健康水平评估
Overall health
system
整体效能
USA
24
1
54-55
72
37
Sweden
4
10
12-15
21
23
Japan
1
6
8-11
9
10
China
82
88-89
188
61
144
Thailand
100
33
128-130
102
47
40.
The Experts of the World BankEvaluate Primary Health Care in China:
“Truly, Declare of Alma-Ata in
1978 about the realization ‘Health for
all by the year 2000’ by primary health
care was deeply influenced by Chinese
model”
41.
Challenges• Change of Population
• Urbanization and industrialization
• Double burdens of diseases
• Behavioral and Environmental
• Unreasonable of allocation
42. Trend of Age Composition Change
1999 yearChina: 0.126 billion
Asia: 0.314 billion
World: 0.593 billion
2050 year
China: 0.440 billion
Asia:1.239 billion
World: 1.969 billion
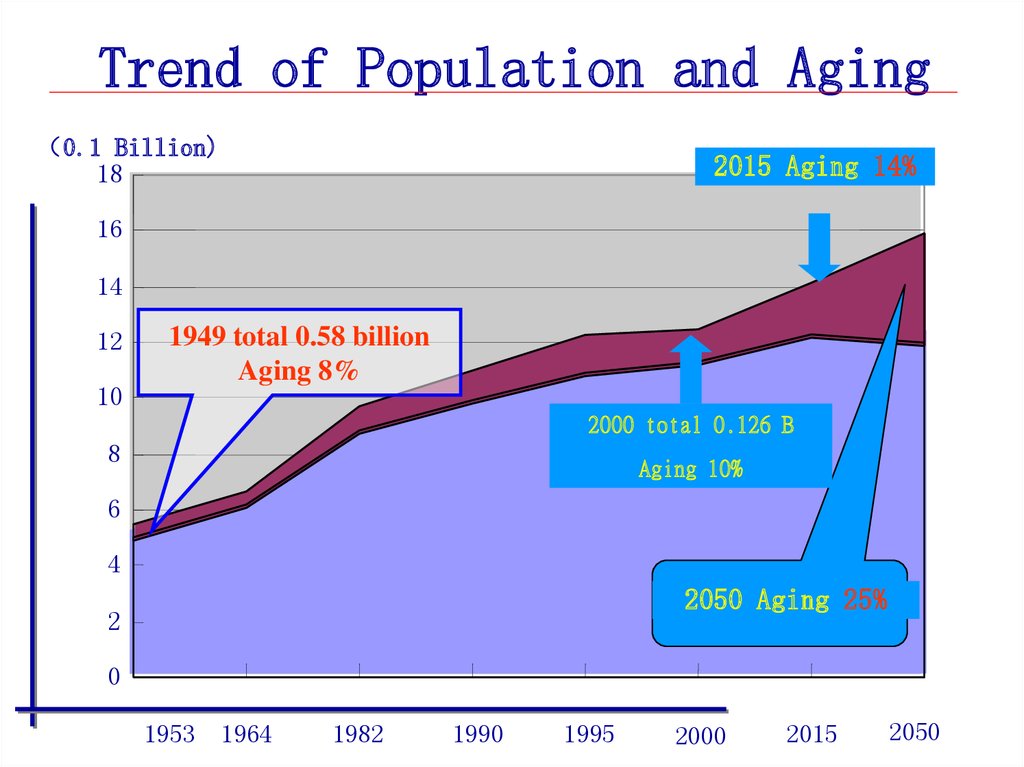
43.
Trend of Population and Aging0.1 Billion)
18
2015 Aging 14%
16
14
12
10
1949 total 0.58 billion
Aging 8%
2000 total 0.126 B
8
Aging 10%
6
4
2050 Aging 25%
2
0
1953
1964
1982
1990
1995
2000
2015
2050
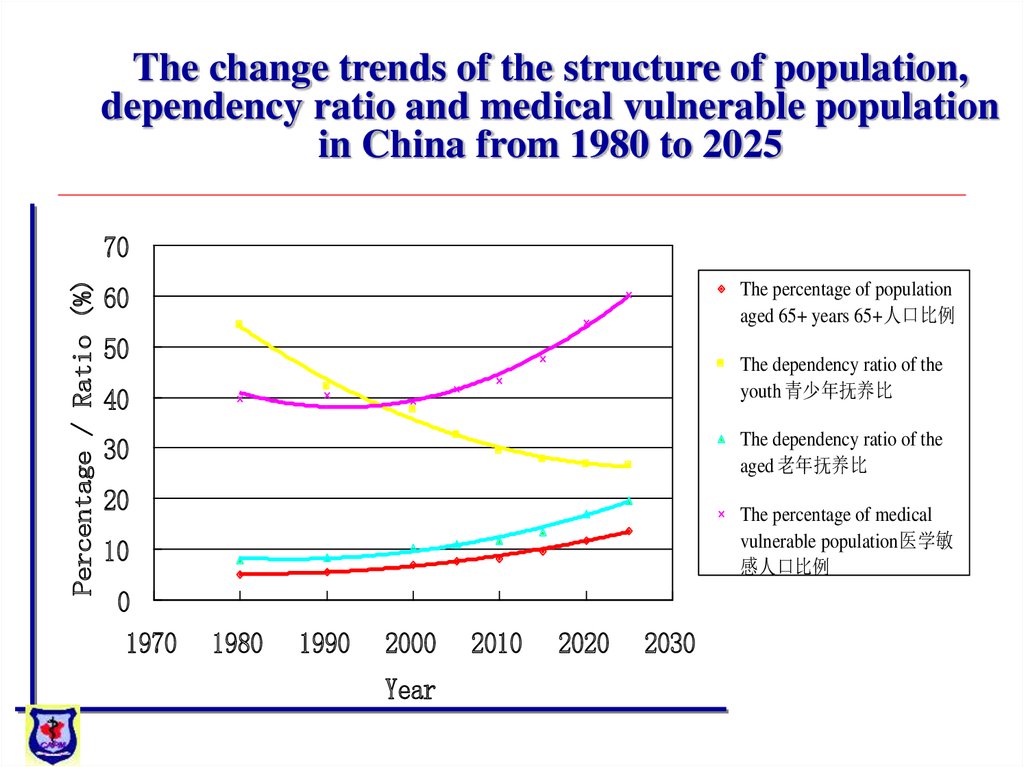
44.
The change trends of the structure of population,dependency ratio and medical vulnerable population
in China from 1980 to 2025
Percentage / Ratio (%)
70
The percentage of population
aged 65+ years 65+人口比例
60
50
The dependency ratio of the
youth 青少年抚养比
40
The dependency ratio of the
aged 老年抚养比
30
20
10
0
1970
1980
1990
2000
Year
2010
2020
2030
The percentage of medical
vulnerable population 医学敏
感人口比例
多项式 (The percentage of
population aged 65+ years 65+
人口比例)
多项式 (The dependency ratio
of the youth 青少年抚养比)
多项式 (The dependency ratio
45.
46. Urbanization and Industrialization
• Environmental pollution• Life and work stress
• Injury
• Immigrant
47. The Natural Ecological Environment —— Pollution
WastewaterThe comparison of the sewage discharge between 1998 and 1999
450
400
350
300
The sewage
discharge amount250
200
(Ч108t)
150
100
50
0
↗1.5
Domestic
sewage
Industrial
sewage
Total
↗↘
4.6%
1.6%
1998
1999
Year
48. Waste residue
The amount of urban refuse in ChinaBeijing
↗8.98%
↗ 15%~20%
In 1996 the amount of urban refuse
cleared and transported
1.08×10⁸ t
In 2000
1.2×10⁸ t ~1.4×10⁸ t
49. Waste gas
The major pollutantswere total suspended
particulates
(TSP)
and sulfur dioxide
• In 1999, the coal smoke type was still the
main type of air pollution in China
A
few megalopolises were the complex
type of coal smoke and automobile
exhaust pollution
50.
Double Burdens of DiseaseThreats of communicable disease and
parasitic disease still exists
Chronic and non-communicable
disease growth rapidly
51. Threats of Infectious Disease and Parasitic Disease Still Exists
Threats from old infectious diseases such asTuberculosis and hepatitis still exists
New threats from new arising communicable
diseases such as AIDS
52.
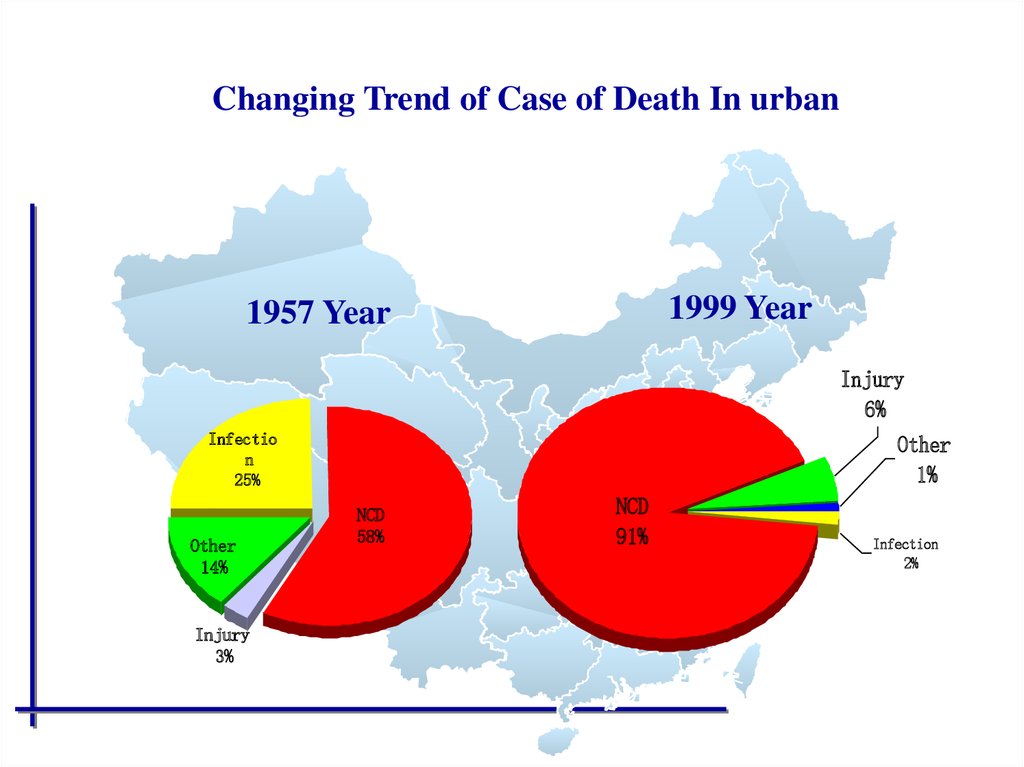
Changing Trend of Case of Death In urban1999 Year
1957 Year
Injury
6%
Infectio
n
25%
Other
14%
Injury
3%
Other
1%
NCD
58%
NCD
91%
Infection
2%
53. The prevalence and mortality rate of chronic and non-communicable diseases rises continuously ( In urban areas, 1954-1998)
160140
Respiratory
cerebrovascular
Heart
disease
120
cancer
100 thousand
100
80
60
40
Digestive disease
20
Metabolized
disease
0
1954
1957
1963
1975
1980
1985
1990
1995
1998
54. Behavioral Risk Factors
SmokingDrinking
Dirt
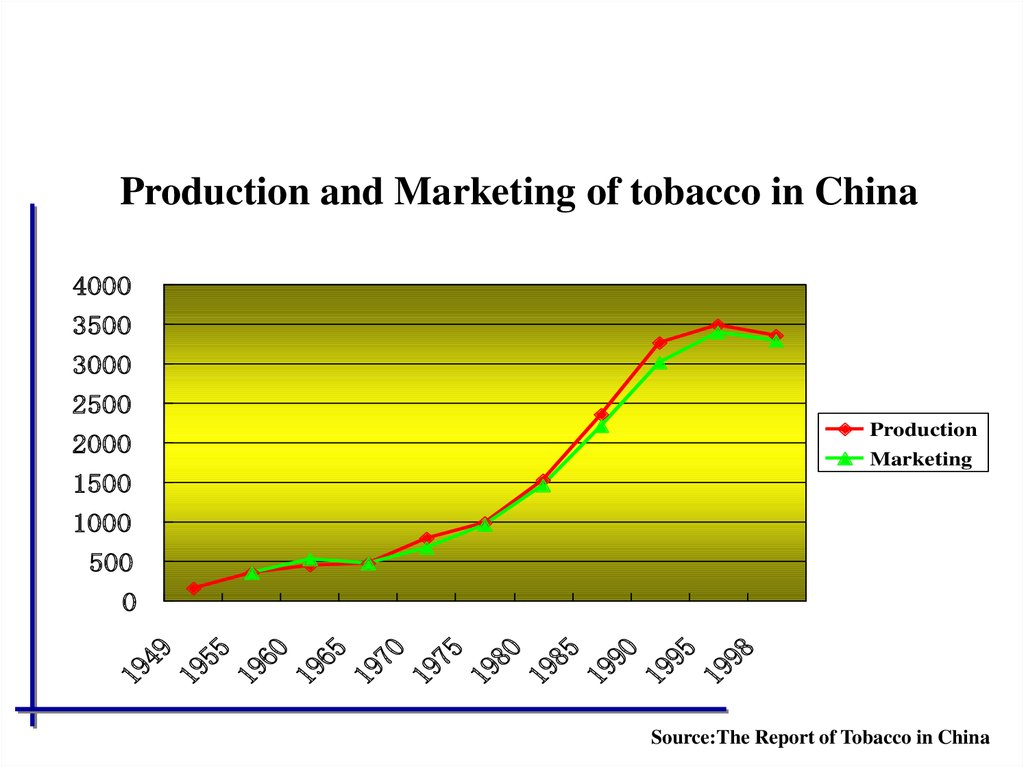
55. Smoking
At present China has turned into the biggestcountry of tobacco consumption in the world
Accounting for more than 30% of the total
tobacco consumption in the whole world
Increasing at the speed of 5.3% annually
56.
Production and Marketing of tobacco in China4000
3500
3000
2500
Production
Marketing
2000
1500
1000
500
98
19
95
19
90
19
85
19
80
19
75
19
70
19
65
19
60
19
55
19
19
49
0
Source:The Report of Tobacco in China
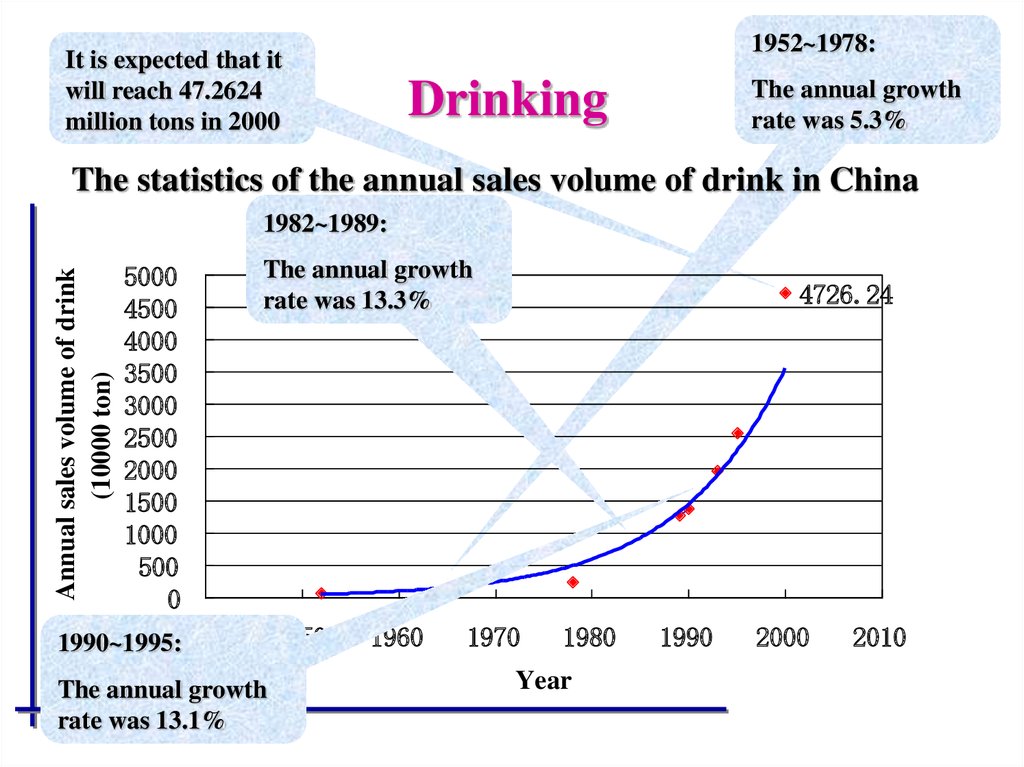
57.
1952~1978:It is expected that it
will reach 47.2624
million tons in 2000
The annual growth
rate was 5.3%
Drinking
The statistics of the annual sales volume of drink in China
1982~1989:
Annual sales volume of drink
(10000 ton)
5000
4500
4000
3500
3000
2500
2000
1500
1000
500
0
1990~1995:1940
The annual growth
rate was 13.3%
The annual growth
rate was 13.1%
1950
1960
4726.24
1970
1980
Year
1990
2000
2010
58. Diet
The comparison of food consumption by residentsbetween 1991 and 1997 in the city and country of
Chongqing municipality (kg/year·person)
Grain
City
Country
↓
↘
117.9→71.1
250.3→245.5
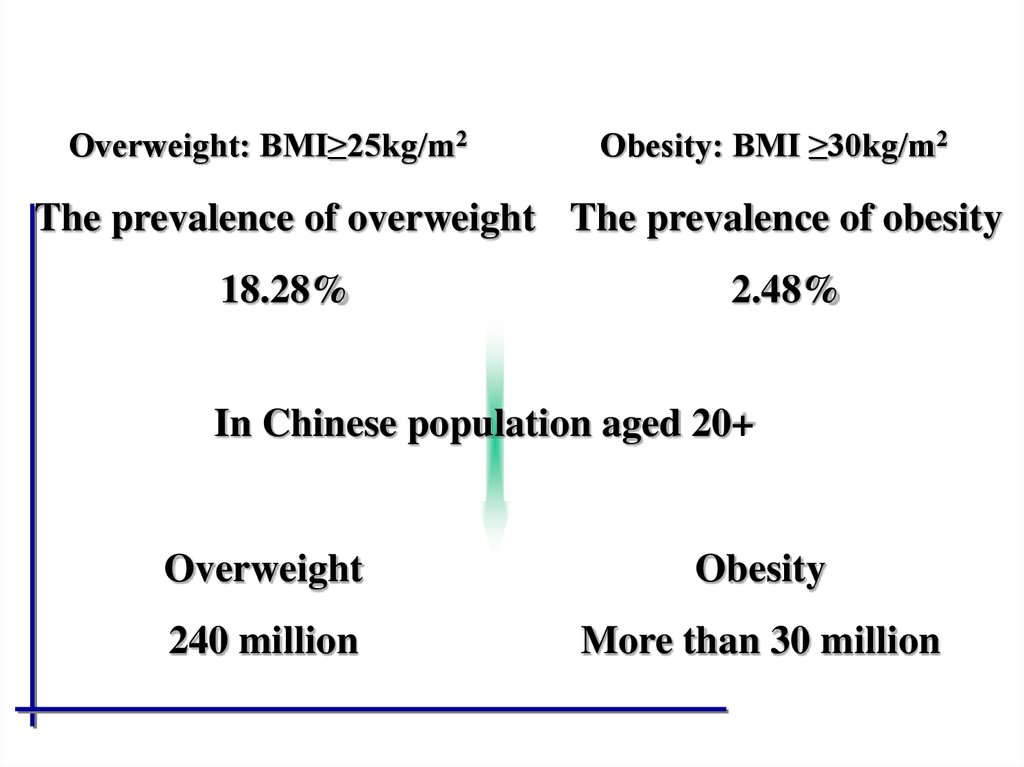
59.
Overweight: BMI≥25kg/m2Obesity: BMI ≥30kg/m2
The prevalence of overweight The prevalence of obesity
18.28%
2.48%
In Chinese population aged 20+
Overweight
Obesity
240 million
More than 30 million
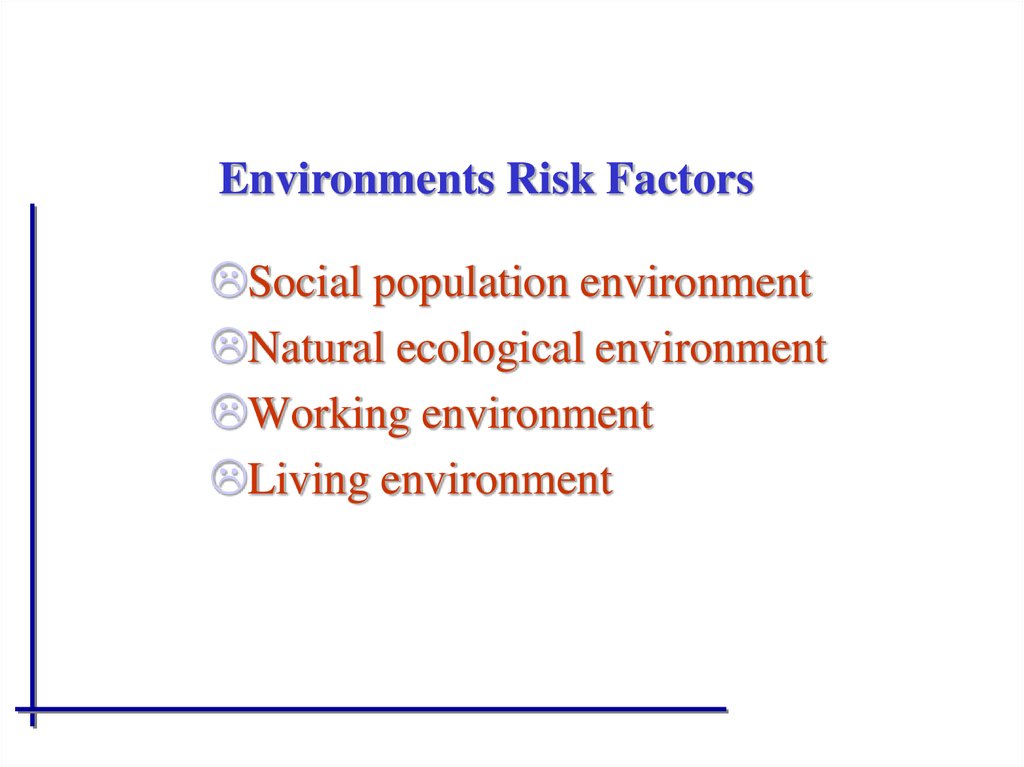
60.
Environments Risk FactorsSocial population environment
Natural ecological environment
Working environment
Living environment
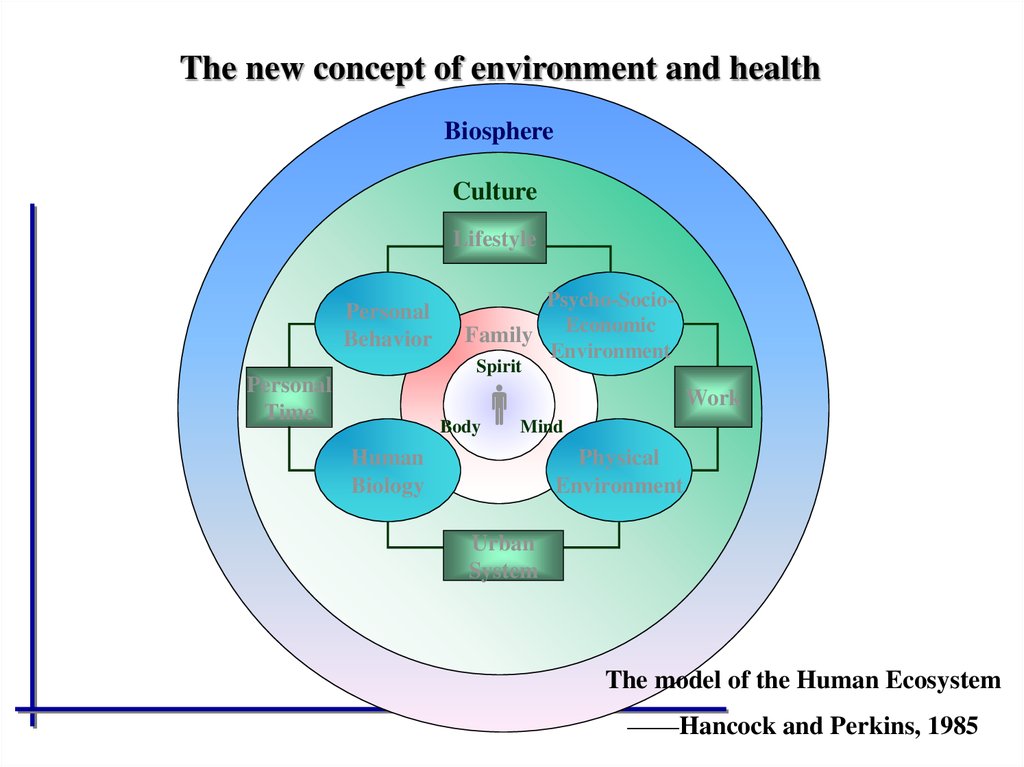
61.
The new concept of environment and healthBiosphere
Culture
Lifestyle
Personal
Behavior
Psycho-SocioFamily Economic
Environment
Spirit
Personal
Time
Body
Work
Mind
Human
Biology
Physical
Environment
Urban
System
The model of the Human Ecosystem
——Hancock and Perkins, 1985