


 Биология
Похожие презентации:


Genetic code
1.
2.
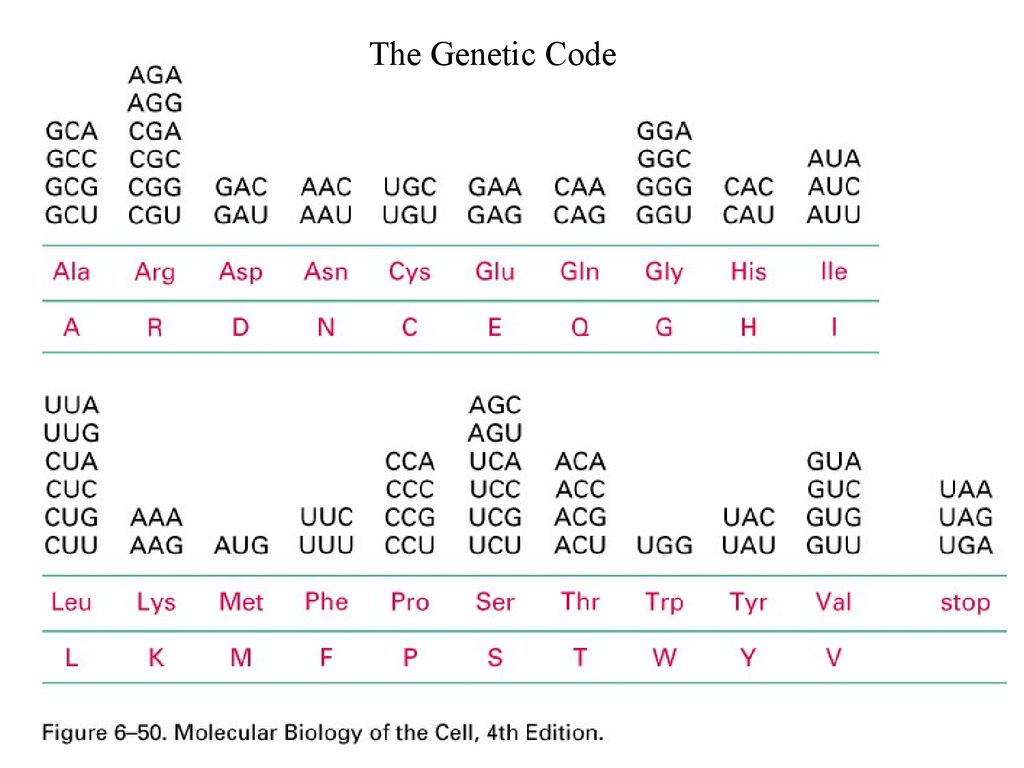
The Genetic Code3.
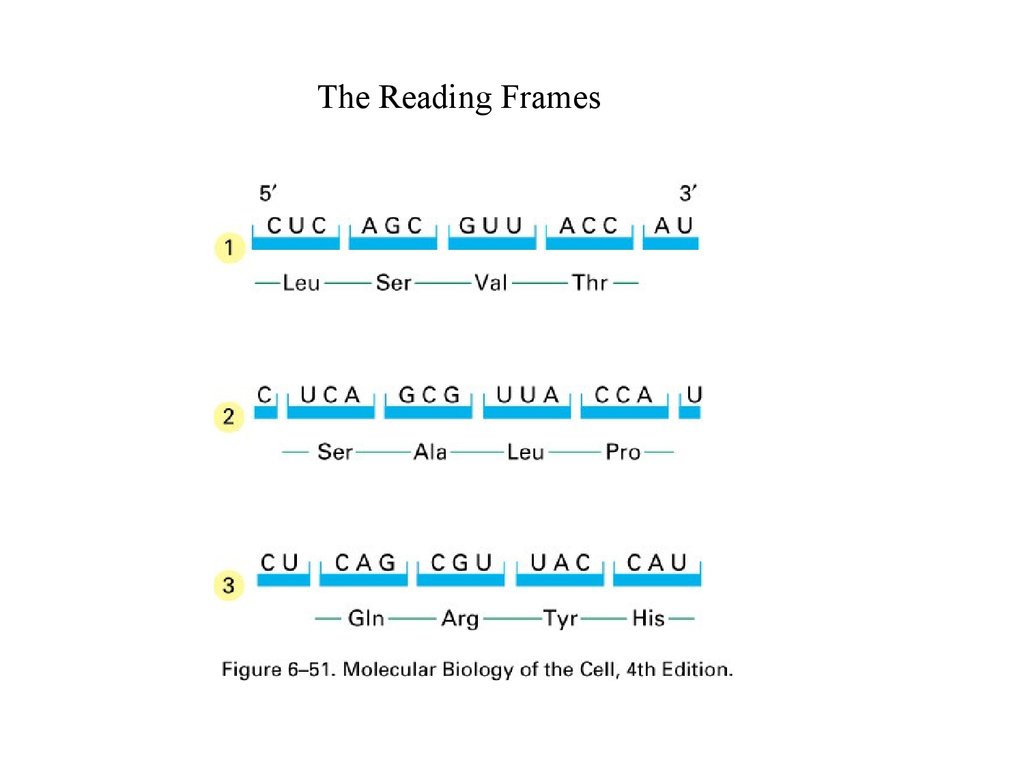
The Reading Frames4.
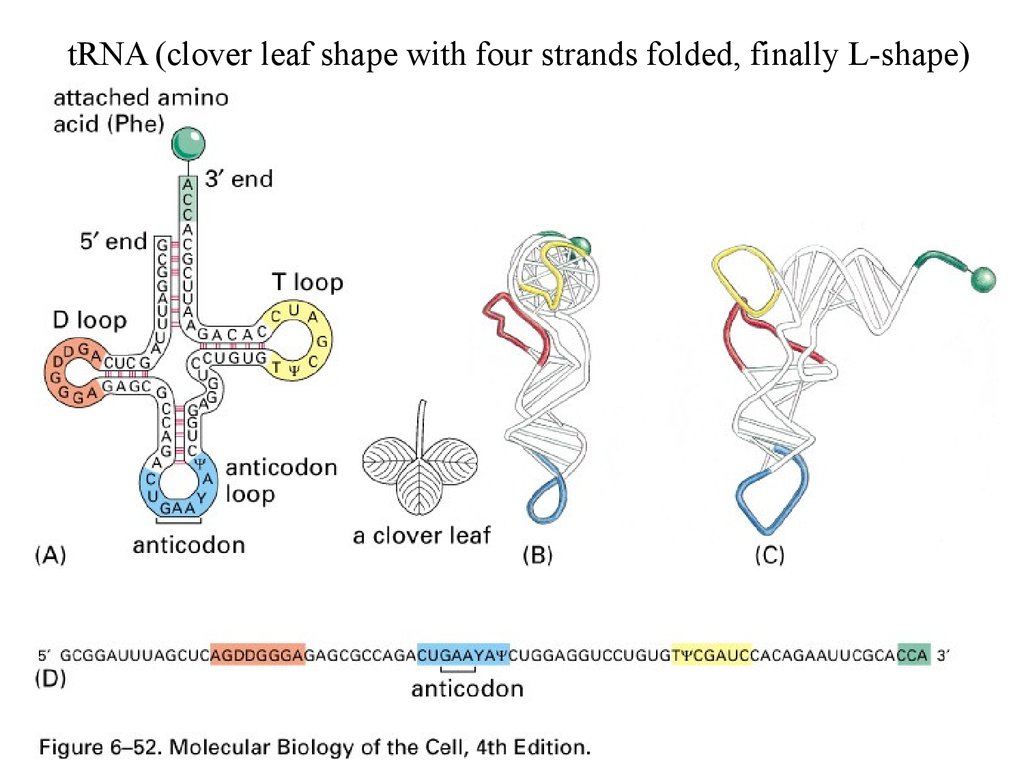
tRNA (clover leaf shape with four strands folded, finally L-shape)5.
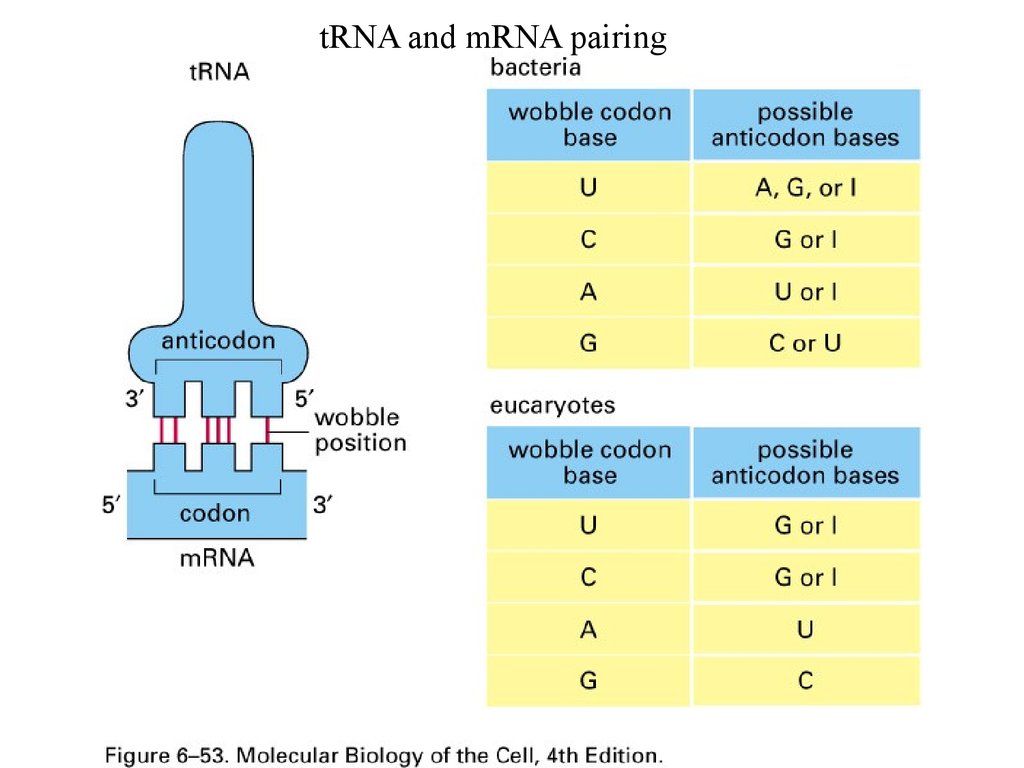
tRNA and mRNA pairing6.
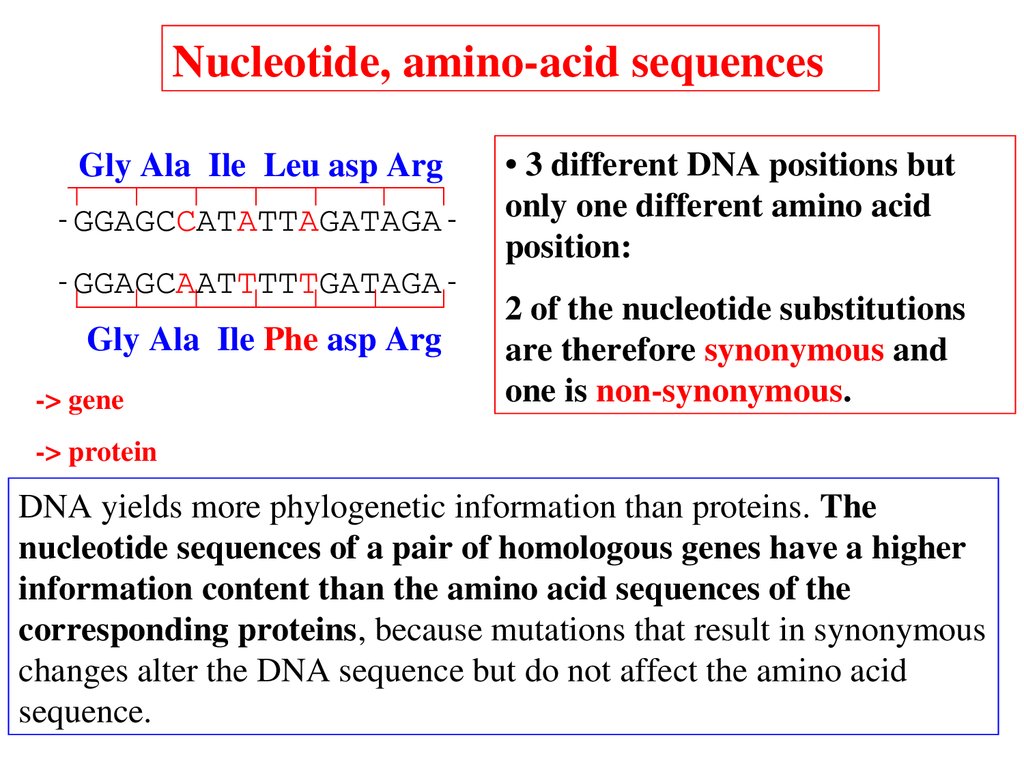
Nucleotide, aminoacid sequencesGly Ala Ile Leu asp Arg
GGAGCCATATTAGATAGA
GGAGCAATTTTTGATAGA
Gly Ala Ile Phe asp Arg
> gene
• 3 different DNA positions but
only one different amino acid
position:
2 of the nucleotide substitutions
are therefore synonymous and
one is nonsynonymous.
> protein
DNA yields more phylogenetic information than proteins. The
nucleotide sequences of a pair of homologous genes have a higher
information content than the amino acid sequences of the
corresponding proteins, because mutations that result in synonymous
changes alter the DNA sequence but do not affect the amino acid
sequence.
7.
8.
Standard genetic code•The genetic code specifies how a combination of any of
the four bases (A,G,C,T) produces each of the 20 amino
acids.
•The triplets of bases are called codons and with four
bases, there are 64 possible codons:
(43) possible codons that code for 20 amino acids (and stop
signals).
9.
Standard genetic code• Because there are only 20 amino acids, but 64 possible codons, the same amino
acid is often encoded by a number of different codons, which usually differ in the
third base of the triplet.
•Because of this repetition the genetic code is said to be degenerate and codons
which produce the same amino acid are called synonymous codons.
10.
Important properties inherent tothe standard genetic code
11.
Synonymous vs nonsynonymous substitutions• Nondegenerate sites: are codon position where mutations always
result in amino acid substitutions.
(exp. TTT (Phenylalanyne, CTT (leucine), ATT (Isoleucine), and
GTT (Valine)).
• Twofold degenerate sites: are codon positions where 2 different
nucleotides result in the translation of the same aa, but the 2 others
code for a different aa.
(exp. GAT and GAC code for Aspartic acid (asp, D),
whereas GAA and GAG both code for Glutamic acid (glu, E)).
• Threefold degenerate site: are codon positions where changing 3
of the 4 nucleotides has no effect on the aa, while changing the
fourth possible nucleotide results in a different aa.
There is only 1 threefold degenerate site: the 3 rd position of an isoleucine codon.
ATT, ATC, or ATA all encode isoleucine, but ATG encodes methionine.
12.
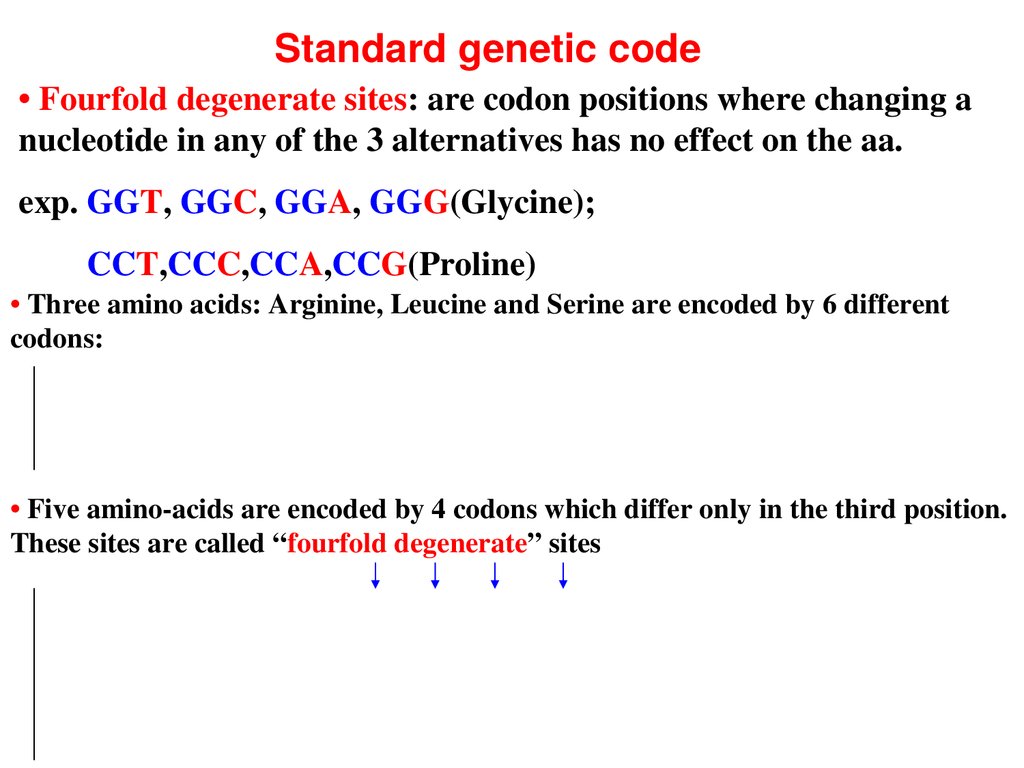
Standard genetic code• Fourfold degenerate sites: are codon positions where changing a
nucleotide in any of the 3 alternatives has no effect on the aa.
exp. GGT, GGC, GGA, GGG(Glycine);
CCT,CCC,CCA,CCG(Proline)
• Three amino acids: Arginine, Leucine and Serine are encoded by 6 different
codons:
• Five aminoacids are encoded by 4 codons which differ only in the third position.
These sites are called “fourfold degenerate” sites
13.
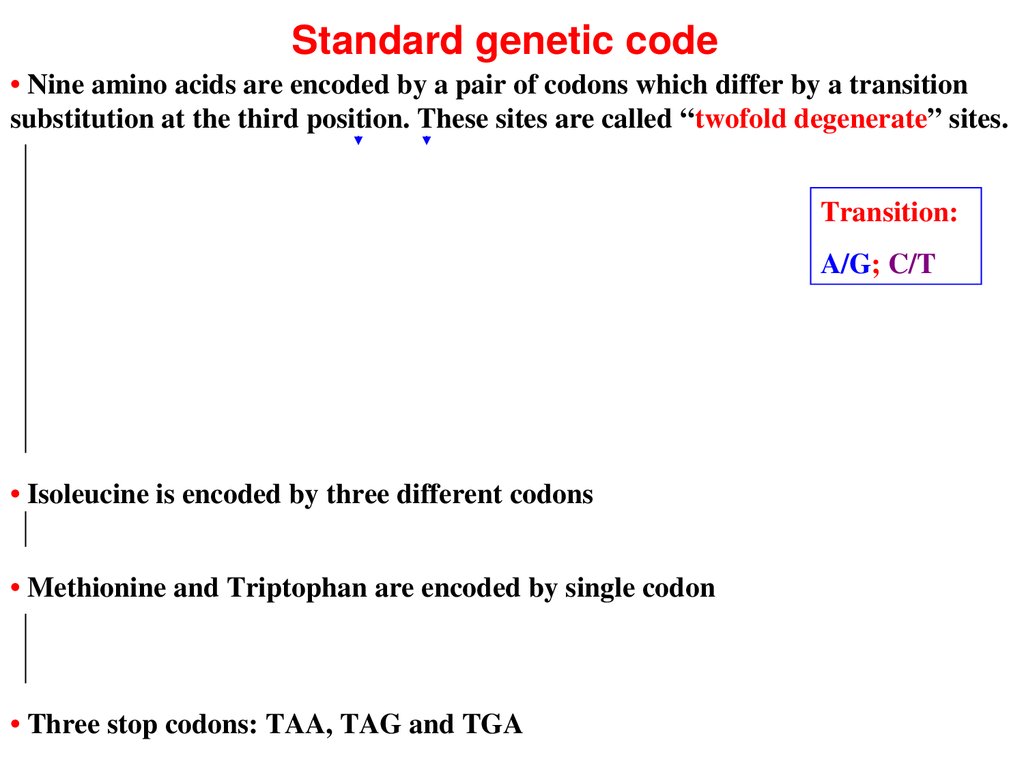
Standard genetic code• Nine amino acids are encoded by a pair of codons which differ by a transition
substitution at the third position. These sites are called “twofold degenerate” sites.
Transition:
A/G; C/T
• Isoleucine is encoded by three different codons
• Methionine and Triptophan are encoded by single codon
• Three stop codons: TAA, TAG and TGA
14.
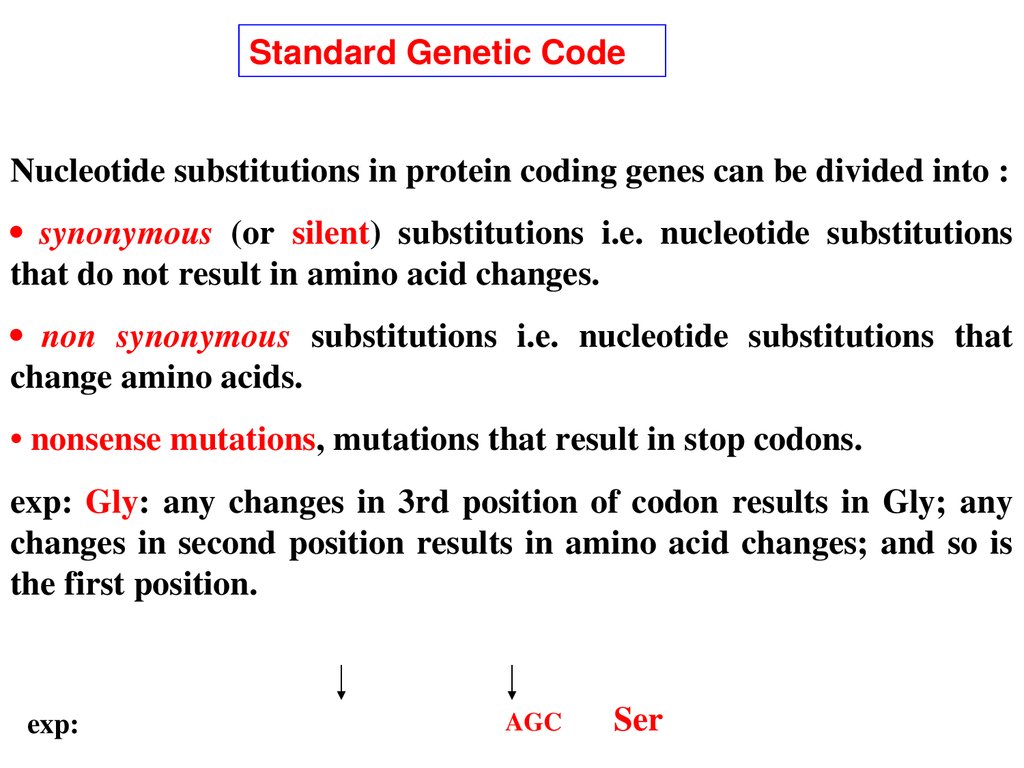
Standard Genetic CodeNucleotide substitutions in protein coding genes can be divided into :
• synonymous (or silent) substitutions i.e. nucleotide substitutions
that do not result in amino acid changes.
• non synonymous substitutions i.e. nucleotide substitutions that
change amino acids.
• nonsense mutations, mutations that result in stop codons.
exp: Gly: any changes in 3rd position of codon results in Gly; any
changes in second position results in amino acid changes; and so is
the first position.
exp:
AGC Ser
15.
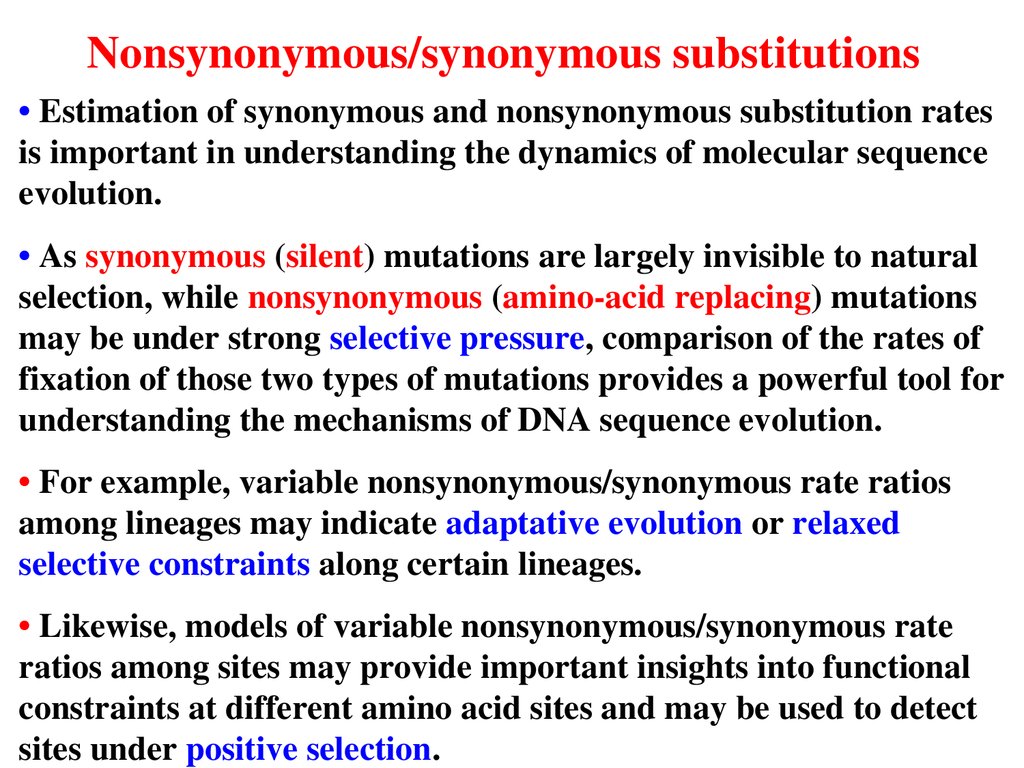
Nonsynonymous/synonymous substitutions• Estimation of synonymous and nonsynonymous substitution rates
is important in understanding the dynamics of molecular sequence
evolution.
• As synonymous (silent) mutations are largely invisible to natural
selection, while nonsynonymous (aminoacid replacing) mutations
may be under strong selective pressure, comparison of the rates of
fixation of those two types of mutations provides a powerful tool for
understanding the mechanisms of DNA sequence evolution.
• For example, variable nonsynonymous/synonymous rate ratios
among lineages may indicate adaptative evolution or relaxed
selective constraints along certain lineages.
• Likewise, models of variable nonsynonymous/synonymous rate
ratios among sites may provide important insights into functional
constraints at different amino acid sites and may be used to detect
sites under positive selection.
16.
Codon usage• There are 64 (43) possible codons that code for 20 amino acids
(and stop signals).
• If nucleotide substitution occurs at random at each nucleotide site,
every nucleotide site is expected to have one of the 4 nucleotides, A,
T, C and G, with equal probability.
• Therefore, if there is no selection and no mutation bias, one would
expect that the codons encoding the same amino acid are on average
in equal frequencies in protein coding regions of DNA.
• In practice, the frequencies of different codons for the same amino
acid are usually different, and some codons are used more often than
others. This codon usage bias is often observed.
• Codon usage bias is controlled by both mutation pressure and
purifying selection.
17.
Estimating synonymous and nonsynonymous differences• For a pair of homologous codons presenting only one nucleotide
difference, the number of synonymous and nonsynonymous
substitutions may be obtained by simple counting of silent versus
non silent amino acid changes;
• For a pair of codons presenting more than one nucleotide
difference, distinction between synonymous and nonsynonymous
substitutions is not easy to calculate and statistical estimation
methods are needed;
• For example, when there are 3 nucleotide differences between
codons, there are 6 different possible pathways between these
codons. In each path there are 3 mutational steps.
• More generally there can be many possible pathways between
codons that differ at all three positions sites; each pathway has its
own probability.
18.
Estimating synonymous and nonsynonymous differences• Observed nucleotide differences between 2 homologous sequences
are classified into 4 categories: synonymous transitions, synonymous
transversions, nonsynonymous transitions and nonsynonymous
transversions.
• When the 2 compared codons differ at one position, the
classification is obvious.
• When they differ at 2 or 3 positions, there will be 2 of 6
parsimonious pathways along which one codon could change into the
other, and all of them should be considered.
• Since different pathways may involve different numbers of
synonymous and nonsynonymous changes, they should be weighted
differently.
19.
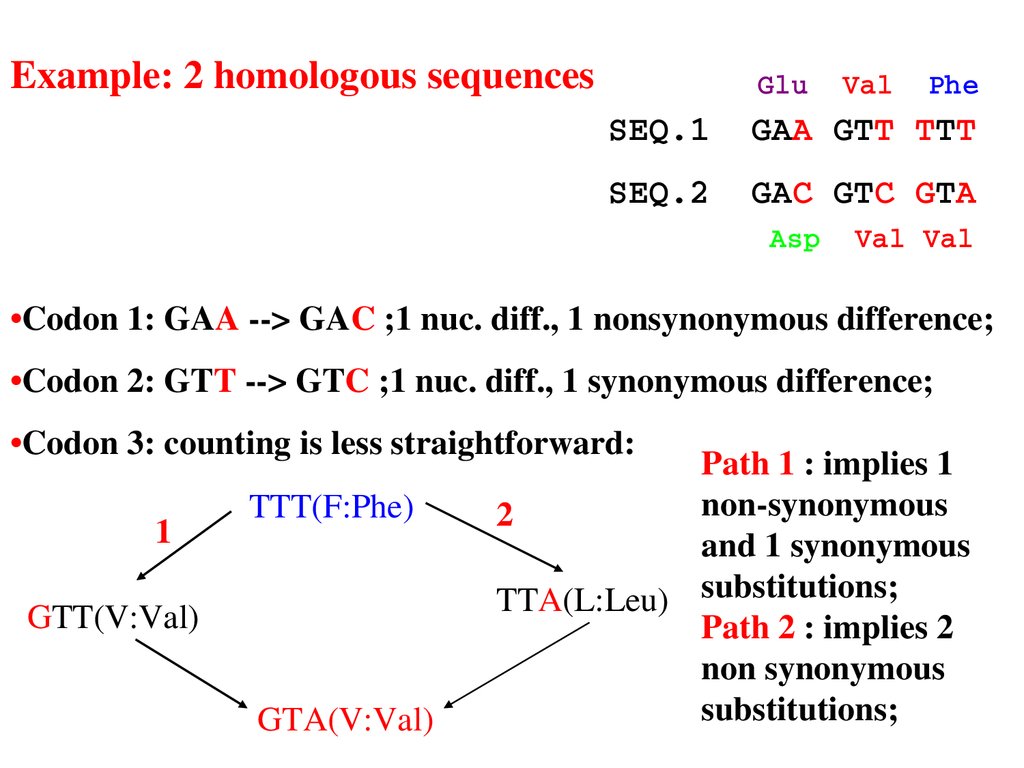
Example: 2 homologous sequencesGlu Val Phe
SEQ.1 GAA GTT TTT
SEQ.2 GAC GTC GTA
Asp Val Val
•Codon 1: GAA > GAC ;1 nuc. diff., 1 nonsynonymous difference;
•Codon 2: GTT > GTC ;1 nuc. diff., 1 synonymous difference;
•Codon 3: counting is less straightforward:
1
TTT(F:Phe)
GTT(V:Val)
GTA(V:Val)
Path 1 : implies 1
nonsynonymous
2
and 1 synonymous
TTA(L:Leu) substitutions;
Path 2 : implies 2
non synonymous
substitutions;
20.
Evolutionary Distance estimation between 2 sequencesThe simplest problem is the estimation of the number of
synonymous (dS) and nonsynonymous (dN) substitutions per site
between 2 sequences:
• the number of synonymous (S) and nonsynonymous (N) sites in the
sequences are counted;
• the number of synonymous and nonsynonymous differences
between the 2 sequences are counted;
• a correction for multiple substitutions at the same site is applied to
calculate the numbers of synonymous (dS) and nonsynonymous
(dN) substitutions per site between the 2 sequences.
==> many estimation Methods
21.
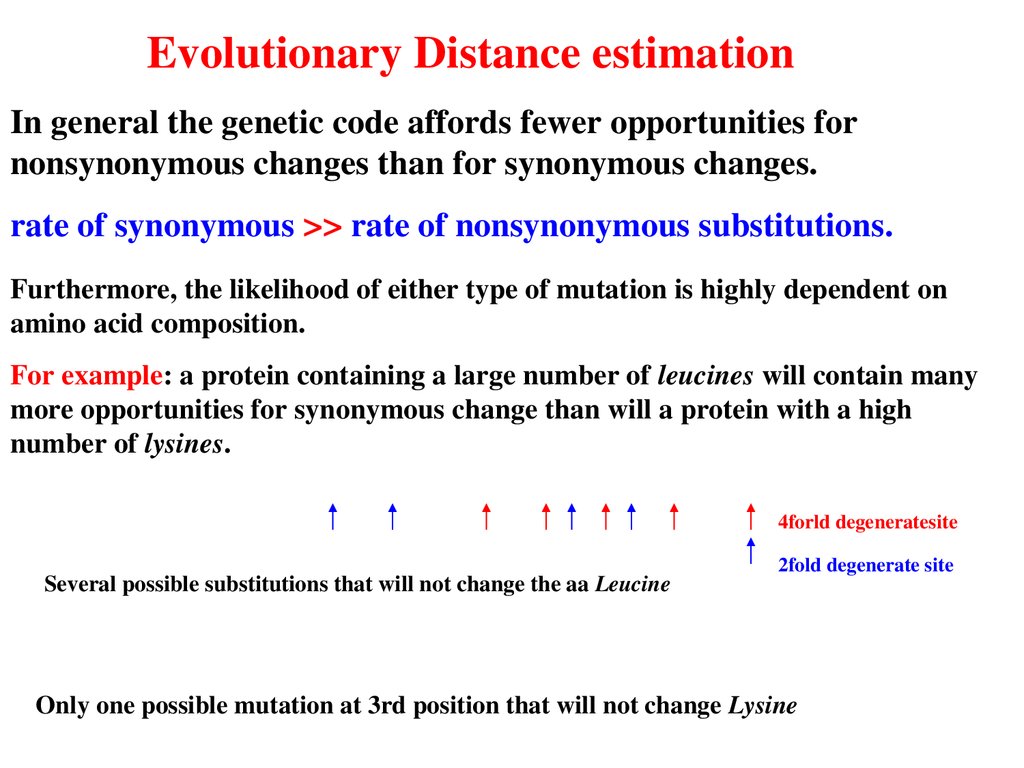
Evolutionary Distance estimationIn general the genetic code affords fewer opportunities for
nonsynonymous changes than for synonymous changes.
rate of synonymous >> rate of nonsynonymous substitutions.
Furthermore, the likelihood of either type of mutation is highly dependent on
amino acid composition.
For example: a protein containing a large number of leucines will contain many
more opportunities for synonymous change than will a protein with a high
number of lysines.
4forld degeneratesite
Several possible substitutions that will not change the aa Leucine
2fold degenerate site
Only one possible mutation at 3rd position that will not change Lysine
22.
Evolutionary Distance estimation• Fundamental for the study of protein evolution and useful for
constructing phylogenetic trees and estimation of divergence time.
23.
Estimating synonymous and nonsynonymous substitution rates• Ziheng Yang & Rasmus Nielsen (2000)
Estimating synonymous and nonsynonymous substitution rates under
realistic evolutionary models. Mol Biol Evol. 17:3243.
24.
Purifying selection:Most of the time selection eliminates deleterious mutations, keeping
the protein as it is.
Positive selection:
In few instances we find that dN (also denoted Ka) is much greater
than dS (also denoted Ks) (i.e. dN/dS >> 1 (Ka/Ks >>1 )). This is strong
evidence that selection has acted to change the protein.
Positive selection was tested for by comparing the number of nonsynonymous substitutions per
nonsynonymous site (dN) to the number of synonymous substitutions per synonymous site (dS). Because
these numbers are normalized to the number of sites, if selection were neutral (i.e., as for a
pseudogene) the dN/dS ratio would be equal to 1. An unequivocal sign of positive selection is a dN/dS
ratio significantly exceeding 1, indicating a functional benefit to diversify the amino acid sequence.
dN/dS < 0.25 indicates purifying selection;
dN/dS = 1 suggests neutral evolution;
dN/dS >> 1 indicates positive selection.
25.
Negative (purifying) selection eliminates disadvantageousmutations i.e. inhibits protein evolution.
(explains why dN < dS in most protein coding regions)
Positive selection is very important for evolution of new functions
especially for duplicated genes.
(must occur early after duplication otherwise null mutations and
will be fixed producing pseudogenes).
• dN/dS (or Ka/Ks) measures selection pressure
26.
Mutational saturationMutational saturation in DNA and protein sequences
occurs when sites have undergone multiple mutations
causing sequence dissimilarity (the observed differences)
to no longer accurately reflect the “true” evolutionary
distance i.e. the number of substitutions that have
actually occurred since the divergence of two sequences.
Correct estimation of the evolutionary distance is crucial.
Generally: sequences where dS > 2 are excluded to avoid
the saturation effect of nucleotide substitution.
27.
> yn00 similar results than ML (Yang & Nielsen (2000))> advantage : easy automation for large scale comparisons;
• PAML: Phylogenetic Analysis by Maximum Likelihood (PAML)
http://abacus.gene.ucl.ac.uk/software/paml.html
28.
Relative Rate Test1
2
A
3
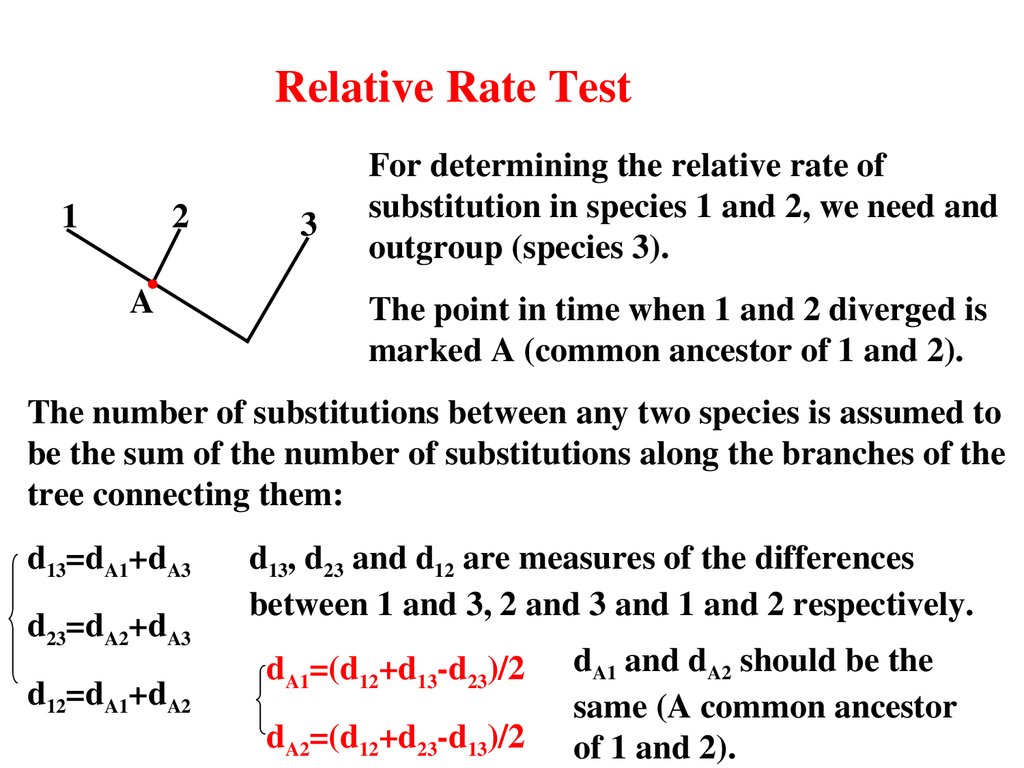
For determining the relative rate of
substitution in species 1 and 2, we need and
outgroup (species 3).
The point in time when 1 and 2 diverged is
marked A (common ancestor of 1 and 2).
The number of substitutions between any two species is assumed to
be the sum of the number of substitutions along the branches of the
tree connecting them:
d13=dA1+dA3
d23=dA2+dA3
d12=dA1+dA2
d13, d23 and d12 are measures of the differences
between 1 and 3, 2 and 3 and 1 and 2 respectively.
dA1=(d12+d13d23)/2
dA2=(d12+d23d13)/2
dA1 and dA2 should be the
same (A common ancestor
of 1 and 2).
29.
ReferenceYang & Nielsen,
Esimating Synonymous and Nonsynonymous Substitution Rates Under
Realistic Evolutionary Models
Mol. Biol. Evol. 2000, 17:3243
=>Other estimation Models
30.
Evolutionary Distance estimation between 2 sequences• Under certain conditions, however, nonsynonymous substitution may be
accelerated by positive Darwinian selection. It is therefore interesting to examine
the number of synonymous differences per synonymous site and the number of
nonsynonymous differences per nonsynonymous site.
pdistance:
• ps = Sd/S
proportion of synonymous differences ;
var(ps) = ps(1ps)/S.
• pn = Nd/N
proportion of non synonymous differences;
var(pn) = pn(1pn)/S.
Sd and Nd are respectively the total number of synonymous and non
synonymous differences calculated over all codons. S and N are the
numbers of synonymous and nonsynonymous substitutions.
S+N=n total number of nucleotides and N >> S.
31.
Substitutions between protein sequencesp = nd/n
V(p)=p(1p)/n
nd and n are the number of amino acid differences and the total number of
amino acids compared.
However, refining estimates of the number of substitutions that have occurred
between the amino acid sequences of 2 or more proteins is generally more
difficult than the equivalent task for coding sequences (see paths above).
One solution is to weight each amino acid substitution differently by using
empirical data from a variety of different protein comparisons to generate a
matrix as the PAM matrix for example.
32.
Number of synonymous (ds) and non synonymous (dn)substitutions per site
1) Jukes and Cantor, “oneparameter method” denoted “1p” :
This model assumes that the rate of nucleotide substitution is the
same for all pairs of the four nucleotides A, T, C and G (generally not
true!).
d = (3/4)*Ln(1(4/3)*p) where p is either ps or pn.
2) Kimura's 2parameter, denoted “2p” :
The rate of transitional nucleotide substitution is often higher than
that of transversional substitution.
d = (1/2)*Ln(1 2*P Q) (1/4)*Log(1 2*Q)
P is the proportion of transitional differences,
Q is the proportion of transversional differences
P and Q are respectively calculated over synonymous and non
synonymous differences.
33.
• Example: yn00 in PAML.• Protein sequences in a family
and corresponding DNA sequences
34.
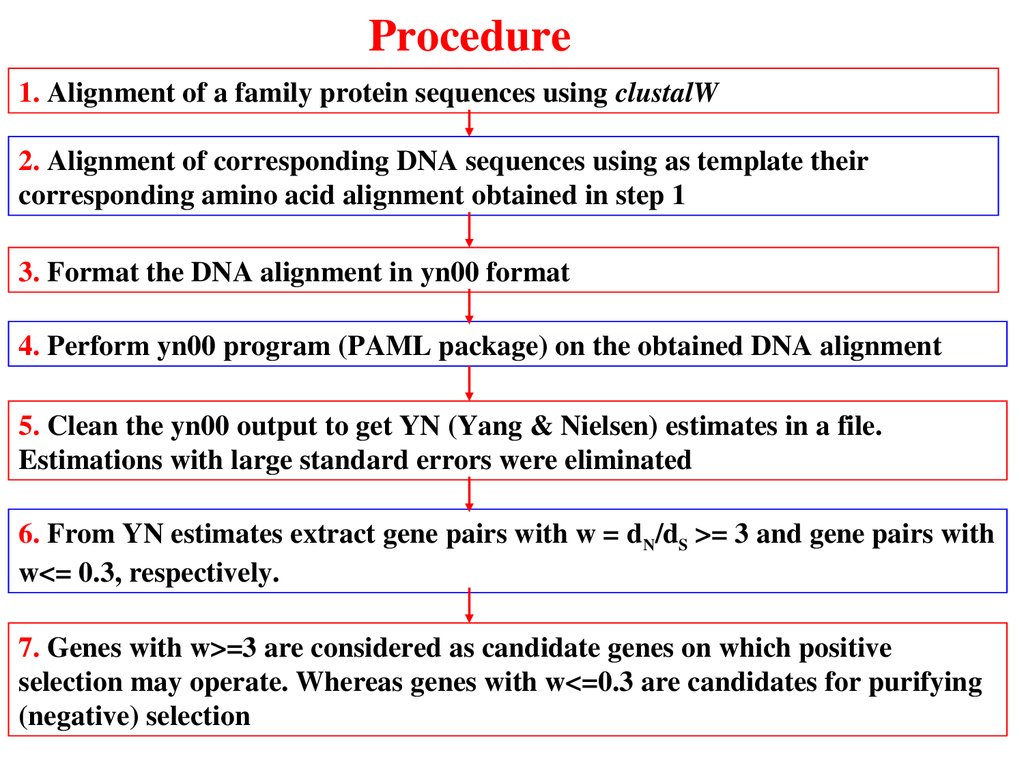
Procedure1. Alignment of a family protein sequences using clustalW
2. Alignment of corresponding DNA sequences using as template their
corresponding amino acid alignment obtained in step 1
3. Format the DNA alignment in yn00 format
4. Perform yn00 program (PAML package) on the obtained DNA alignment
5. Clean the yn00 output to get YN (Yang & Nielsen) estimates in a file.
Estimations with large standard errors were eliminated
6. From YN estimates extract gene pairs with w = d N/dS >= 3 and gene pairs with
w<= 0.3, respectively.
7. Genes with w>=3 are considered as candidate genes on which positive
selection may operate. Whereas genes with w<=0.3 are candidates for purifying
(negative) selection
35.
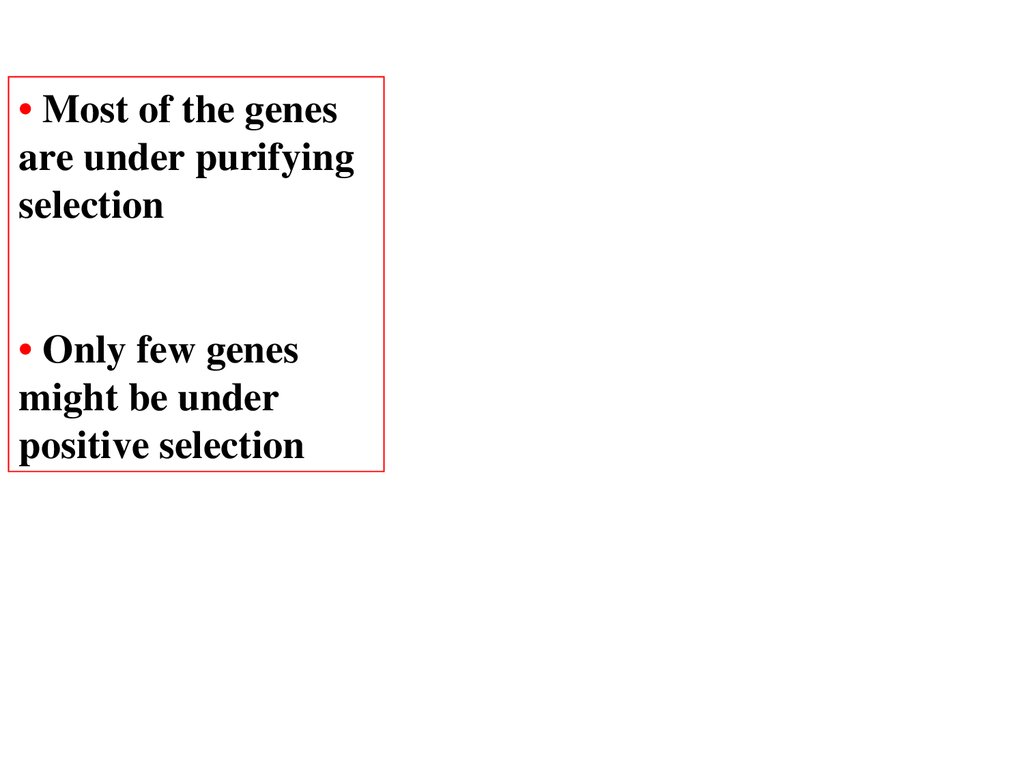
• Most of the genesare under purifying
selection
• Only few genes
might be under
positive selection
36.
• Codon volatility37.
A new concept: codons volatility(Plotkin et al. 2004. nature 428. p.942-945).
• New method recently introduced, the utility of which is still
under debate;
• has interresting consequences on the study of codon variability;
38.
Detecting Selection• If a protein coding region of a nucleotide sequence has undergone
an excess number of aminoacid substitutions, then the region will
on average contain an overabundance of “volatile” codons,
compared with the genome as a whole.
• Using the concept of codon volatility, we can scan an entire
genome to find genes that show significantly more, or less, pressure
for aminoacid substitutions than the genome as a whole.
• If a gene contains many residues under pressure for aa
replacements, then the resulting codons in that gene will on
average exhibit elevated volatility.
• If a gene is under purifying selection not to change its aa, then the
resulting sequence will on average exhibit lower volatility.
Plotkin et al. Nature 428; 942945
39.
Codons volatility2
1
2
3
4
8
7
6
5
3
4
1
8
7
6
5
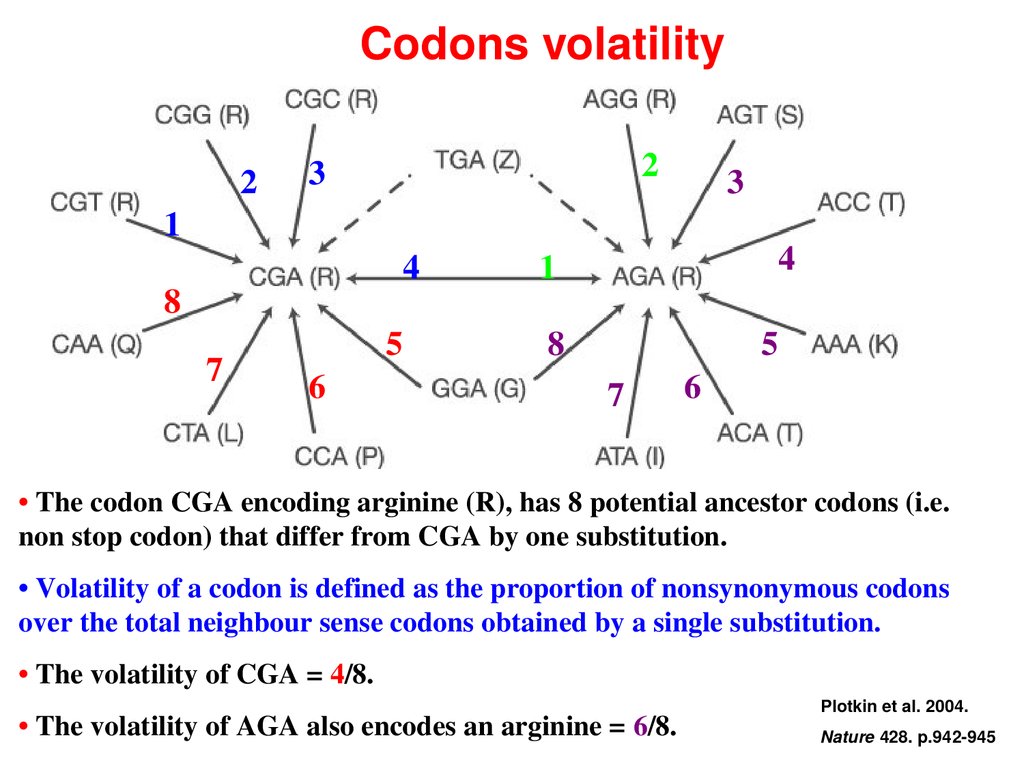
• The codon CGA encoding arginine (R), has 8 potential ancestor codons (i.e.
non stop codon) that differ from CGA by one substitution.
• Volatility of a codon is defined as the proportion of nonsynonymous codons
over the total neighbour sense codons obtained by a single substitution.
• The volatility of CGA = 4/8.
• The volatility of AGA also encodes an arginine = 6/8.
Plotkin et al. 2004.
Nature 428. p.942-945
40.
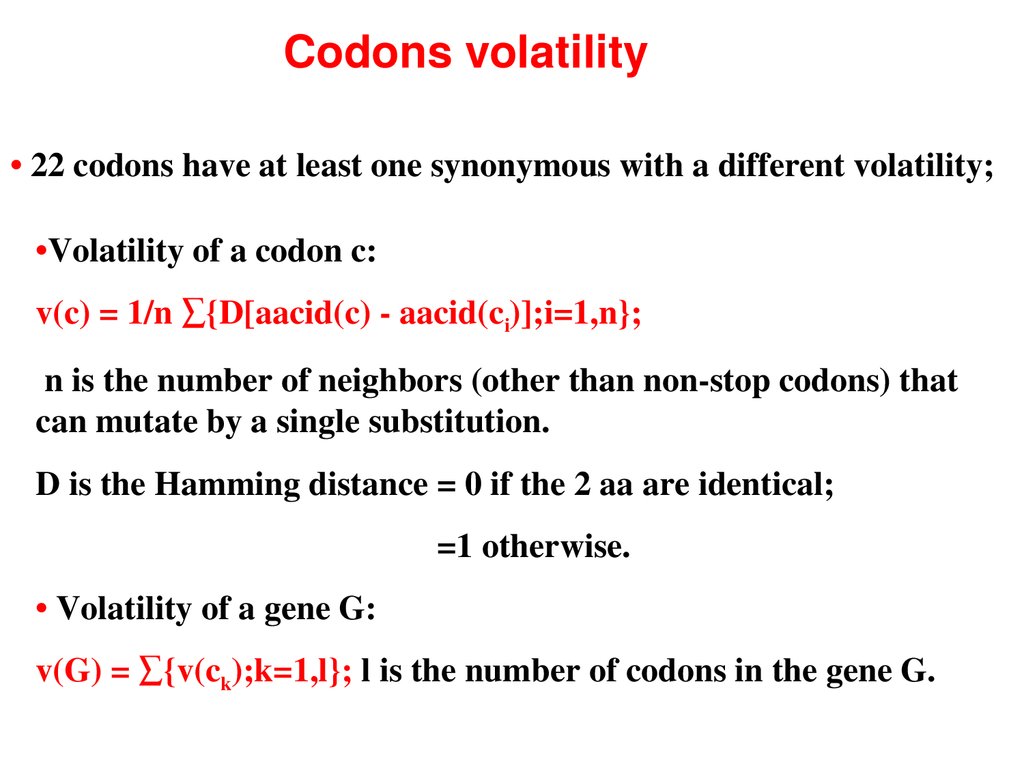
Codons volatility• 22 codons have at least one synonymous with a different volatility;
•Volatility of a codon c:
v(c) = 1/n ∑{D[aacid(c) aacid(ci)];i=1,n};
n is the number of neighbors (other than nonstop codons) that
can mutate by a single substitution.
D is the Hamming distance = 0 if the 2 aa are identical;
=1 otherwise.
• Volatility of a gene G:
v(G) = ∑{v(ck);k=1,l}; l is the number of codons in the gene G.
41.
Codons volatility• Volatility is used to quantify the probability that the most recent
substitution of a site caused an aminoacid change.
• Each gene’s observed volatility is compared with a bootstrap
distribution of alternative synonymous sequences, drawn
according to the background codon usage in the genome,
and its significance statistically assessed.
• Randomization procedure controls for the gene’s length and
aminoacid composition.
• The volatility of a gene G is defined as the sum of the volatility
of its codons.
42.
Codons volatilityVolatility pvalue of G:
• The observed v(G) is compared with a bootstrap distribution of
106 synonymous versions of the gene G.
• In each randomization sample, a nucleotide sequence G’ is
constructed so that it has the same translation as G but whose
codons are drawn randomly according to the relative frequencies
of synonymous codons in the whole genome.
• pvalue for G = proportion of randomized samples;
so that v(G’) > v(G).
• 1p is a pvalue that tests whether a gene is significantly less
volatile than the genome as a whole.
43.
Detecting Selection• A pvalue near zero indicates significantly elevated volatility,
whereas a pvalue near one indicates significantly depressed
volatility.
• The probability that a site’s most recent substitution caused a
nonsynonymous change is:
greater for a site under positive selection;
smaller for a site under negative (purifying) selection.
• http://www.cgr.harvard.edu/volatility
44.
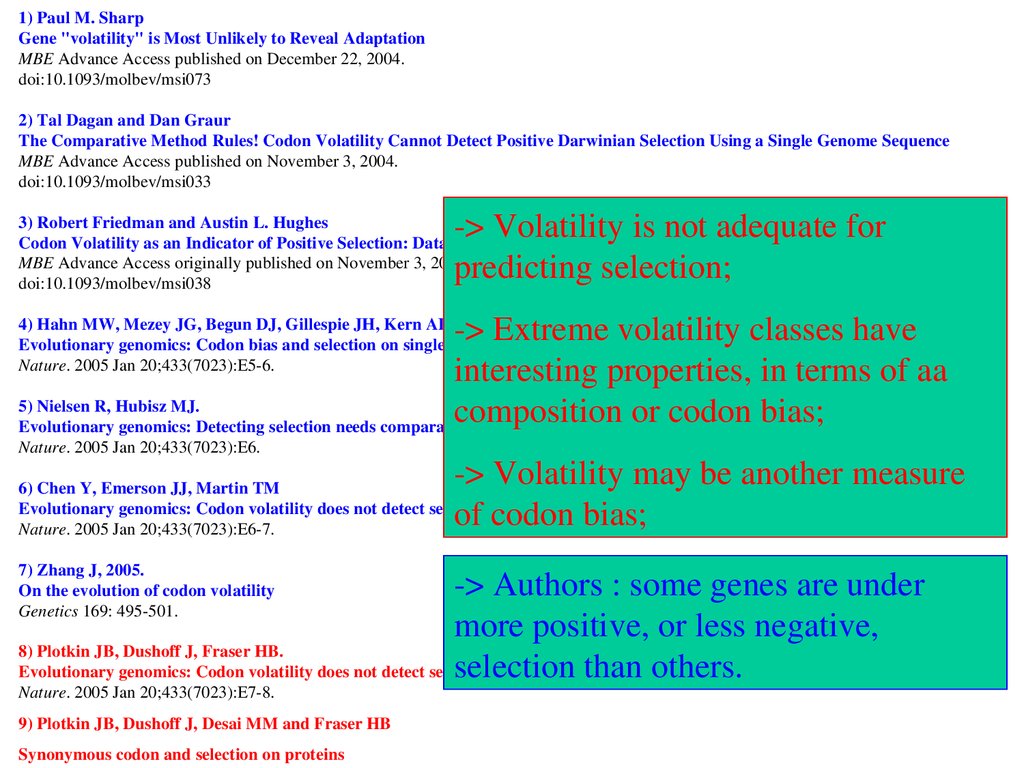
1) Paul M. SharpGene "volatility" is Most Unlikely to Reveal Adaptation
MBE Advance Access published on December 22, 2004.
doi:10.1093/molbev/msi073
2) Tal Dagan and Dan Graur
The Comparative Method Rules! Codon Volatility Cannot Detect Positive Darwinian Selection Using a Single Genome Sequence
MBE Advance Access published on November 3, 2004.
doi:10.1093/molbev/msi033
> Volatility is not adequate for
predicting selection;
3) Robert Friedman and Austin L. Hughes
Codon Volatility as an Indicator of Positive Selection: Data from Eukaryotic Genome Comparisons
MBE Advance Access originally published on November 3, 2004. This version published November 8, 2004.
doi:10.1093/molbev/msi038
> Extreme volatility classes have
interesting properties, in terms of aa
5) Nielsen R, Hubisz MJ.
composition or codon bias;
Evolutionary genomics: Detecting selection needs comparative data.
4) Hahn MW, Mezey JG, Begun DJ, Gillespie JH, Kern AD, Langley CH, Moyle LC.
Evolutionary genomics: Codon bias and selection on single genomes.
Nature. 2005 Jan 20;433(7023):E56.
Nature. 2005 Jan 20;433(7023):E6.
> Volatility may be another measure
of codon bias;
6) Chen Y, Emerson JJ, Martin TM
Evolutionary genomics: Codon volatility does not detect selection.
Nature. 2005 Jan 20;433(7023):E67.
7) Zhang J, 2005.
On the evolution of codon volatility
Genetics 169: 495501.
> Authors : some genes are under
more positive, or less negative,
8) Plotkin JB, Dushoff J, Fraser HB.
selection than others.
Evolutionary genomics: Codon volatility does not detect selection (reply).
Nature. 2005 Jan 20;433(7023):E78.
9) Plotkin JB, Dushoff J, Desai MM and Fraser HB
Synonymous codon and selection on proteins
45.
Codon Volatility (simple substitution model):Codons and volatility under simple substitution model
46.
References:• Ziheng Yang and Rasmus Nielsen (2000)
Estimating synonymous and nonsynonymous substitution rates under realistic
evolutionary models.
Mol Biol Evol. 17:3243.
• Yang Z. and Bielawski J.P. (2000)
Statistical methods for detecting molecular adaptation
Trends Ecol Evol. 15:496503.
• Phylogenetic Analysis by Maximum Likelihood (PAML)
http://abacus.gene.ucl.ac.uk/software/paml.html
• Plotkin JB, Dushoff J, Fraser HB (2004)
Detecting selection using a single genome sequence of M. tuberculosis and P.
falciparum. Nature 428:9425.
• Molecular Evolution; A phylogenetic Approach
Page, RDM and Holmes, EC (Blackwell Science, 2004)
• Sharp, PM & Li WH (1987). NAR 15:p.12811295.
47.
References• Phylogeny programs :
http://evolution.genetics.washington.edu/phylip/sftware.html
• MEGA: http://www.megasoftware.net/
• PAML: http://abacus.gene.ucl.ac.uk/software/paml.html
Books:
• Fundamental concepts of Bioinformatics.
Dan E. Krane and Michael L. Raymer
• Genomes 2 edition. T.A. Brown
• Molecular Evolution; A phylogenetic Approach
Page, RDM and Holmes, EC
Blackwell Science
48.
Molecular evolution: DefinitionsPurifying (negative) selection
• A consequence of gene “drift” through random
mutations, is that many mutations will have deleterious
effects on fitness.
• “Purifying selective force” prevents accumulation of
mutation at important functional sites, resulting in
sequence conservation.
> “Purifying selection” is a natural selection against
deleterious mutations.
> The term is used interchangeably with “negative
selection” or “selection constraints”.
49.
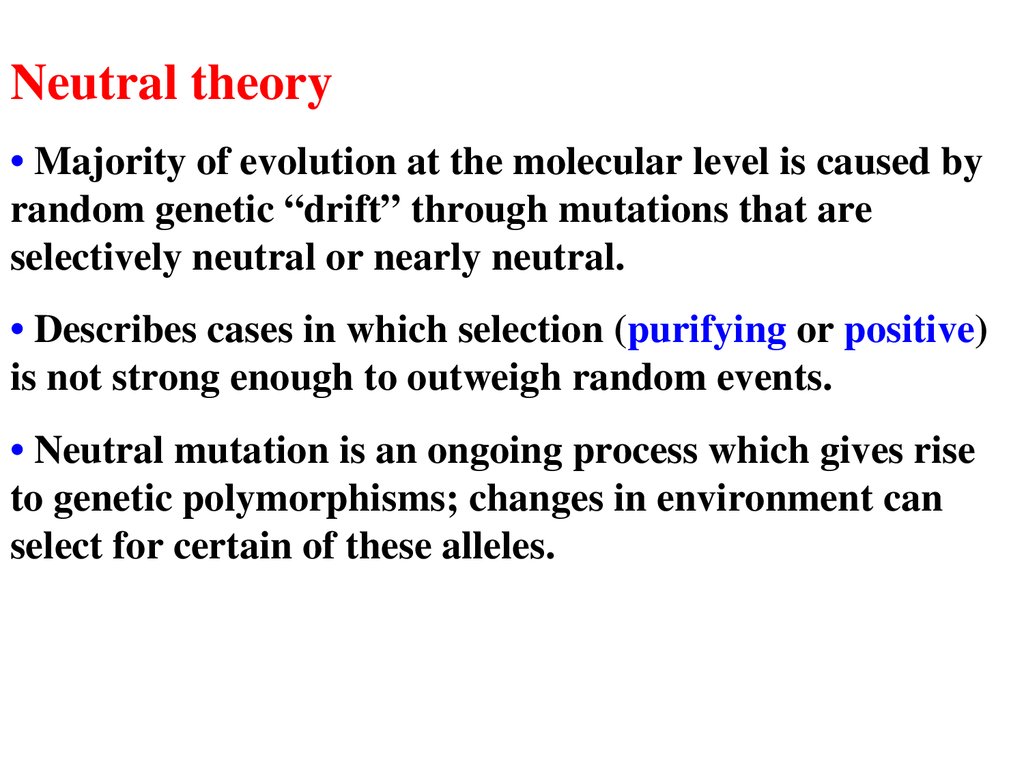
Neutral theory• Majority of evolution at the molecular level is caused by
random genetic “drift” through mutations that are
selectively neutral or nearly neutral.
• Describes cases in which selection (purifying or positive)
is not strong enough to outweigh random events.
• Neutral mutation is an ongoing process which gives rise
to genetic polymorphisms; changes in environment can
select for certain of these alleles.
50.
Positive selection• Positive selection is a darwinian selection fixing
advantageous mutations.
The term is used interchangeably with “molecular
adaptation” and “adaptive molecular evolution”.
• Positive selection can be shown to play a role in some
evolutionary events
• This is demonstrated at the molecular level if the rate of
nonsynonymous mutation at a site is greater than the rate
of synonymous mutation
• Most substitution rates are determined by either neutral
evolution of purifying selection against deleterious
mutations
51.
Molecular evolution• We observe and try to decode the process of
molecular evolution from the perspective of
accumulated differences among related genes
from one or diverse organisms.
• The number of mutations that have occurred
can only be estimated.
Real individual events are blurred by a long
history of changes.
52.
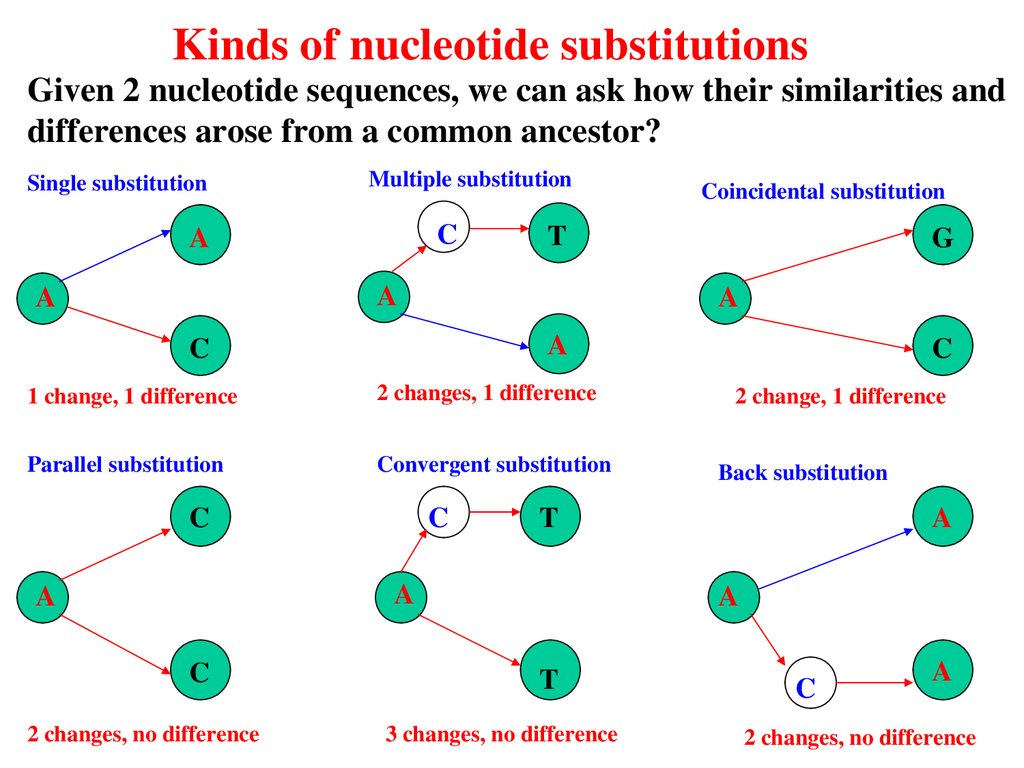
Kinds of nucleotide substitutionsGiven 2 nucleotide sequences, we can ask how their similarities and
differences arose from a common ancestor?
Single substitution
Multiple substitution
C
A
T
A
A
A
1 change, 1 difference
2 changes, 1 difference
Parallel substitution
Convergent substitution
C
C
2 changes, no difference
C
2 change, 1 difference
Back substitution
T
A
C
G
A
C
A
Coincidental substitution
A
A
T
3 changes, no difference
C
A
2 changes, no difference