


 Программирование
Похожие презентации:


, Unified Process, UML")


IT System analysis: system analysis approaches
1. IT System Analysis: System Analysis Approaches
Tutorial by Agnieszka Stachowiak2. 3rd assignment
Let’s continue3RD ASSIGNMENT
3. GOAL
Develop the model of the system analyzedSteps:
Develop structure draft
Discuss structure draft
Add details
Design final structure of the system
4. METHODOLOGY
Use UML to develop:Use case diagram
Class diagram
Object diagram
State diagram
Activity diagram
Sequence diagram
Collaboration diagram
Component diagram
Deployment diagram
* suggestion: 3 subsequent classes to complete the assignment
5. Introduction
Modeling: drawing a flowchart listing the stepscarried out by an application.
Why do we use modeling?
Defining a model makes it easier to break up a
complex application or a huge system into simple,
discrete pieces that can be individually studied. We
can focus more easily on the smaller parts of a
system and then understand the "big picture."
The reasons behind modeling can be summed up
in two words:
Readability
Reusability
5
6. What is UML?
The Unified Modeling Language (UML) is astandard language for specifying, visualizing,
constructing, and documenting the artifacts of
software systems, as well as for business modeling
and other non-software systems. The UML is a very
important part of developing object oriented software
and the software development process. The UML
uses graphical notations to express the design of
software projects. Using the UML helps project
teams communicate, explore potential designs, and
validate the architectural design of the software.
6
7. The UML diagrams categories:
StaticDynamic
Use case diagram
Class diagram
Object diagram
State diagram
Activity diagram
Sequence diagram
Collaboration diagram
Implementation
Component diagram
Deployment diagram
UML Diagrams
7
8. Use Case Diagram
The Use case diagram is used to identify the primary elementsand processes that form the system. The primary elements are
termed as "actors" and the processes are called "use cases."
The Use case diagram shows which actors interact with each
use case.
UML Use Case Diagrams (UCDs) can be used to describe
the functionality of a system, they capture the functional
aspects and business process in the system.
UCDs have only 4 major elements: The actors that the
system you are describing interacts with, the system itself,
the use cases, or services, that the system knows how to
perform, and the lines that represent relationships between
these elements.
8
9. Example:
System boundary: A system boundary definesthe scope of what a system will be. A system
boundary of a use case diagram defines the limits
of the system.
9
10. Example:
1011. Example
UML Diagrams11
12. Class Diagram
Definition: A class diagram is a diagram showing acollection of classes and interfaces, along with the
collaborations and relationships among classes and
interfaces.
When you designed the use cases, you must have
realized that the use cases talk about "what are the
requirements" of a system?
The aim of designing classes is to convert this "what"
to a "how" for each requirement. Each use case is
further analyzed and broken up into atomic
components that form the basis for the classes that
need to be designed.
12
13.
UML DiagramsClass
Name
Window
Attributes
size: Size
visibility: boolean
Operations
display()
hide()
13
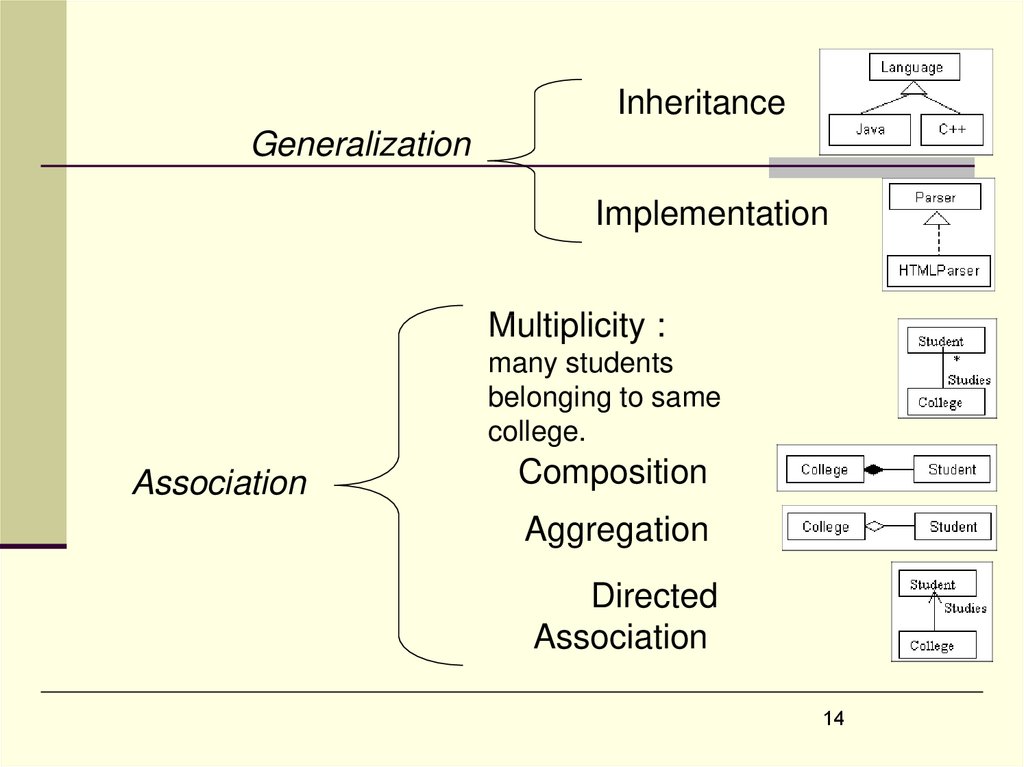
14.
InheritanceGeneralization
Implementation
Multiplicity :
many students
belonging to same
college.
Association
Composition
Aggregation
Directed
Association
14
15. Example:
1516. Object Diagrams in UML
In a live application classes are not directly used, butinstances or objects of these classes are used. A
pictorial representation of the relationships between
these instantiated classes at any point of time (called
objects) is called an "Object diagram."
It looks very similar to a class diagram, and uses the
similar notations to denote relationships.
It reflects the picture of how classes interact with
each others at runtime. and in the actual system, how
the objects created at runtime are related to the
classes.
shows this relation between the instantiated classes
and the defined class, and the relation between these
objects.
16
17. Example:
1718. State Diagram
BasicsWe are now taking a deeper look at system
dynamics.
Some of the dynamic behavior will be specified in
terms of sequencing / timing
Some of the dynamic behavior will be specified in
terms of functions (transformations / computations)
State diagrams are used to describe the behavior of
a system. State diagrams describe all of the possible
states of an object as events occur.
It is important to note that having a State diagram for
your system is not a mandatory, but must be defined
only on a need basis (to understand the behavior of
the object through the entire system)
18
19. Elements of a State diagram
Initial State: This shows the starting pointor first activity of the flow
State: Represents the state of object at an
instant of time. In a state diagram, there will
be multiple of such symbols, one for each
state of the Object
Transition: An arrow indicating the Object
to transition from one state to the other. The
actual trigger event and action causing the
transition are written beside the arrow.
UML Diagrams
19
20.
Self Transitions: Sometimes an object isrequired to perform some action when it
recognizes an event, but it ends up in the
same state it started in
Event and Action: A trigger that causes a
transition to occur is called as an event or
action.
Final State: The end of the state diagram is
shown by a bull's eye symbol, also called a
final state.
20
21. Example:
/get first item[not all items checked]
/get next item
[all items checked &&
all items available]
Dispatching
Checking
do/initiate
do/check item
delivery
[all items checked &&
some items not in
stock ]
Item received
[some items not in stock]
Waiting
Delivered
Delivered
21
22. Activity Diagram
The easiest way to visualize an Activity diagram is to thinkof a flowchart of a code.
The flowchart is used to depict the business logic flow and
the events that cause decisions and actions in the code to
take place.
An Activity diagram is a dynamic diagram that shows the
activity and the event that causes the object to be in the
particular state.
The activity diagram is an extension of the state diagram.
State diagrams highlight states and represent activities as
arrows between states. Activity diagrams put the spotlight
on the activities
The Activity Diagrams are often used to model the paths
though a use case. And to document the logic of a single
use case.
22
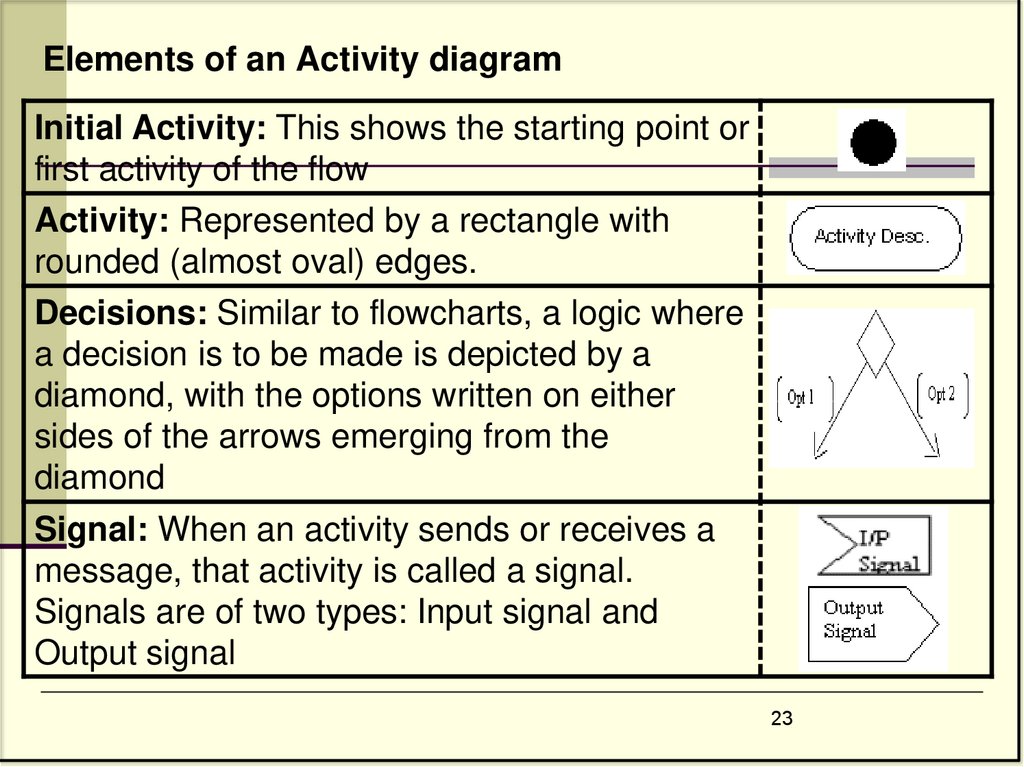
23.
Elements of an Activity diagramInitial Activity: This shows the starting point or
first activity of the flow
Activity: Represented by a rectangle with
rounded (almost oval) edges.
Decisions: Similar to flowcharts, a logic where
a decision is to be made is depicted by a
diamond, with the options written on either
sides of the arrows emerging from the
diamond
Signal: When an activity sends or receives a
message, that activity is called a signal.
Signals are of two types: Input signal and
Output signal
23
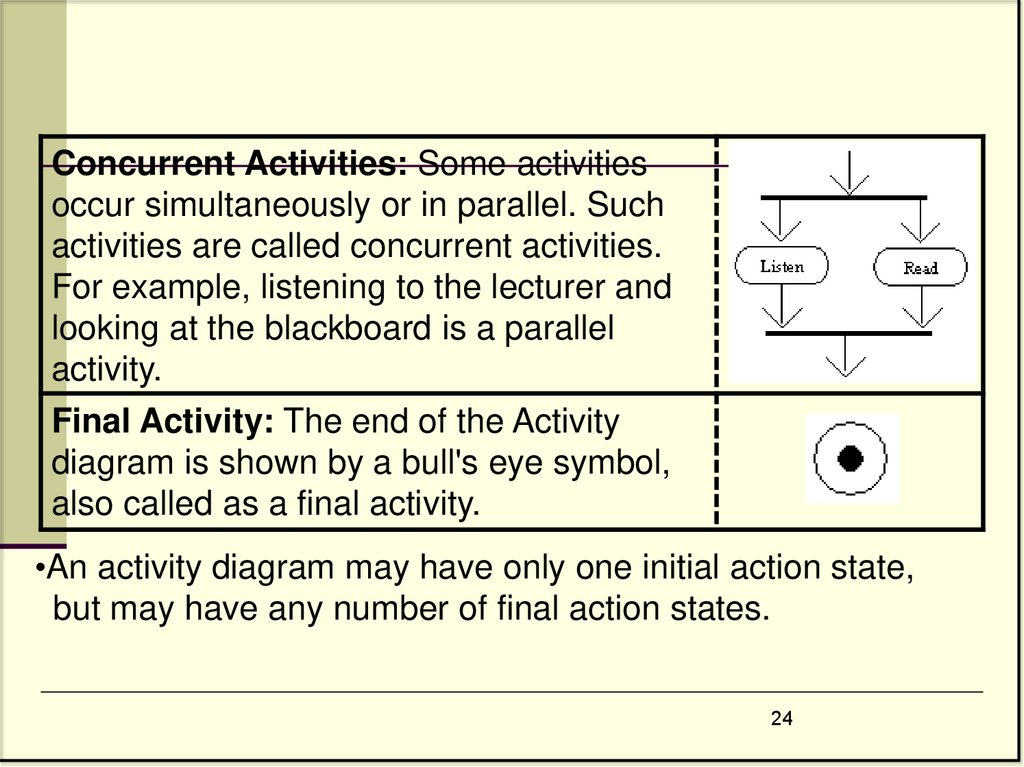
24.
Concurrent Activities: Some activitiesoccur simultaneously or in parallel. Such
activities are called concurrent activities.
For example, listening to the lecturer and
looking at the blackboard is a parallel
activity.
Final Activity: The end of the Activity
diagram is shown by a bull's eye symbol,
also called as a final activity.
•An activity diagram may have only one initial action state,
but may have any number of final action states.
24
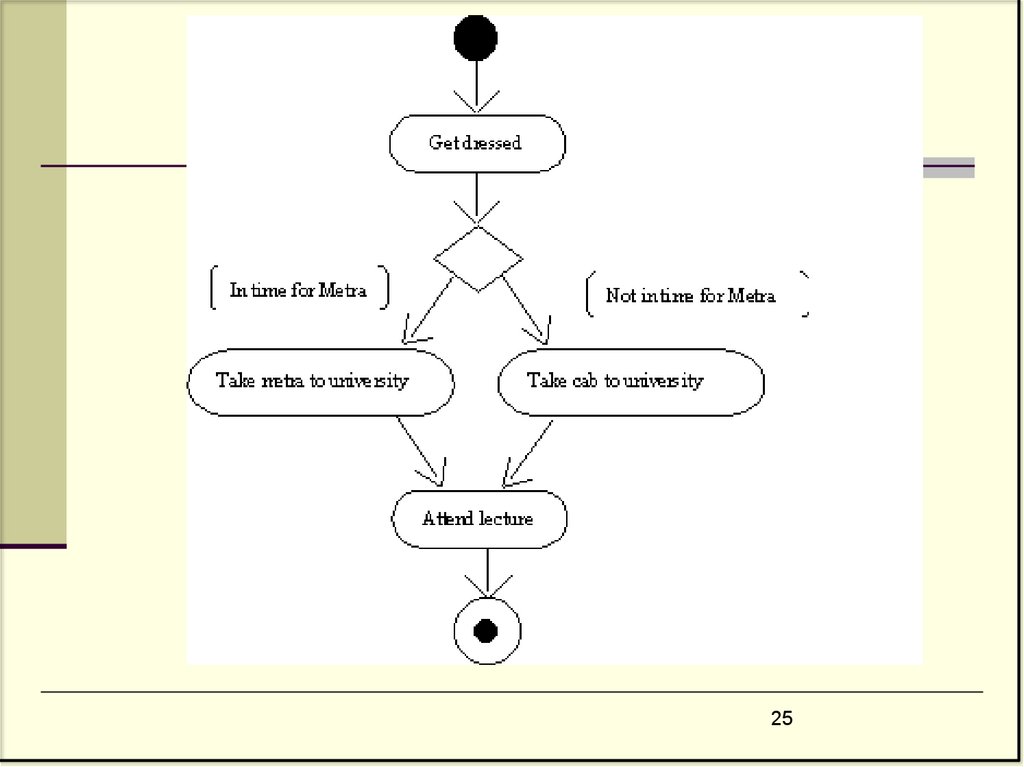
25.
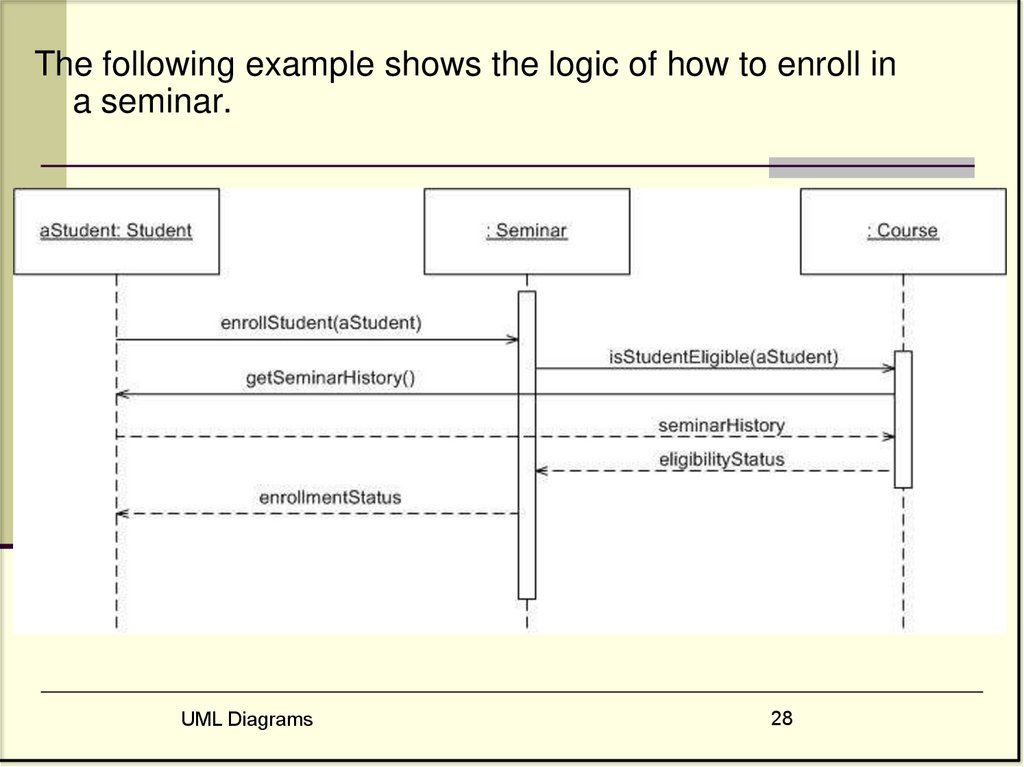
2526. Sequence Diagram in UML
A sequence diagram captures the behavior of a single scenario.The diagram shows a number of example objects and the
messages that are passed between these objects within the use
case.
A Sequence diagram depicts the sequence of actions that occur
in a system.
The invocation of methods in each object, and the order in
which the invocation occurs is captured in a Sequence diagram.
A Sequence diagram is two-dimensional in nature. On the
horizontal axis, it shows the life of the object that it represents,
while on the vertical axis, it shows the sequence of the creation
or invocation of these objects.
26
27.
Elements of a Sequence DiagramA Sequence diagram consists of the following
behavioral elements:
Object: The primary element involved in a
sequence diagram is an Object. A
Sequence diagram consists of sequences
of interaction among different objects over
a period of time.
Message: The interaction between
different objects in a sequence diagram is
represented as messages. A messages is
represented by a directed arrow.
UML Diagrams
27
28.
The following example shows the logic of how to enroll ina seminar.
UML Diagrams
28
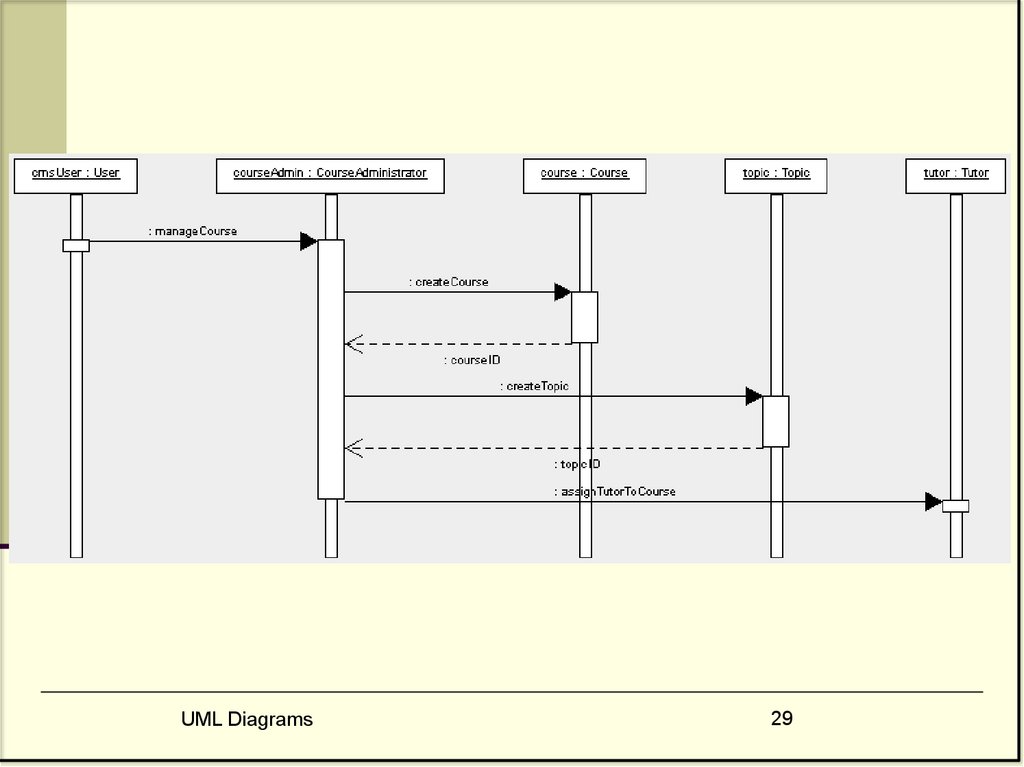
29.
UML Diagrams29
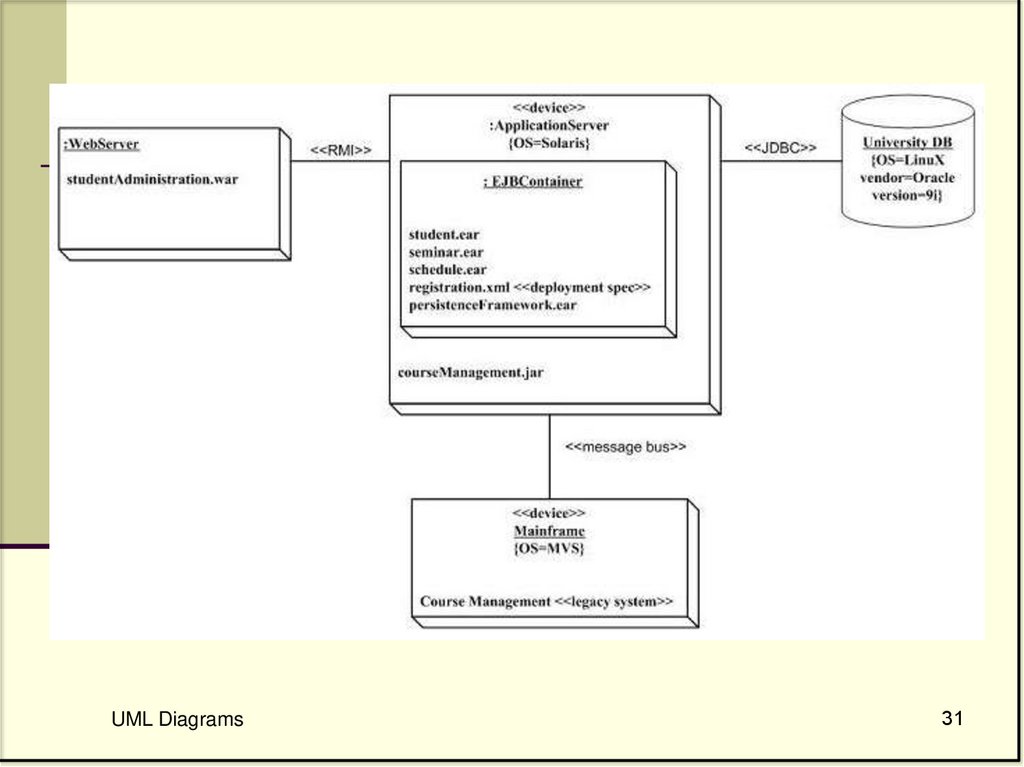
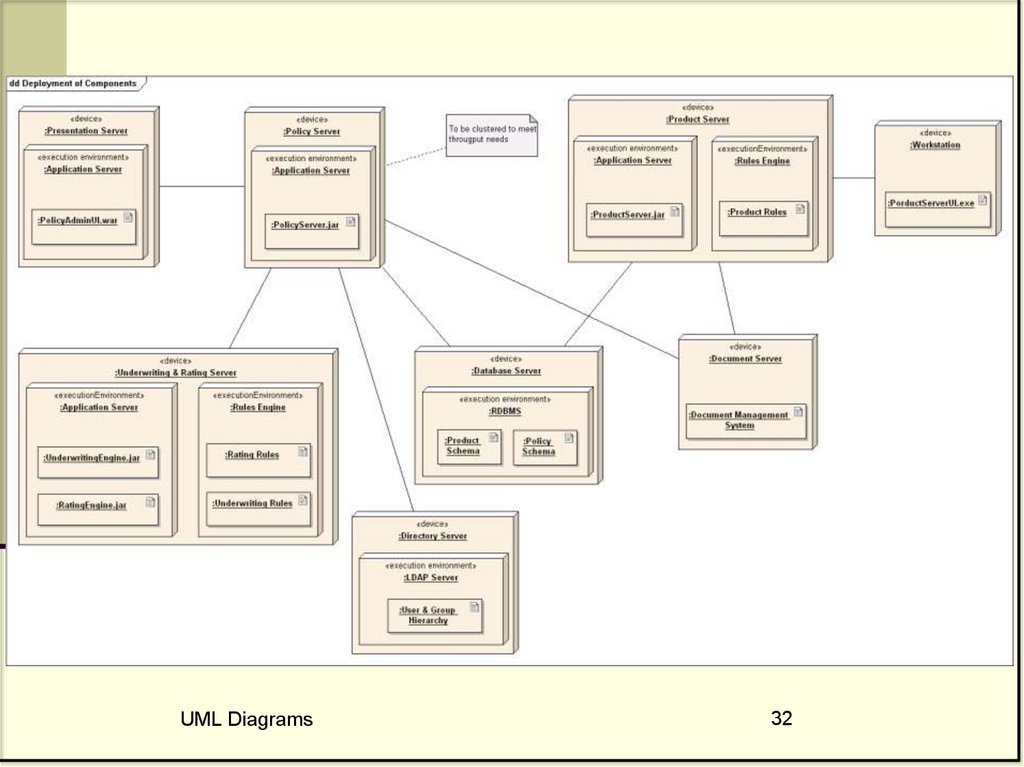
30.
Deployment DiagramsA deployment diagram in the Unified Modeling Language models
the physical deployment of artifacts on nodes.[1] To describe a web site, for
example, a deployment diagram would show what hardware components
("nodes") exist (e.g., a web server, an application server, and a database
server), what software components ("artifacts") run on each node (e.g., web
application, database), and how the different pieces are connected (e.g.
JDBC, REST, RMI).
The nodes appear as boxes, and the artifacts allocated to each node
appear as rectangles within the boxes. Nodes may have subnodes, which
appear as nested boxes. A single node in a deployment diagram may
conceptually represent multiple physical nodes, such as a cluster of
database servers.
There are two types of Nodes:
Device Node
Execution Environment Node
Device nodes are physical computing resources with processing memory
and services to execute software, such as typical computers or mobile
phones. An execution environment node (EEN) is a software computing
resource that runs within an outer node and which itself provides a service
to host and execute other executable software elements.
UML Diagrams
30
31.
UML Diagrams31
32.
UML Diagrams32
33. EXPECTED RESULTS
9 UML DiagramsComprehensive model of IT system