


 Экономика
Похожие презентации:


Supply and demand
1.
SUPPLY ANDDEMAND
Alex Volkov “ИЭУИС” 1-11
2.
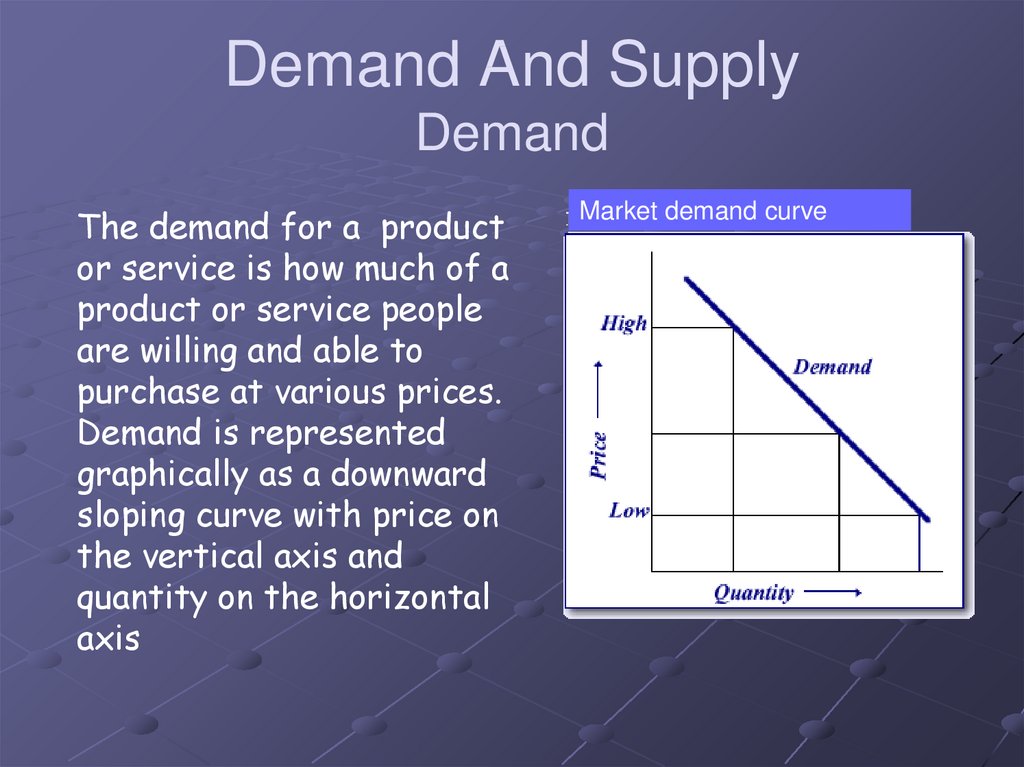
Demand And SupplyDemand
The demand for a product
or service is how much of a
product or service people
are willing and able to
purchase at various prices.
Demand is represented
graphically as a downward
sloping curve with price on
the vertical axis and
quantity on the horizontal
axis
Market demand curve
3.
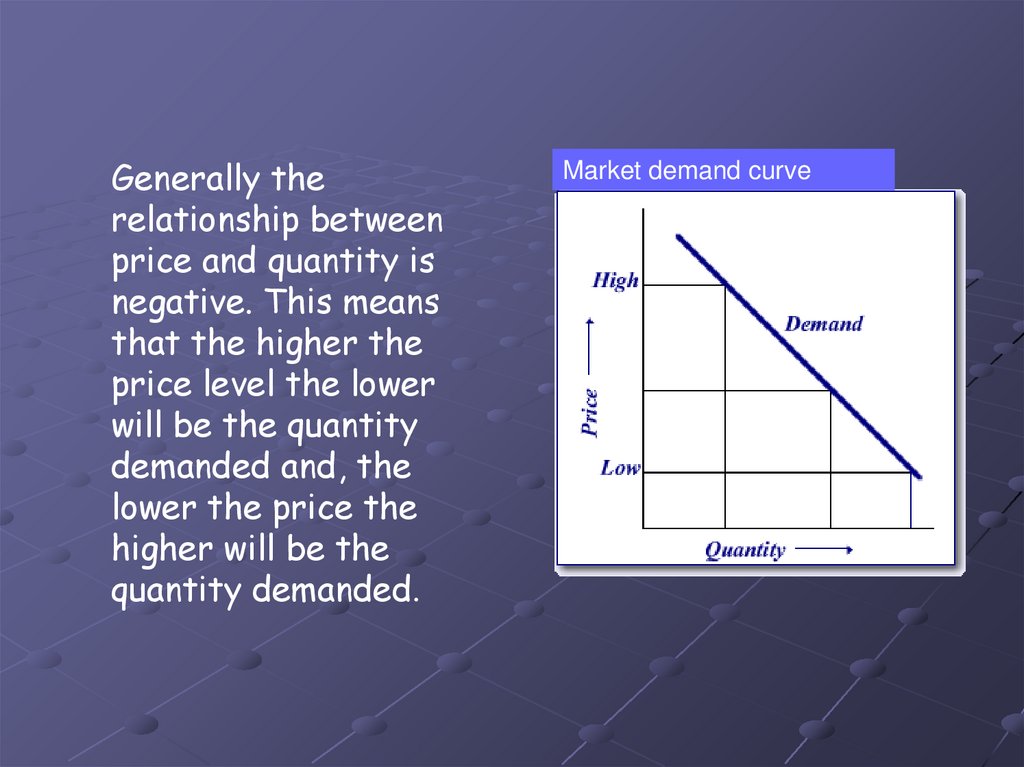
Generally therelationship between
price and quantity is
negative. This means
that the higher the
price level the lower
will be the quantity
demanded and, the
lower the price the
higher will be the
quantity demanded.
Market demand curve
4.
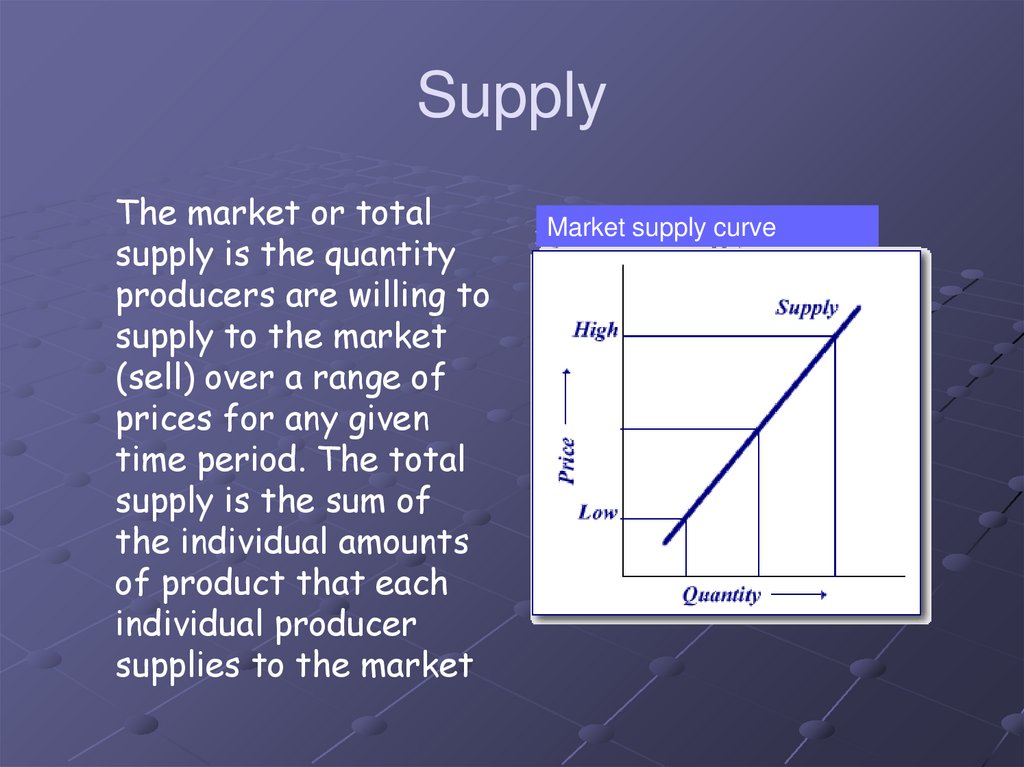
SupplyThe market or total
supply is the quantity
producers are willing to
supply to the market
(sell) over a range of
prices for any given
time period. The total
supply is the sum of
the individual amounts
of product that each
individual producer
supplies to the market
Market supply curve
5.
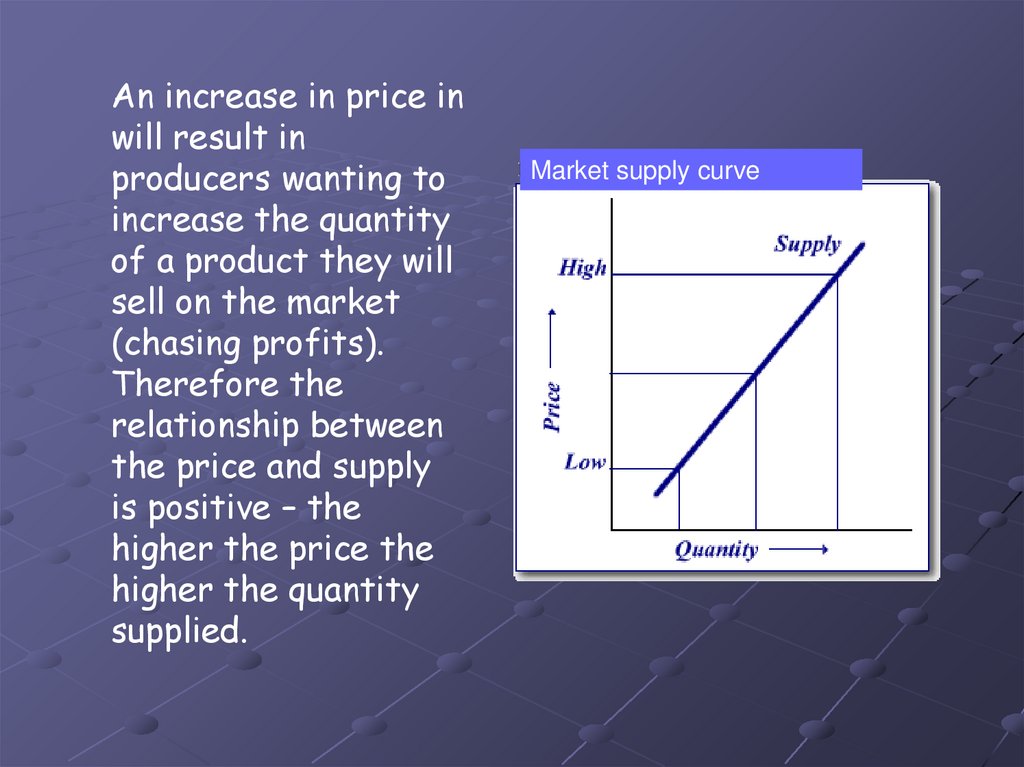
An increase in price inwill result in
producers wanting to
increase the quantity
of a product they will
sell on the market
(chasing profits).
Therefore the
relationship between
the price and supply
is positive – the
higher the price the
higher the quantity
supplied.
Market supply curve
6.
Equilibrium PriceMarket equilibrium
If we plot both demand and
supply curves, where they
intersect we have the market
equilibrium. This equilibrium
gives us the market price (P)
and the quantity sold (Q).
Equilibrium
7.
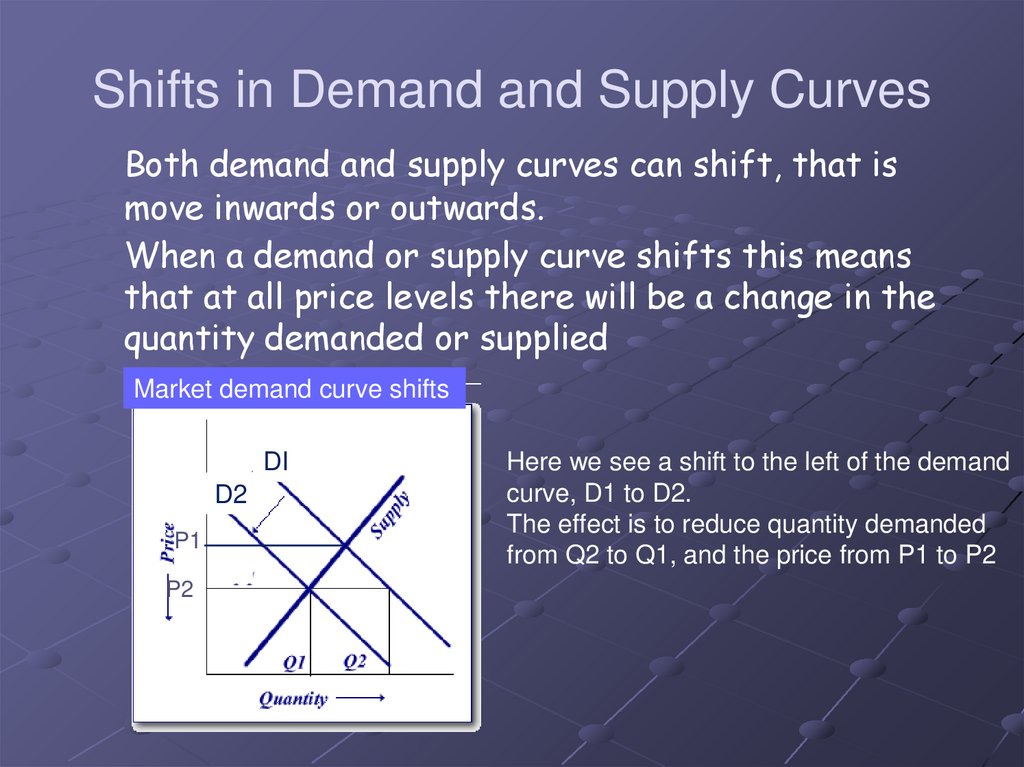
Shifts in Demand and Supply CurvesBoth demand and supply curves can shift, that is
move inwards or outwards.
When a demand or supply curve shifts this means
that at all price levels there will be a change in the
quantity demanded or supplied
Market demand curve shifts
DI
D2
P1
P2
Here we see a shift to the left of the demand
curve, D1 to D2.
The effect is to reduce quantity demanded
from Q2 to Q1, and the price from P1 to P2
8.
Factors that Shift the Demand Curve1. Change in consumer real incomes.
Because a consumer's demand for goods and services is limited by
income, higher income levels allow the consumer to purchase more
products, when this happens the demand curve shifts to the right.
When the opposite occurs, a decrease in real income, this shifts the
demand curve to the left. When the economy enters a recession and more
people become unemployed and so incomes fall, the demand for many
goods and services shifts to the left.
9.
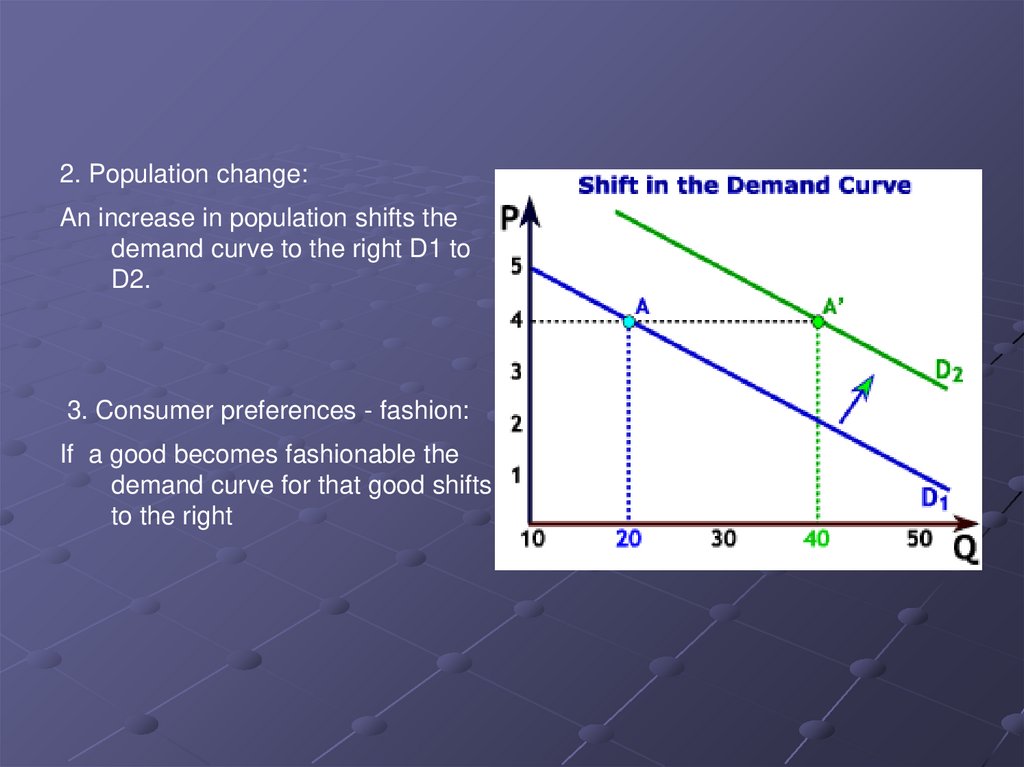
2. Population change:An increase in population shifts the
demand curve to the right D1 to
D2.
3. Consumer preferences - fashion:
If a good becomes fashionable the
demand curve for that good shifts
to the right
10.
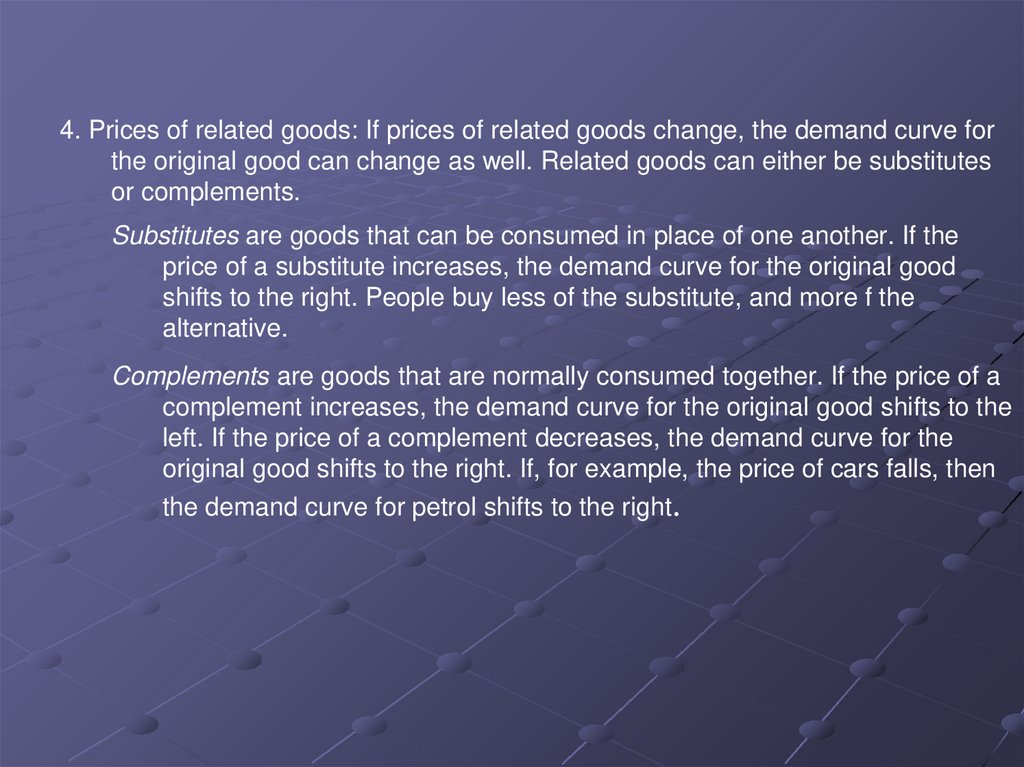
4. Prices of related goods: If prices of related goods change, the demand curve forthe original good can change as well. Related goods can either be substitutes
or complements.
Substitutes are goods that can be consumed in place of one another. If the
price of a substitute increases, the demand curve for the original good
shifts to the right. People buy less of the substitute, and more f the
alternative.
Complements are goods that are normally consumed together. If the price of a
complement increases, the demand curve for the original good shifts to the
left. If the price of a complement decreases, the demand curve for the
original good shifts to the right. If, for example, the price of cars falls, then
the demand curve for petrol shifts to the right.
11.
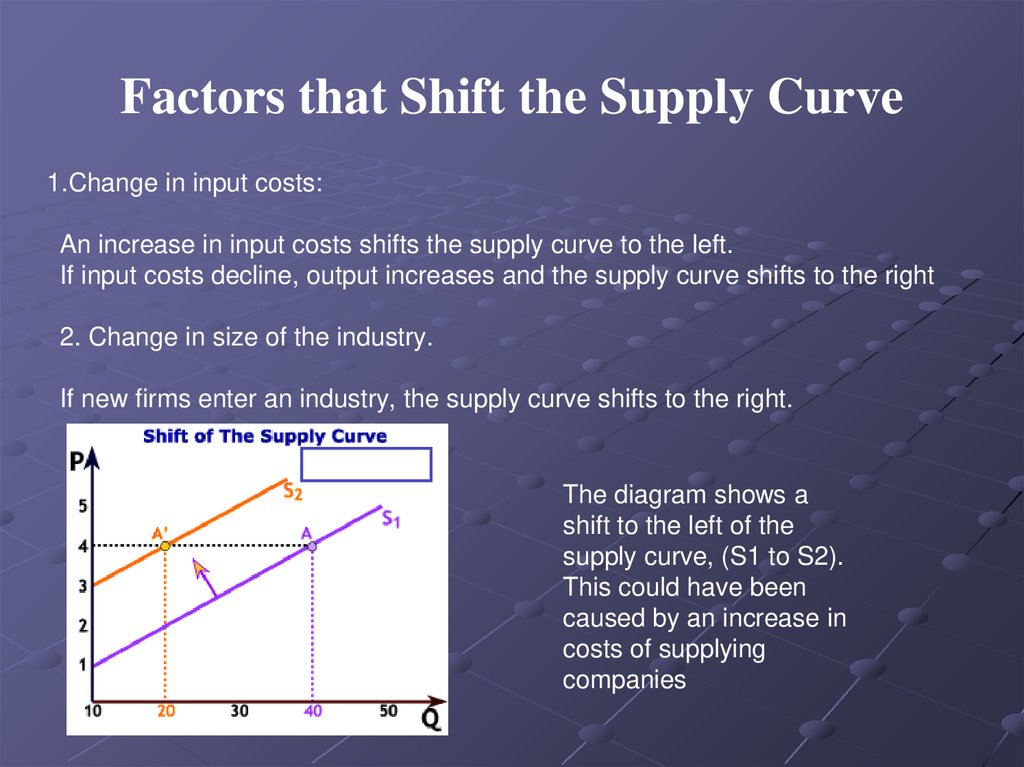
Factors that Shift the Supply Curve1.Change in input costs:
An increase in input costs shifts the supply curve to the left.
If input costs decline, output increases and the supply curve shifts to the right
2. Change in size of the industry.
If new firms enter an industry, the supply curve shifts to the right.
The diagram shows a
shift to the left of the
supply curve, (S1 to S2).
This could have been
caused by an increase in
costs of supplying
companies
12.
3. Improvements in technology:An improvement in technology shifts the supply curve to the
right. Technological progress allows firms to produce a
given item at a lower cost. With the advancement of
technology, the supply curve for goods and services
shifts to the right.
4. Effects of weather, this is especially important for
agricultural products
Good weather followed by a good harvest, shifts supply to
the right, poor weather leading to a poor harvest shifts
supply to the left
13.
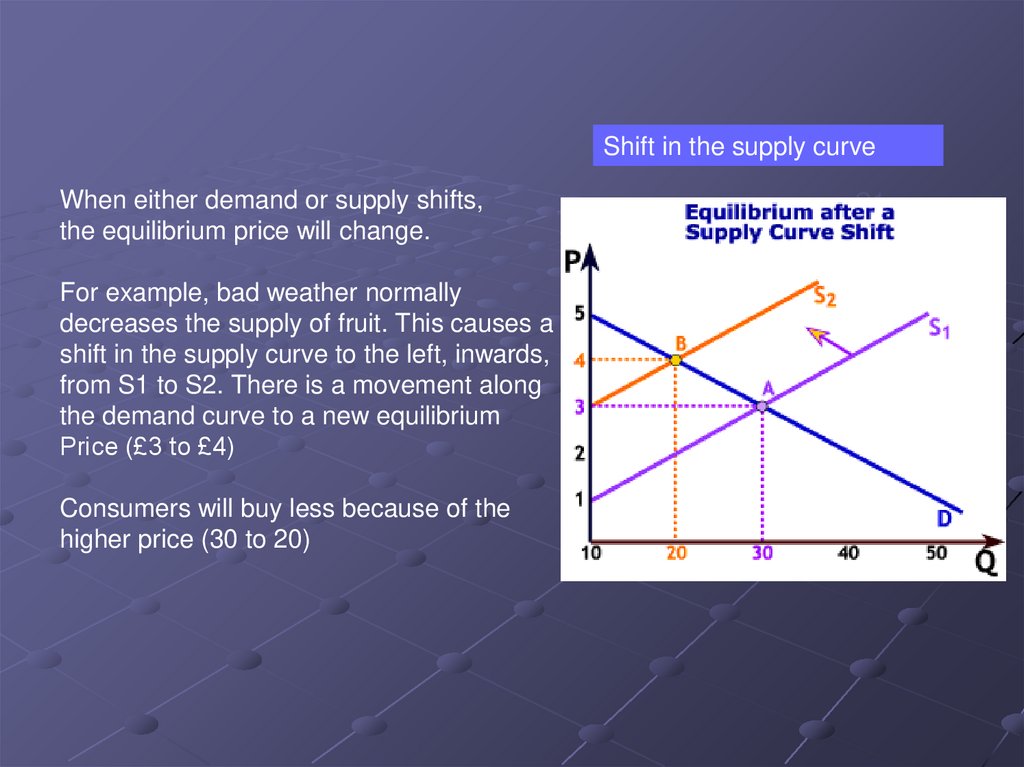
Shift in the supply curveWhen either demand or supply shifts,
the equilibrium price will change.
For example, bad weather normally
decreases the supply of fruit. This causes a
shift in the supply curve to the left, inwards,
from S1 to S2. There is a movement along
the demand curve to a new equilibrium
Price (£3 to £4)
Consumers will buy less because of the
higher price (30 to 20)
S1
S
14.
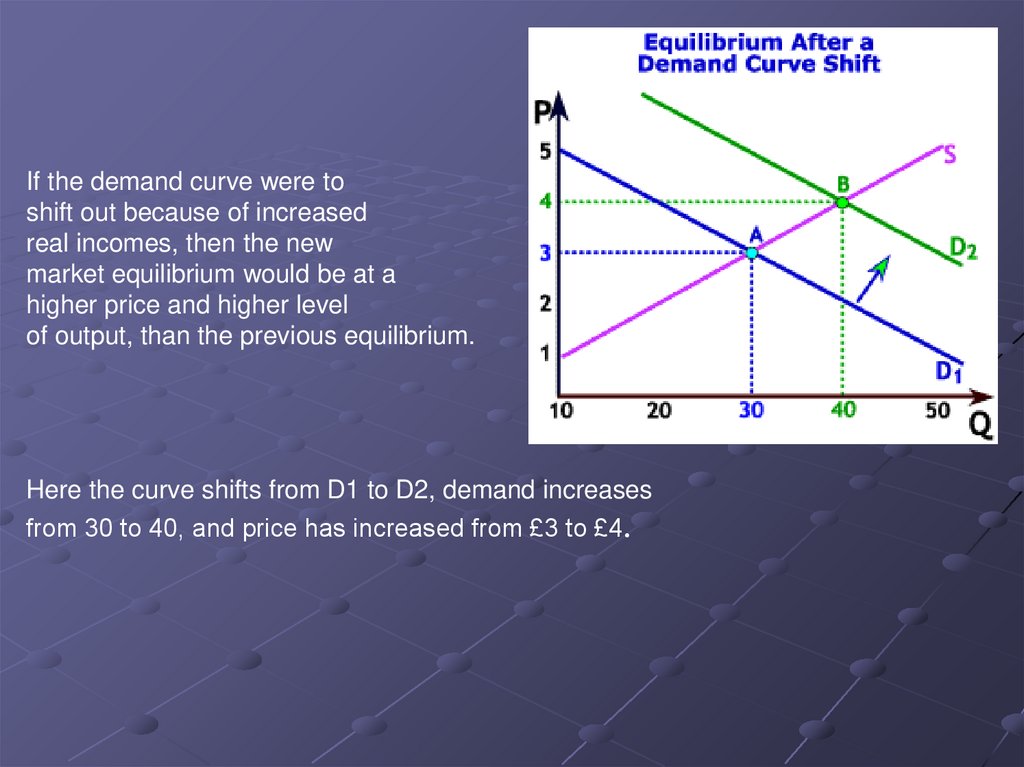
If the demand curve were toshift out because of increased
real incomes, then the new
market equilibrium would be at a
higher price and higher level
of output, than the previous equilibrium.
Here the curve shifts from D1 to D2, demand increases
from 30 to 40, and price has increased from £3 to £4.
15.
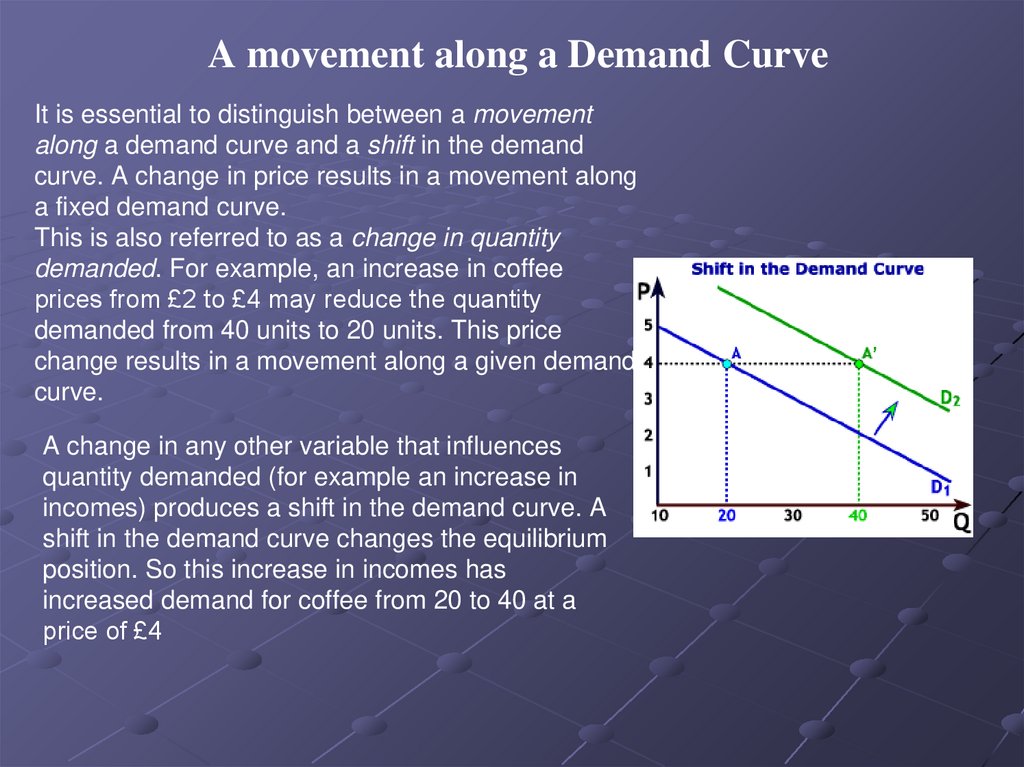
A movement along a Demand CurveIt is essential to distinguish between a movement
along a demand curve and a shift in the demand
curve. A change in price results in a movement along
a fixed demand curve.
This is also referred to as a change in quantity
demanded. For example, an increase in coffee
prices from £2 to £4 may reduce the quantity
demanded from 40 units to 20 units. This price
change results in a movement along a given demand
curve.
A change in any other variable that influences
quantity demanded (for example an increase in
incomes) produces a shift in the demand curve. A
shift in the demand curve changes the equilibrium
position. So this increase in incomes has
increased demand for coffee from 20 to 40 at a
price of £4
16.
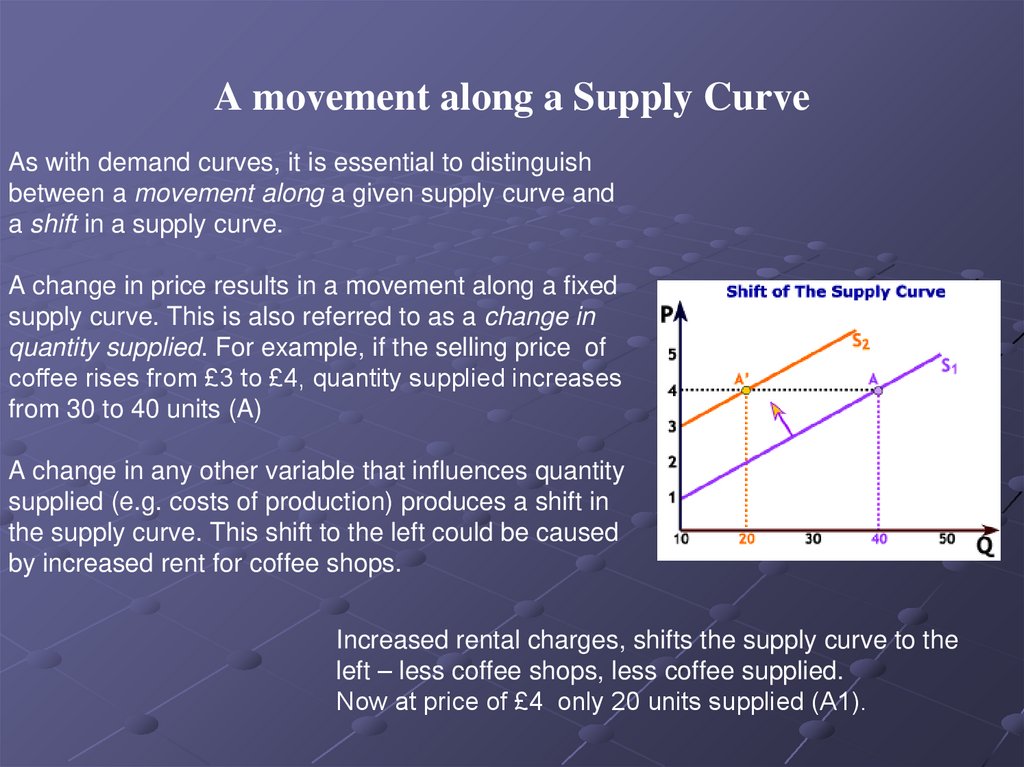
A movement along a Supply CurveAs with demand curves, it is essential to distinguish
between a movement along a given supply curve and
a shift in a supply curve.
A change in price results in a movement along a fixed
supply curve. This is also referred to as a change in
quantity supplied. For example, if the selling price of
coffee rises from £3 to £4, quantity supplied increases
from 30 to 40 units (A)
A change in any other variable that influences quantity
supplied (e.g. costs of production) produces a shift in
the supply curve. This shift to the left could be caused
by increased rent for coffee shops.
Increased rental charges, shifts the supply curve to the
left – less coffee shops, less coffee supplied.
Now at price of £4 only 20 units supplied (A1).