


")
")


 Механика
Похожие презентации:


Unit 6: Bending\. Shear and Moment Diagrams
1.
Unit 6: Bending2. Shear and Moment Diagrams
Members with support loadings appliedperpendicular to their longitudinal axis are called
beams.
Beams classified according to the way they are
supported.
3. Shear and Moment Diagrams
Shear and moment functions can be plotted ingraphs called shear and moment diagrams.
In order to properly design a beam, it is important to
know the variation of the shear force and moment
along its axis to find the points where these values
are a maximum.
4. Example 6.1
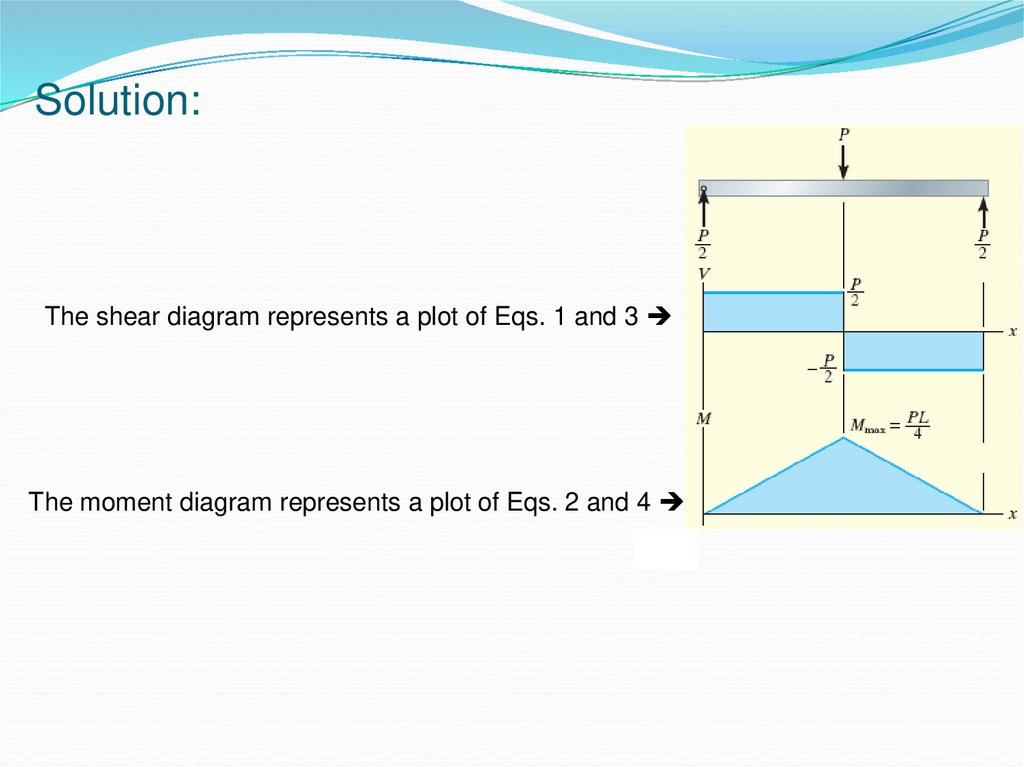
Draw the shear and moment diagrams for the beam shown.Solution:
From the free-body diagram of the left segment, we apply the equilibrium equations,
Fy 0;
M 0;
P
2
P
M x
2
V
(1)
(2)
Left segment of the beam extending a distance x within
region BC is as follow,
P
P
Fy 0;
P V 0 V
(3)
2
2
L P
P
M 0
M P x x M L-x (4)
2 2
2
5.
Solution:The shear diagram represents a plot of Eqs. 1 and 3
The moment diagram represents a plot of Eqs. 2 and 4
6. EXAMPLE 2
Draw the shear and moment diagrams for the beam shown inFig. 6–12a.
Chapter 6: Bending
Mechanics of Material 7th Edition
Copyright
©2014 Pearson Education, All Rights Reserved
© 2008 Pearson Education South Asia Pte
Ltd
7. EXAMPLE 2 (cont.)
Solutions• The reactions are shown on the
free-body diagram in Fig. 6–12b.
• The shear at each end is plotted first,
Fig. 6–12c. Since there is no
distributed load on the beam,
the shear diagram has zero slope
and is therefore a horizontal line.
Chapter 6: Bending
Mechanics of Material 7th Edition
Copyright
©2014 Pearson Education, All Rights Reserved
© 2008 Pearson Education South Asia Pte
Ltd
8. EXAMPLE 2 (cont.)
Solutions• The moment is zero at each end,
Fig. 6–12d. The moment diagram
has a constant negative slope of
-M0/2L since this is the shear in the
beam at each point. Note that the
couple moment causes a jump in the
moment diagram at the beam’s
center, but it does not affect the
shear diagram at this point.
Chapter 6: Bending
Mechanics of Material 7th Edition
Copyright
©2014 Pearson Education, All Rights Reserved
© 2008 Pearson Education South Asia Pte
Ltd
9. Example 6.2
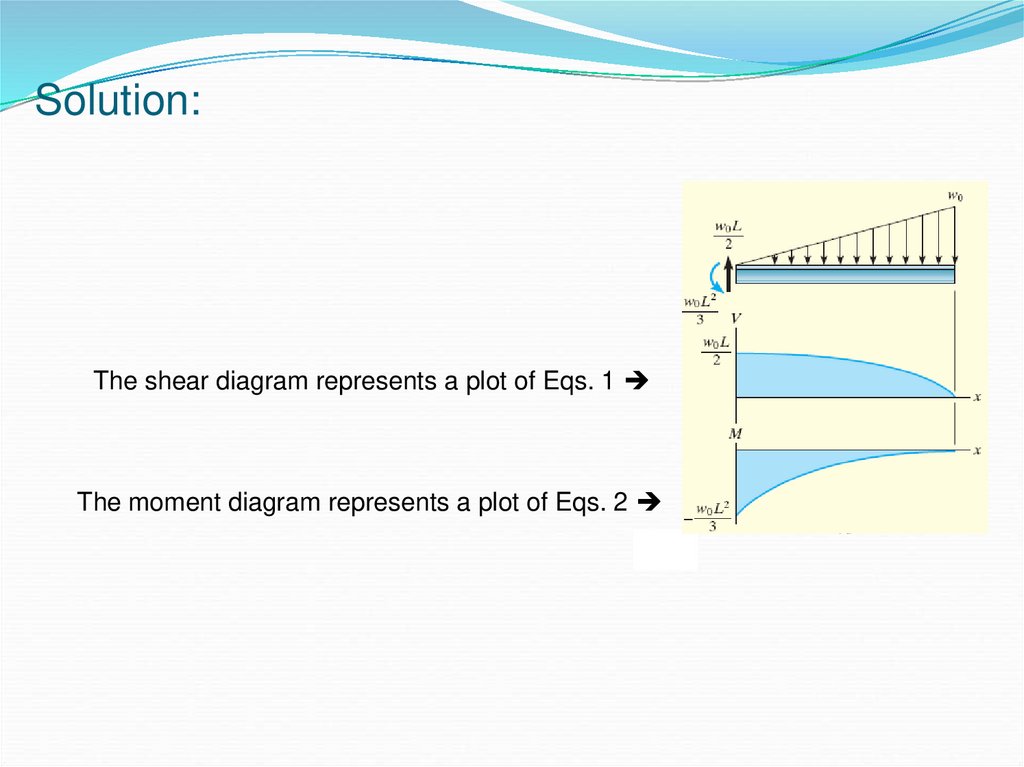
Draw the shear and moment diagrams for the beam shown.Solution:
The distributed load is replaced by its resultant force and the reactions.
Intensity of the triangular load at the section is found by
proportion,
w w0 or w w0
x
L
L
Resultant of the distributed loading is determined from the
area under the diagram,
Fy 0;
M 0;
w0 L 1 w0 x
w 2
2
x V 0 V 0 L x (1)
2
2 L
2L
w0 L2 w0 L
x 1 w0 x x 1 x M 0
3
2
2 L 3
(2)
10.
Solution:The shear diagram represents a plot of Eqs. 1
The moment diagram represents a plot of Eqs. 2
11. Example 6.3
Draw the shear and moment diagrams for the beam shown.Solution:
2 regions of x must be considered in order to describe the shear and moment
functions for the entire beam.
0 x1 5 m,
Fy 0;
M 0;
5 m x1 10 m,
Fy 0;
M 0;
5.75 V 0 V 5.75 kN
(1)
80 5.75 x1 M 0 M 5.75 x1 80 kNm
(2)
5.75 15 5 x2 5 V 0 V 15.75 5 x2 kN (3)
x 5
80 5.75 x1 15 5 x2 5 2
M 0
2
M 2.5 x22 15.75 x2 92.5 kNm (4)
12.
Solution:The shear diagram represents a plot of Eqs. 1 and 3
The moment diagram represents a plot of Eqs. 2 and 4
13. Graphical Method for Constructing Shear and Moment Diagrams
Regions of Distributed LoadThe following 2 equations provide a convenient
means for quickly obtaining the shear and moment
diagrams for a beam.
Slope of the
-distributed
shear dV
w x load intensity
diagram at dx
at each point
each point
Slope of
moment
diagram at
each point
dM
V
dx
Shear at
each point
14. Example 6.4
Draw the shear and moment diagrams for the beam shown.Solution:
The reactions are shown on a free-body diagram.
For shear diagram according to the sign convention,
at x 0, V P and at x L, V P
Since w = 0, the slope of the shear diagram will be zero, thus
dV dx w 0 at all points
For moment diagram according to the sign convention,
at x 0, M PL and at x L, M 0
The shear diagram indicates that the shear is constant
Positive, thus
dM dx V P at all points
15. Example 6.4
Draw the shear and moment diagrams for the beam shown.Solution:
The reaction at the fixed support is shown on the free-body diagram.
Since no distributed load exists on the beam the shear
diagram will have zero slope, at all points.
From the shear diagram the slope of the moment diagram
will be zero since V = 0.
16. Example 6.5
Draw the shear and moment diagrams for the beam shown.Solution:
The reaction at the support is calculated and shown on the free-body diagram.
The distributed loading on the beam is positive yet
Decreasing, thus negative slope.
The curve of the moment diagram having this slope
behaviour is a cubic function of x.
17.
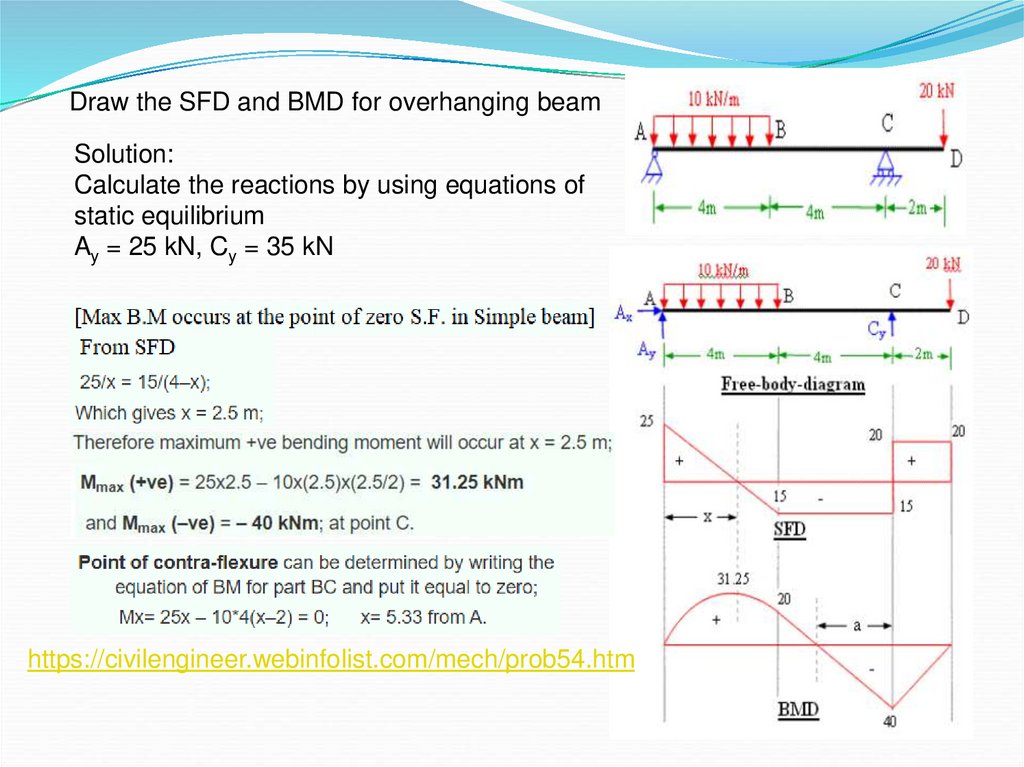
Draw the SFD and BMD for overhanging beamSolution:
Calculate the reactions by using equations of
static equilibrium
Ay = 25 kN, Cy = 35 kN
https://civilengineer.webinfolist.com/mech/prob54.htm
18. Bending Deformation of a Straight Member
Cross section of a straight beam remains planewhen the beam deforms due to bending.
There will be tensile stress on one side and
compressive stress on the other side.
19. Bending Deformation of a Straight Member
Longitudinal strain varies linearly from zero at theneutral axis.
Hooke’s law applies when material is homogeneous.
Neutral axis passes through the centroid of the
cross-sectional area for linear-elastic material.
20. The Flexure Formula
Resultant moment on the cross section is equal tothe moment produced by the linear normal stress
distribution about the neutral axis.
My
I
σ = normal stress in the member
M = resultant internal moment
I = moment of inertia
y = perpendicular distance from the neutral axis
By the right-hand rule, negative sign is compressive
since it acts in the negative x direction.
21. Example 6.7
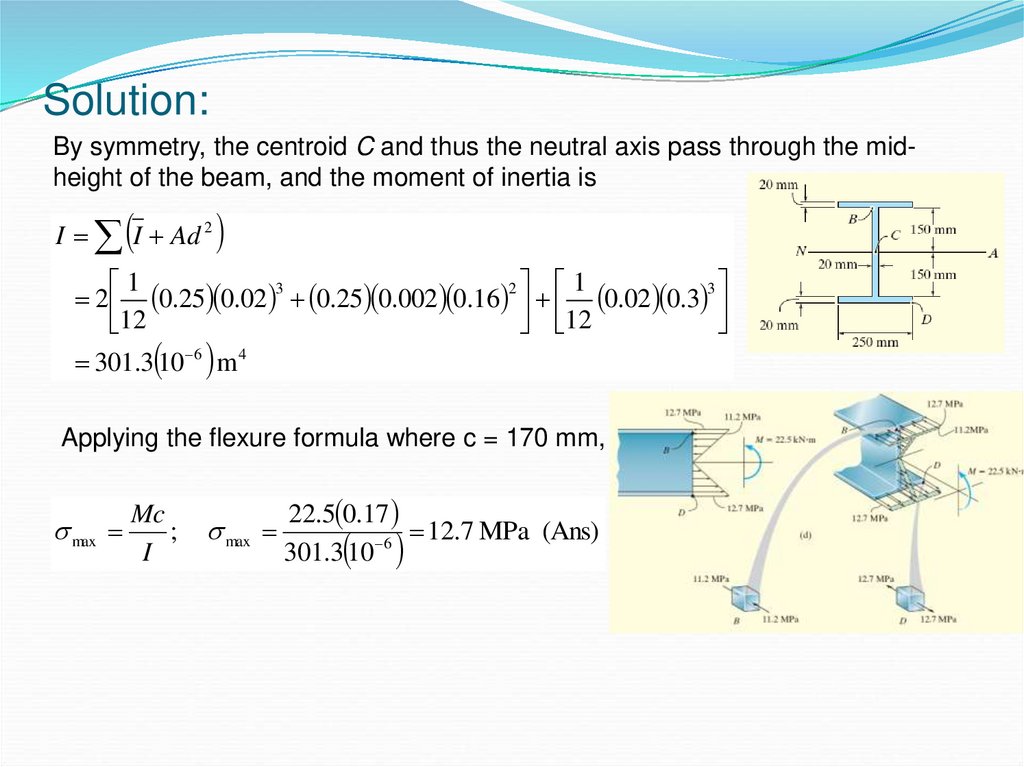
The simply supported beam has the cross-sectional area as shown. Determine theabsolute maximum bending stress in the beam and draw the stress distribution over
the cross section at this location.
Solution:
The maximum internal moment in the beam is M 22.5 kNm
22.
Solution:By symmetry, the centroid C and thus the neutral axis pass through the midheight of the beam, and the moment of inertia is
I I Ad 2
1
1
3
2
3
2 0.25 0.02 0.25 0.002 0.16 0.02 0.3
12
12
301.3 10 6 m 4
Applying the flexure formula where c = 170 mm,
max
Mc
;
I
max
22.5 0.17
12.7 MPa (Ans)
6
301.3 10
23. Unsymmetric Bending
Moment Arbitrarily AppliedWe can express the resultant normal stress at any
point on the cross section in general terms as
=
Mz y M yz
Iz
Iy
+
σ = normal stress at the point
y, z = coordinates of the point measured from x, y, z axes
My, Mz = resultant internal moment components directed
along y and z axes
Iy, Iz = principal moments of inertia computed about the y
and z axes
24. Example 6.8
A T-beam is subjected to the bending moment of 15 kNm. Determine the maximumnormal stress in the beam .
Solution:
Both moment components are positive,
M y 15 cos 30 12.99 kNm
M z 15 sin 30 7.50 kNm
For section properties, we have
z
z A 0.05 0.1 0.04 0.115 0.03 0.2 0.0890 m
0.1 0.04 0.03 0.2
A
25.
Solution:Using the parallel-axis theorem, I I Ad 2 the principal moments of inertia are
thus
1
0.1 0.04 3 1 0.03 0.2 3 20.53 10 6 m 4
12
12
1
3
2
I y 0.04 0.1 0.1 0.04 0.089 0.05
12
Iz
1
3
2
0.2 0.03 0.2 0.03 0.115 0.089 13.92 10 6 m 4
12
The largest tensile stress at B and greatest compressive stress at C.
Mz y M yz
Iz
Iy
7.5 0.1 12.99 0.041
74.8 MPa
6
6
20.53 10
13.92 10
7.5 0.02 12.99 0.089
C
90.3 MPa (Ans)
6
6
20.53 10
13.92 10
B