
 Экономика
Похожие презентации:


 systems")

Value Stream Mapping. Monthly forecast
1.
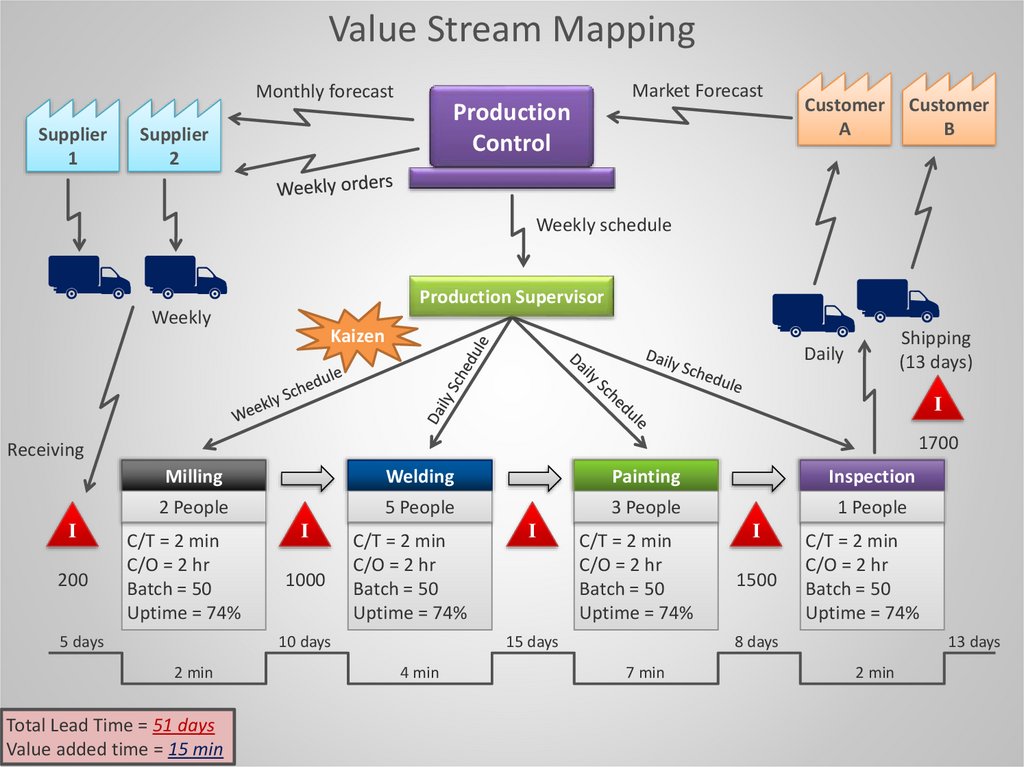
Value Stream MappingMonthly forecast
Supplier
1
Market Forecast
Production
Control
Supplier
2
Customer
A
Customer
B
Weekly schedule
Production Supervisor
Weekly
Kaizen
Shipping
(13 days)
Daily
I
1700
Receiving
I
200
Milling
Welding
Painting
Inspection
2 People
5 People
3 People
1 People
C/T = 2 min
C/O = 2 hr
Batch = 50
Uptime = 74%
5 days
I
1000
C/T = 2 min
C/O = 2 hr
Batch = 50
Uptime = 74%
10 days
2 min
Total Lead Time = 51 days
Value added time = 15 min
I
C/T = 2 min
C/O = 2 hr
Batch = 50
Uptime = 74%
15 days
4 min
I
1500
C/T = 2 min
C/O = 2 hr
Batch = 50
Uptime = 74%
8 days
7 min
13 days
2 min
2.
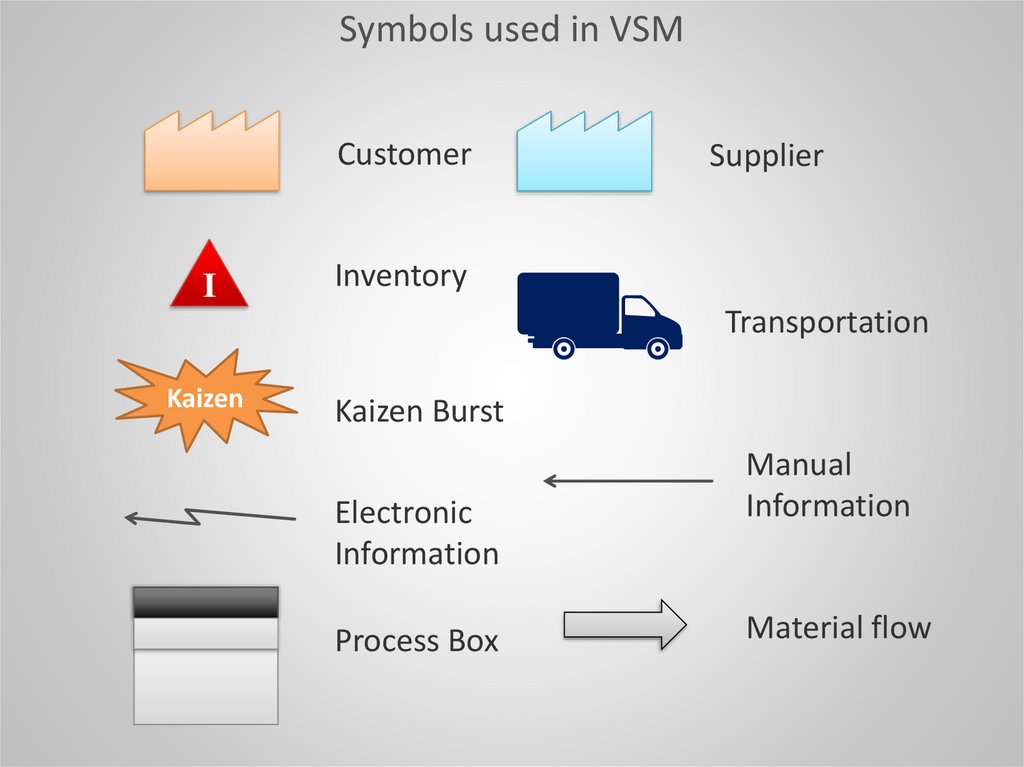
Symbols used in VSMCustomer
I
Supplier
Inventory
Transportation
Kaizen
Kaizen Burst
Electronic
Information
Process Box
Manual
Information
Material flow
3.
Thank you!You can use this PowerPoint template for free based on creative commons license.
Follow us on Twitter @slideh or subscribe to our mailing list
Or upload your presentation for free and share online in SlideOnline.com
www.SlideHunter.com
Download Free Templates
Upload to Slide Online.com