


 Экономика
Похожие презентации:


Random walk theory and GBM
1.
RANDOM WALKTHEORY AND GBM
Kirill Afanasev (16,67%)
Anastasia Vyunova (16,67%)
Maria Malenkina (16,67%)
Anna Peshkan (16,67%)
Mark Khabarov (16,67%)
Elena Yakovleva (16,67%)
2.
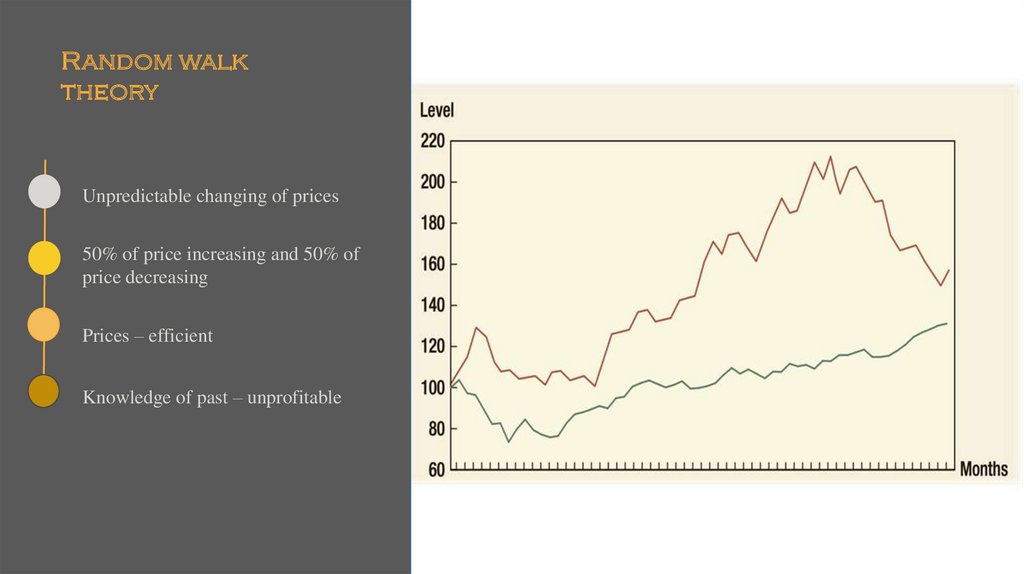
Random walktheory
Unpredictable changing of prices
50% of price increasing and 50% of
price decreasing
Prices – efficient
Knowledge of past – unprofitable
3.
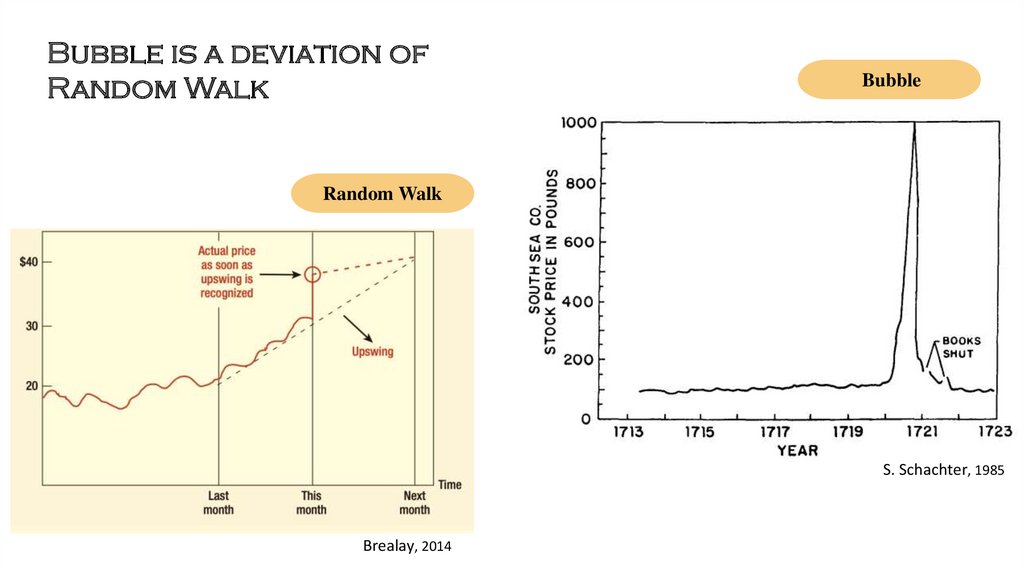
BUBBLEuncontrollable and sharp growthof prices
4.
Bubble is a deviation ofRandom Walk
Bubble
Random Walk
S. Schachter, 1985
Brealay, 2014
5.
Historical bubble6.
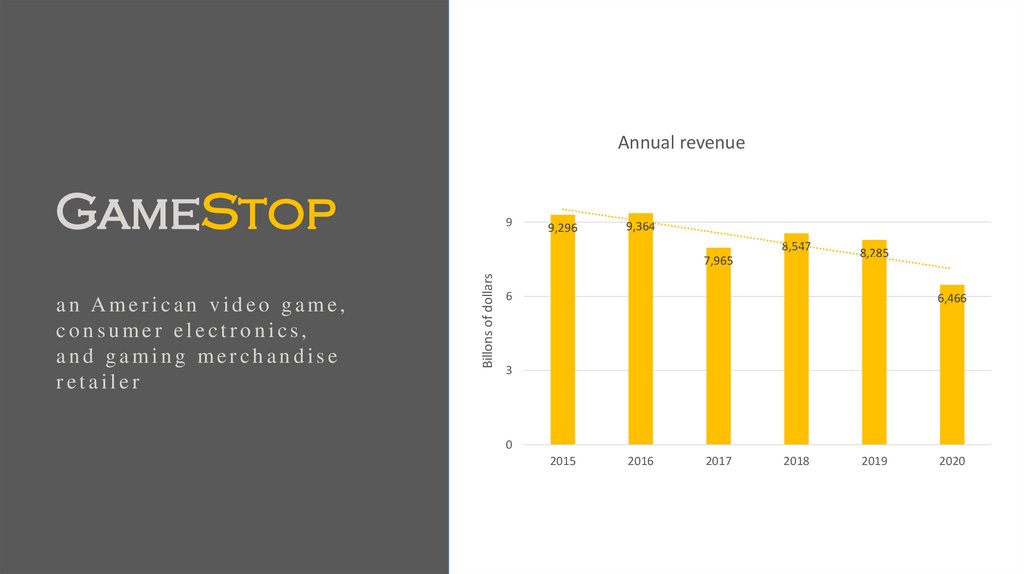
Annual revenueGameStop
9
9,296
9,364
8,547
an American video game,
consumer electronics,
and gaming merchandise
retailer
Billons of dollars
7,965
8,285
6
6,466
3
0
2015
2016
2017
2018
2019
2020
7.
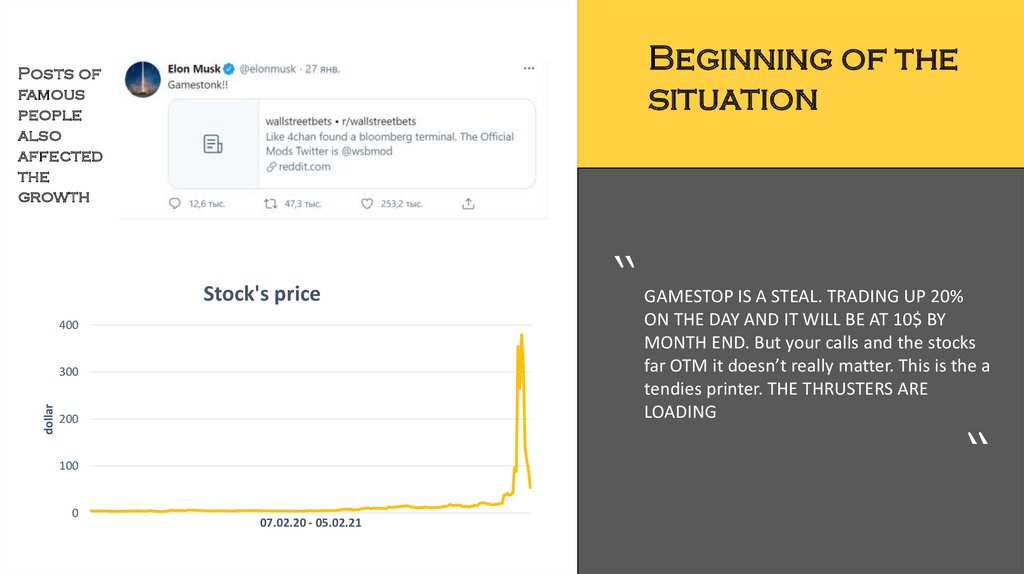
Beginning of thesituation
Posts of
famous
people
also
affected
the
growth
Stock's price
ON THE DAY AND IT WILL BE AT 10$ BY
MONTH END. But your calls and the stocks
far OTM it doesn’t really matter. This is the a
tendies printer. THE THRUSTERS ARE
LOADING
400
“
dollar
300
200
100
0
“ GAMESTOP IS A STEAL. TRADING UP 20%
07.02.20 - 05.02.21
8.
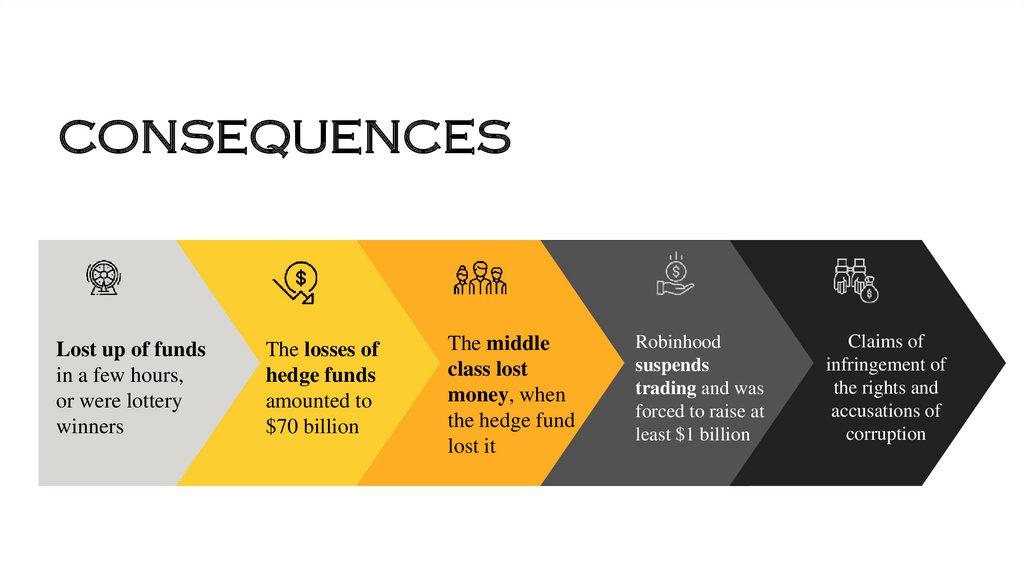
CONSEQUENCESLost up of funds
in a few hours,
or were lottery
winners
The losses of
hedge funds
amounted to
$70 billion
The middle
class lost
money, when
the hedge fund
lost it
Robinhood
suspends
trading and was
forced to raise at
least $1 billion
Claims of
infringement of
the rights and
accusations of
corruption
9.
CURRENT BUBBLE10.
An American PUBLIC COMPANY withthe revenue of $486 million (2019)
INDUSTRY: Business
intelligence and mobile software
The company experienced a burst
of bubble in March 2000
11.
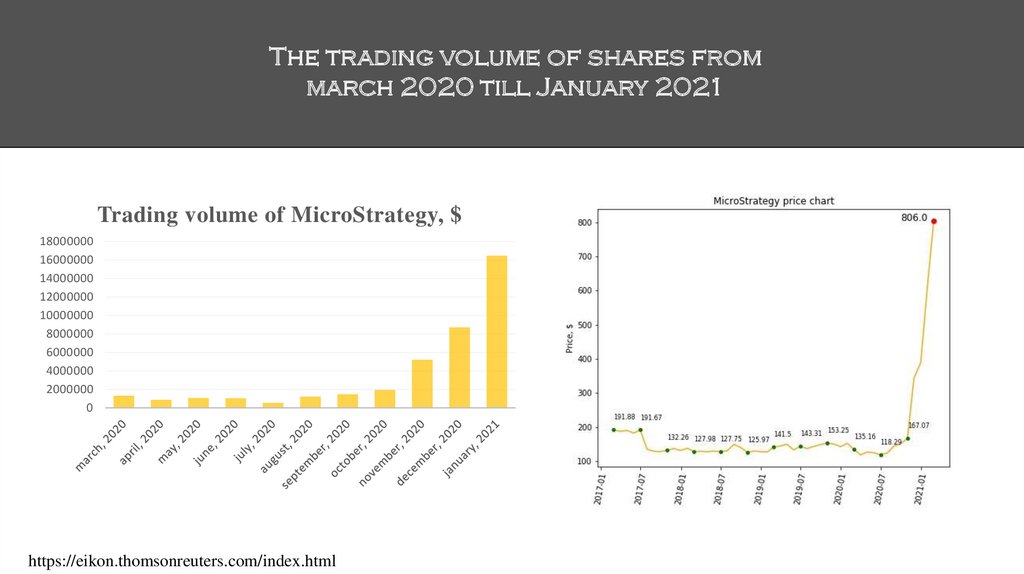
The trading volume of shares frommarch 2020 till January 2021
Trading volume of MicroStrategy, $
18000000
16000000
14000000
12000000
10000000
8000000
6000000
4000000
2000000
0
https://eikon.thomsonreuters.com/index.html
12.
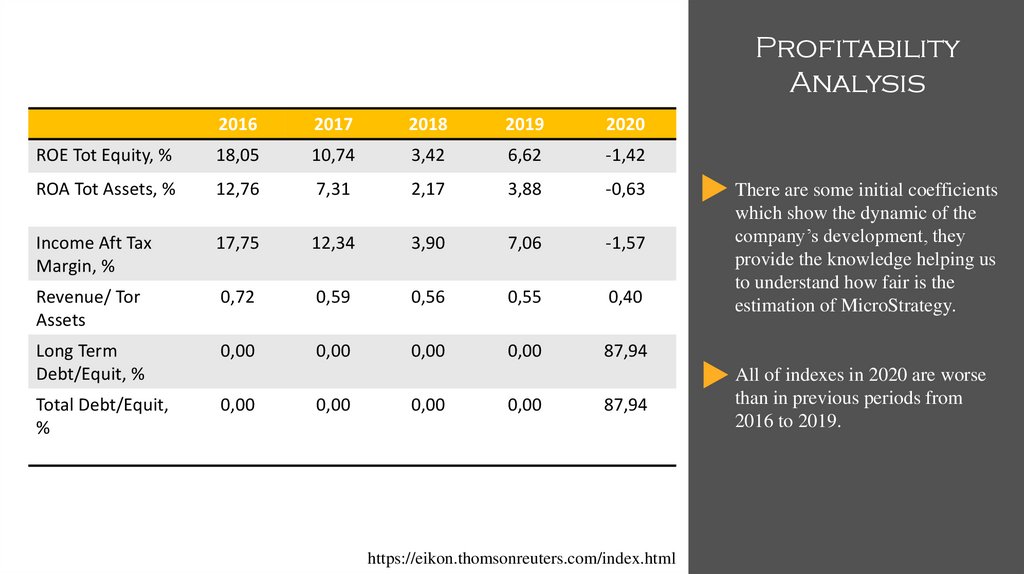
ProfitabilityAnalysis
2016
2017
2018
2019
2020
ROE Tot Equity, %
18,05
10,74
3,42
6,62
-1,42
ROA Tot Assets, %
12,76
7,31
2,17
3,88
-0,63
Income Aft Tax
Margin, %
17,75
12,34
3,90
7,06
-1,57
Revenue/ Tor
Assets
0,72
0,59
0,56
0,55
0,40
Long Term
Debt/Equit, %
0,00
0,00
0,00
0,00
87,94
Total Debt/Equit,
%
0,00
0,00
0,00
0,00
87,94
https://eikon.thomsonreuters.com/index.html
There are some initial coefficients
which show the dynamic of the
company’s development, they
provide the knowledge helping us
to understand how fair is the
estimation of MicroStrategy.
All of indexes in 2020 are worse
than in previous periods from
2016 to 2019.
13.
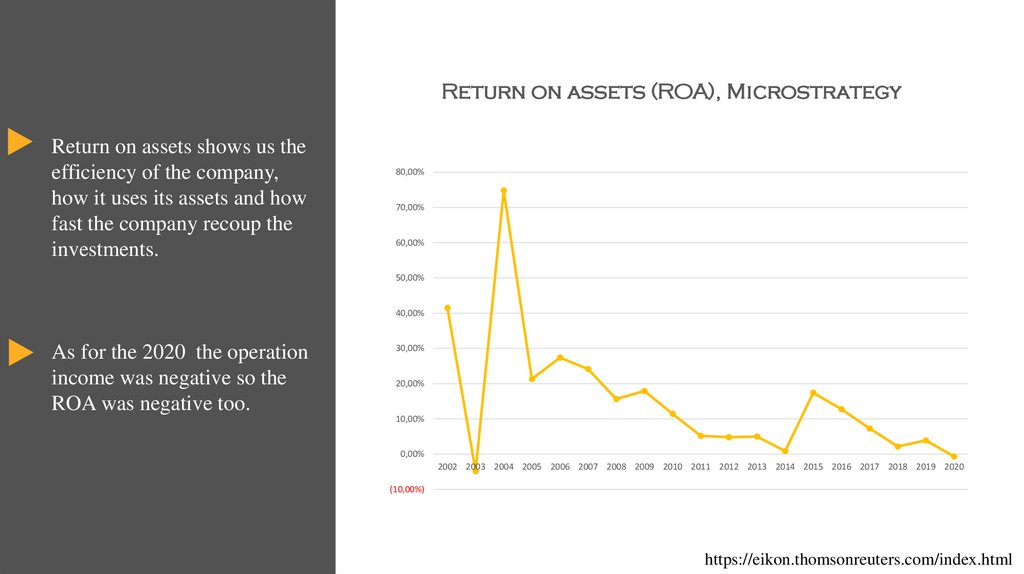
Return on assets (ROA), MicrostrategyReturn on assets shows us the
efficiency of the company,
how it uses its assets and how
fast the company recoup the
investments.
80,00%
70,00%
60,00%
50,00%
40,00%
As for the 2020 the operation
income was negative so the
ROA was negative too.
30,00%
20,00%
10,00%
0,00%
2002 2003 2004 2005 2006 2007 2008 2009 2010 2011 2012 2013 2014 2015 2016 2017 2018 2019 2020
(10,00%)
https://eikon.thomsonreuters.com/index.html
14.
Daily Chart of P/E (Capitalization of the Company/EarningsThe trading volume of shares from
march 2020 till January 2021
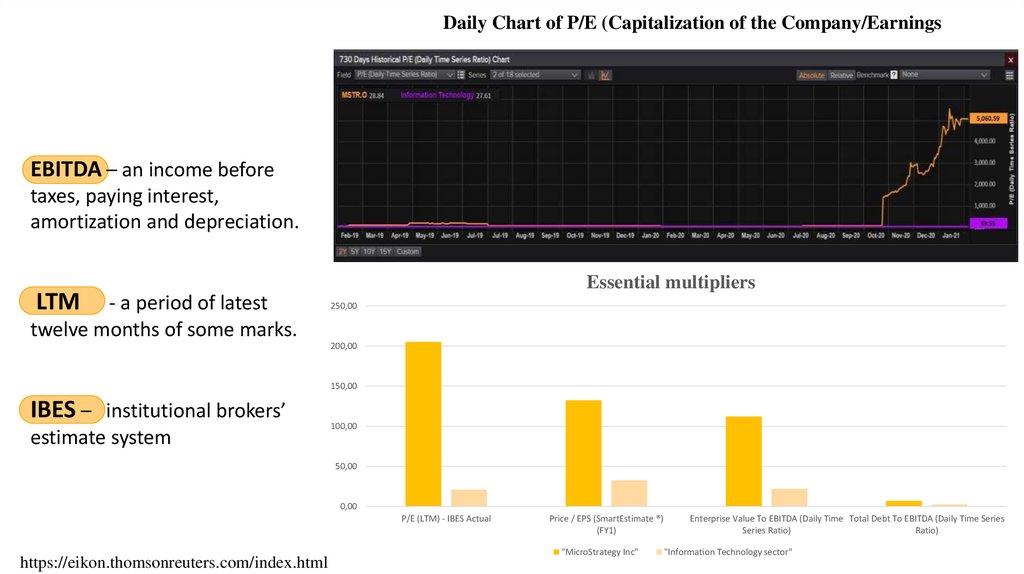
EBITDA – an income before
taxes, paying interest,
amortization and depreciation.
LTM
- a period of latest
twelve months of some marks.
Essential multipliers
250,00
200,00
150,00
IBES – institutional brokers’
estimate system
100,00
50,00
0,00
P/E (LTM) - IBES Actual
https://eikon.thomsonreuters.com/index.html
Price / EPS (SmartEstimate ®)
(FY1)
"MicroStrategy Inc"
Enterprise Value To EBITDA (Daily Time Total Debt To EBITDA (Daily Time Series
Series Ratio)
Ratio)
"Information Technology sector"
15.
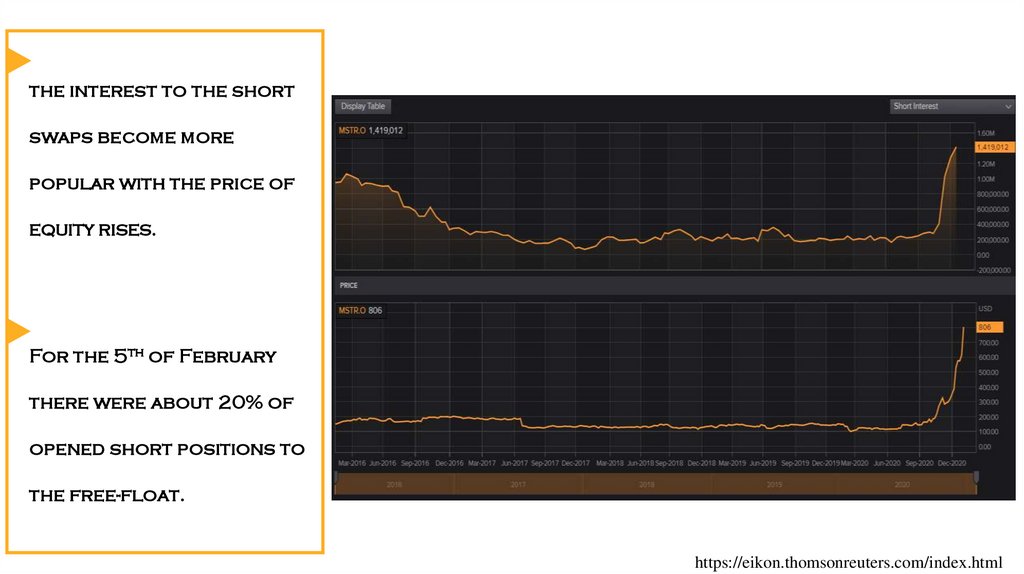
the interest to the shortswaps become more
popular with the price of
equity rises.
For the 5th of February
there were about 20% of
opened short positions to
the free-float.
https://eikon.thomsonreuters.com/index.html
16.
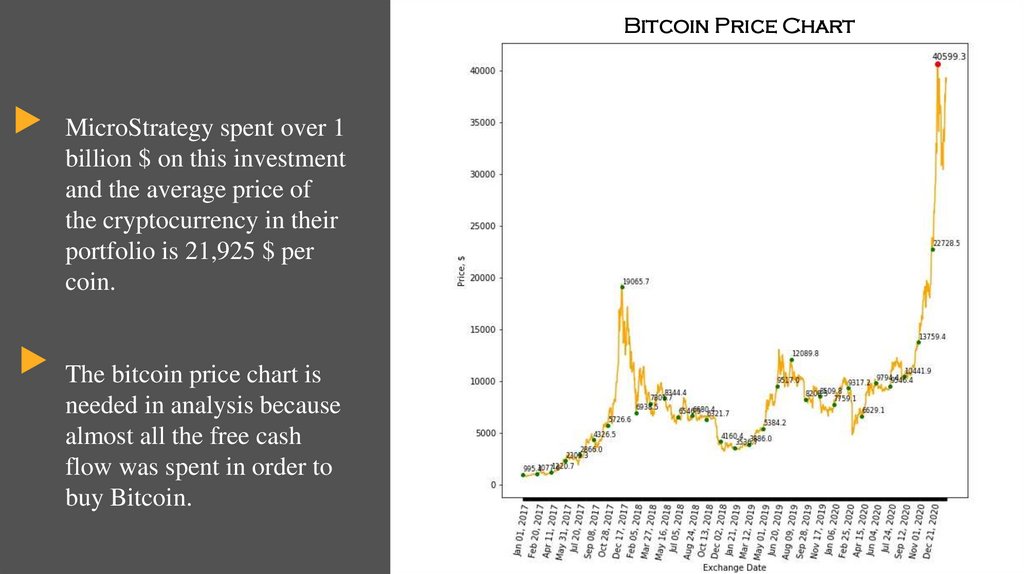
Bitcoin Price ChartMicroStrategy spent over 1
billion $ on this investment
and the average price of
the cryptocurrency in their
portfolio is 21,925 $ per
coin.
The bitcoin price chart is
needed in analysis because
almost all the free cash
flow was spent in order to
buy Bitcoin.
17.
Investors’ actionThe investors demonstrate a high interest to MicroStrategy shares as managers decided to invest free
cash flow in Bitcoin. That was the only news which provoked frequent growth of shares’ price.
This asset has approximately equal price hesitation so here we can suggest about correlation existence
between assets.
Currently, the company earned from this investment about $1 billion but the price achieved 6x growth
from the beginning of the attachment.
18.
Sources1. Schachter, S., Gerin, W., Hood, D. C., & Anderassen, P. (1985a). I. Was the South Sea Bubble a random
walk? Journal of Economic Behavior & Organization, 6(4), 323–329. https://doi.org/10.1016/01672681(85)90001-0
2. Allen, F., Myers, S., & Brealey, R. (2013). Principles of Corporate Finance. McGraw-Hill Education.
3. Kurov, A. (2021, February 6). The dark side of the GameStop bubble: Driving stock prices to the moon
can hurt America. MarketWatch. https://www.marketwatch.com/story/the-dark-side-of-th..
4. Research, M. (2021, February 1). Кто действительно выиграл и проиграл от роста акций GameStop,
и каковы последствия происходящего. Vc.Ru. https://vc.ru/finance/203043-kto-deystvitelno-vyigral..
5. Elon Musk (@elonmusk) | Twitter. (n.d.). Twitter. Retrieved January 27, 2021,
from https://mobile.twitter.com/elonmusk
6. GameStop Revenue 2006-2020 | GME. (n.d.).
MacroTrends. https://www.macrotrends.net/stocks/charts/GME/gamesto..
19.
Thank you for yourattention