Похожие презентации:
Data analytics comparison
1.
Driver contextUsage of contextual location
/ GIS data
Drivers behavior matching /
clustering
Drivers awareness
Event-based analytics
speeding
phone usage
Acceleration, braking,
cornering
Basic info
age
gender
driving experience
General info
Speed limits
Scoring based on detected
events
Event-based tips
Trip context
weather
visibility
time of day
maneuvers type and number
prohibited maneuvers
Trip context
Trips history
Route familiarity
Route type familiarity
Detailed road info
Road type
Number of lanes
Intersection types
Traffic lights, signs
Permitted maneuvers
Driving behavior
Drivers behavioral model
based on trip and driver
context
Trip planning behavior
Trip context
Personalized
recommendations based on
trip context and planning
Driver context
Other trips of this driver
Same trips of other drivers
Driver context
Car ownership history
Traffic fines
Total mileage
Annual mileage
Real-time & historic info
traffic jams
traffic flow speed
roadworks
closures & restrictions
Deviations from typical
behavior
Driver context
Personalized
recommendations based on
driver context
FlexyDrive
Behavior tracker / analytics
Существующие
решения
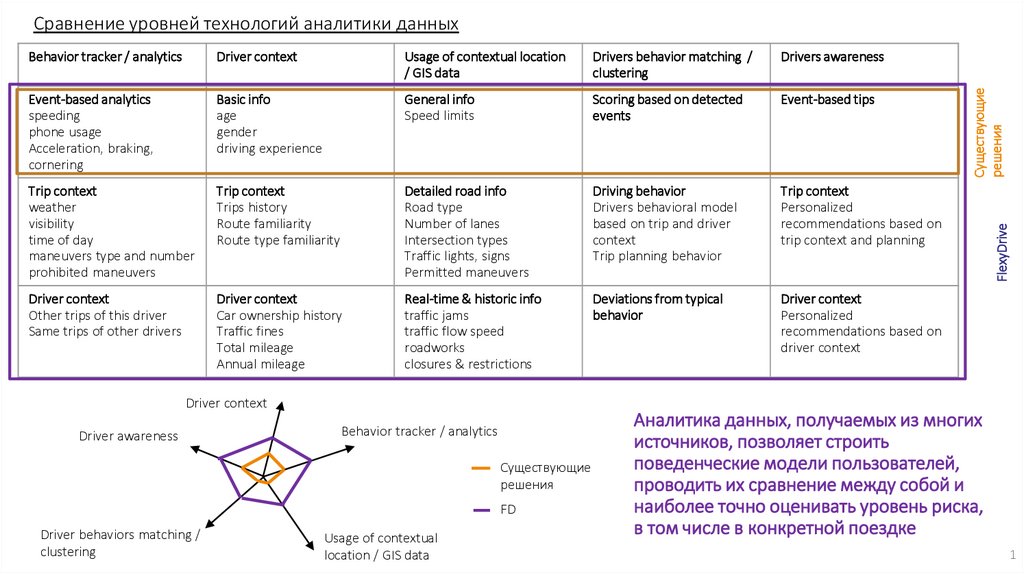
Сравнение уровней технологий аналитики данных
Driver context
Driver awareness
Behavior tracker / analytics
Существующие
решения
FD
Driver behaviors matching /
clustering
Usage of contextual
location / GIS data
Аналитика данных, получаемых из многих
источников, позволяет строить
поведенческие модели пользователей,
проводить их сравнение между собой и
наиболее точно оценивать уровень риска,
в том числе в конкретной поездке
1

 Менеджмент


