


 Информатика
Похожие презентации:


Introduction to Data Analytics
1.
MSBA SPECIALTYAUGUST 2021
Introduction to Data
Analytics
2.
ANALYTICS AND DATAVISUALIZATION: WHY?
Financial
Data
Time
Tracking
Data
Descriptive
Analytics
Project
Performance
Tracking
Data
Quality
Tracking
Data
Diagnostic
Analytics
Predictive
Analytics
2
3.
FOR INTERNAL USE ONLYDESCRIBE
KNOW THE TYPE OF ANALYTICS YOU ARE
WORKING WITH
Descriptive analytics is
within the domain of
reporting and
summarising
information. It is focused
on what is happening or
has happened.
Descriptive analytics
helps organisations that
are starting to get their
heads around all the
data they generate
internally
Analytics
Diagnostic analytics is
focused on understanding
why something has
happened. This kind of
analytics is focused on
highlighting processes
and causes rather than
outcomes. Diagnostic
analytics enables us to
answer questions like
“How do we fix this?” or
“How can we improve
that?”
Predictive
Analytics
Diagnostic
Descriptive
We as strategists need to know the type of analytics that we are working with, since each of them are distinct in
their own rights. They all are a different lens of how organisations are able to achieve greater performance
Analytics
Predictive analytics takes
both the outcomes from
descriptive and
diagnostic and
models/predicts what
might happen in the
future. This is also known
as forecasting, this type
of analytics enables
organisations to make
decisions about operating
more efficiently and
effectively in future
3
4.
FOR INTERNAL USE ONLYPRACTICE
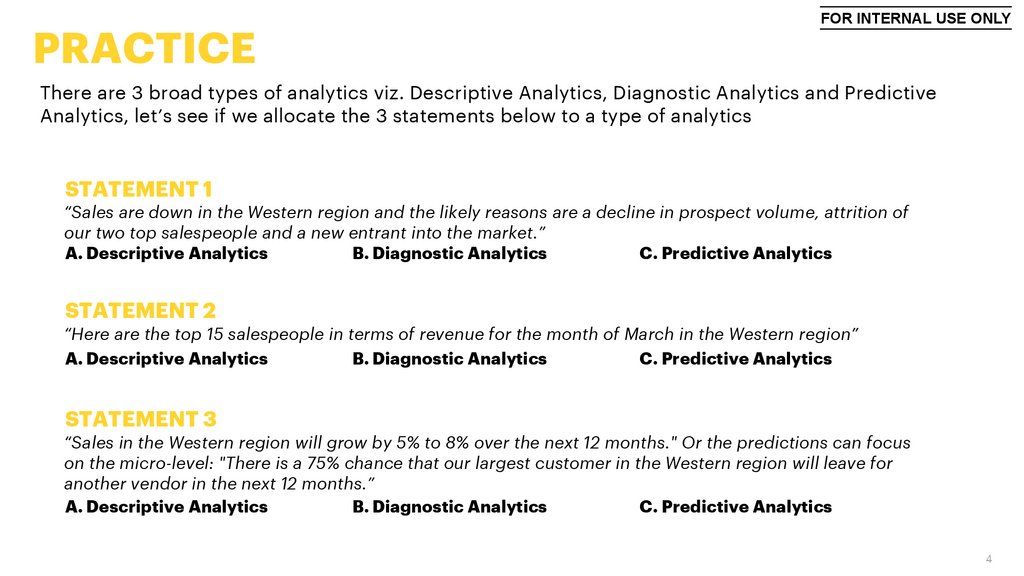
There are 3 broad types of analytics viz. Descriptive Analytics, Diagnostic Analytics and Predictive
Analytics, let’s see if we allocate the 3 statements below to a type of analytics
STATEMENT 1
“Sales are down in the Western region and the likely reasons are a decline in prospect volume, attrition of
our two top salespeople and a new entrant into the market.”
A. Descriptive Analytics
B. Diagnostic Analytics
C. Predictive Analytics
STATEMENT 2
“Here are the top 15 salespeople in terms of revenue for the month of March in the Western region”
A. Descriptive Analytics
B. Diagnostic Analytics
C. Predictive Analytics
STATEMENT 3
“Sales in the Western region will grow by 5% to 8% over the next 12 months." Or the predictions can focus
on the micro-level: "There is a 75% chance that our largest customer in the Western region will leave for
another vendor in the next 12 months.”
A. Descriptive Analytics
B. Diagnostic Analytics
C. Predictive Analytics
4
5.
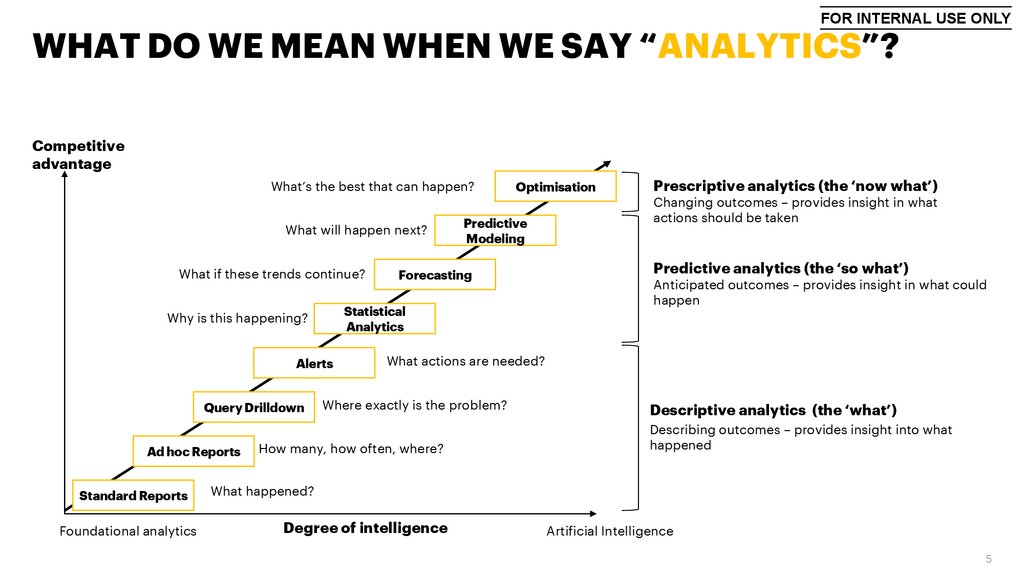
FOR INTERNAL USE ONLYWHAT DO WE MEAN WHEN WE SAY “ANALYTICS”?
Competitive
advantage
What’s the best that can happen?
What will happen next?
What if these trends continue?
Alerts
Ad hoc Reports
Standard Reports
Foundational analytics
Predictive
Modeling
Forecasting
Statistical
Analytics
Why is this happening?
Query Drilldown
Optimisation
Prescriptive analytics (the ‘now what’)
Changing outcomes – provides insight in what
actions should be taken
Predictive analytics (the ‘so what’)
Anticipated outcomes – provides insight in what could
happen
What actions are needed?
Where exactly is the problem?
How many, how often, where?
Descriptive analytics (the ‘what’)
Describing outcomes – provides insight into what
happened
What happened?
Degree of intelligence
Artificial Intelligence
5
6.
FOR INTERNAL USE ONLYANALYTICS AT WORK
What you think you are doing…
What you are actually doing…
vs.
Power BI VS Excel:
https://www.youtube.com/watch?v=yZoLW72IO5o
6
7.
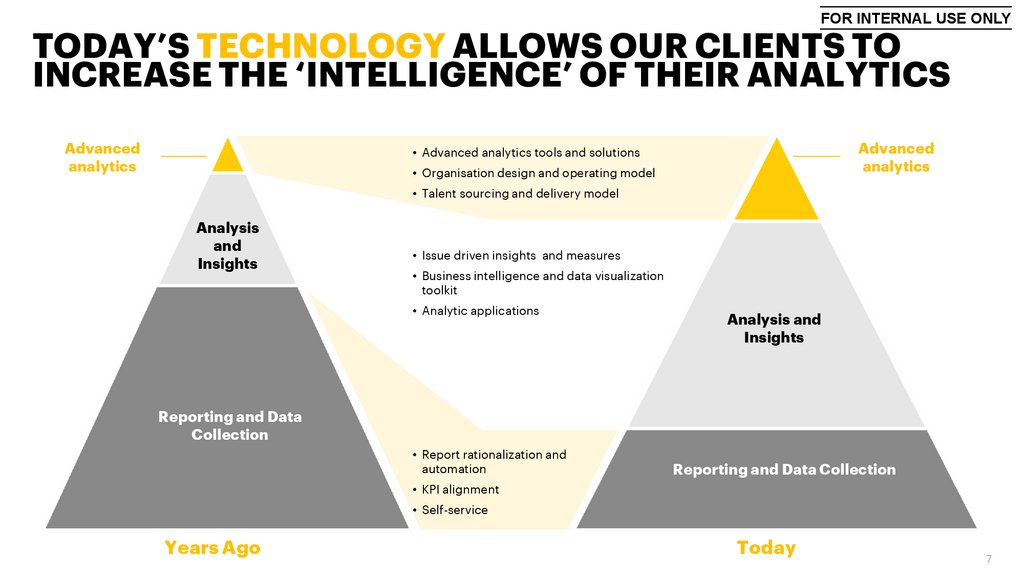
FOR INTERNAL USE ONLYTODAY’S TECHNOLOGY ALLOWS OUR CLIENTS TO
INCREASE THE ‘INTELLIGENCE’ OF THEIR ANALYTICS
From
Advanced
analytics
To
Advanced
analytics
• Advanced analytics tools and solutions
• Organisation design and operating model
• Talent sourcing and delivery model
Analysis
and
Insights
• Issue driven insights and measures
• Business intelligence and data visualization
toolkit
• Analytic applications
Analysis and
Insights
Reporting and Data
Collection
• Report rationalization and
automation
Reporting and Data Collection
• KPI alignment
• Self-service
Years Ago
Today
7
8.
FOR INTERNAL USE ONLYAUGMENTED ANALYTICS WORKFLOW
Prepare Data
• Algorithms detect schemas, profile and catalog data, identify
data lineage and metadata, and recommend enrichment
Augmented analytics
represents a new approach to
problem-solving that supports
humans in the decision-making
process, not replace them.
Augmented
Analytics
Share and
Operationalize Findings
• Insights are narrated in
natural language or
visualizations to focus
user on what is
important and
actionable
• Embedded in apps or
conversational UI
Find Patterns in Data and
Building Models
• Natural language query
• Algorithms find all relevant patterns
in data
• Features are autoselected
• Models are autoselected
• Code is autogenerated
• Models management is augmented
Source: Gartner | 444837
8
9.
FOR INTERNAL USE ONLYEXECUTIVES RECOGNIZE THE STRATEGIC
IMPORTANCE OF ANALYTICS
6% In more
than 3 years
Analytics is seen as important
to CEOs in particular
Nearly
27%
33%
Within the
next 3 years
40
%
It is already
say it’s already
one of their
top priorities
Another
39
%
%
33
Within one year
For 66% of companies, analytics is one of their
top 3 strategic priorities or will be within a year.
That increases to 93% when looking within the
next 3 years.
say it will be
within a year
The highest among any
of the executive groups
responding and higher
than the average
9
10.
FOR INTERNAL USE ONLYTHE VALUE THAT ANALYTICS CAN ADD IS GROUNDED
IN IT’S FOUR KEY CAPABILITIES
Many technologies have
evolved and combined to create
three foundational skills in
software today.
SENSE
Perceive the world
by acquiring and
processing
images, sounds
and speech.
COMPREHEND
Analyze and
understand the
information
collected by
adding meaning
and insights.
The new catalyst essential to analytics is
the ability to autonomously learn, adapt,
and improve – at increasingly lower costs.
ACT
LEARN
Take action in the
physical world
based on
comprehension
and
understanding.
Improve
performance
(quality,
consistency, and
accuracy) based on
real world
experiences.
10
11.
FOR INTERNAL USE ONLYDATA DRIVEN
CONSULTING
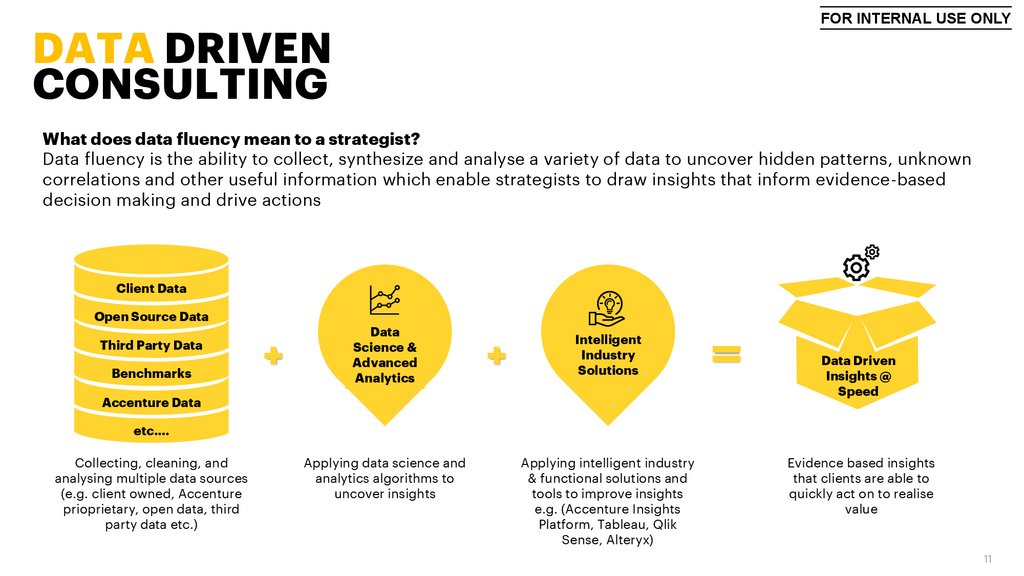
What does data fluency mean to a strategist?
Data fluency is the ability to collect, synthesize and analyse a variety of data to uncover hidden patterns, unknown
correlations and other useful information which enable strategists to draw insights that inform evidence-based
decision making and drive actions
Client Data
Open Source Data
Third Party Data
Benchmarks
Data
Science &
Advanced
Analytics
Intelligent
Industry
Solutions
Accenture Data
Data Driven
Insights @
Speed
etc.…
Collecting, cleaning, and
analysing multiple data sources
(e.g. client owned, Accenture
prioprietary, open data, third
party data etc.)
Applying data science and
analytics algorithms to
uncover insights
Applying intelligent industry
& functional solutions and
tools to improve insights
e.g. (Accenture Insights
Platform, Tableau, Qlik
Sense, Alteryx)
Evidence based insights
that clients are able to
quickly act on to realise
value
11
12.
FOR INTERNAL USE ONLYFORMULATE OPPORTUNITIES
WHY PROBLEM DEFINITION IS IMPORTANT
IN ANALYTICS
To make sure that true problem is
2
addressed
1
To try and limit these nasty habits:
Confirmation Bias - the tendency to interpret new evidence as confirmation of one's existing beliefs or theories.
Selection Bias - introduced by the selection of individuals, groups or data for analysis in such a way that proper
randomization is not achieved
Availability Bias - giving of preference by decision makers to information and events that are more recent, that
were observed personally, and were more memorable.
Confounding Variables - an outside influence that changes the effect of a dependent and
independent variable.
“Aw, you can come up with statistics to
prove anything … Forty percent of all
people know that.”
Homer Simpson
12
13.
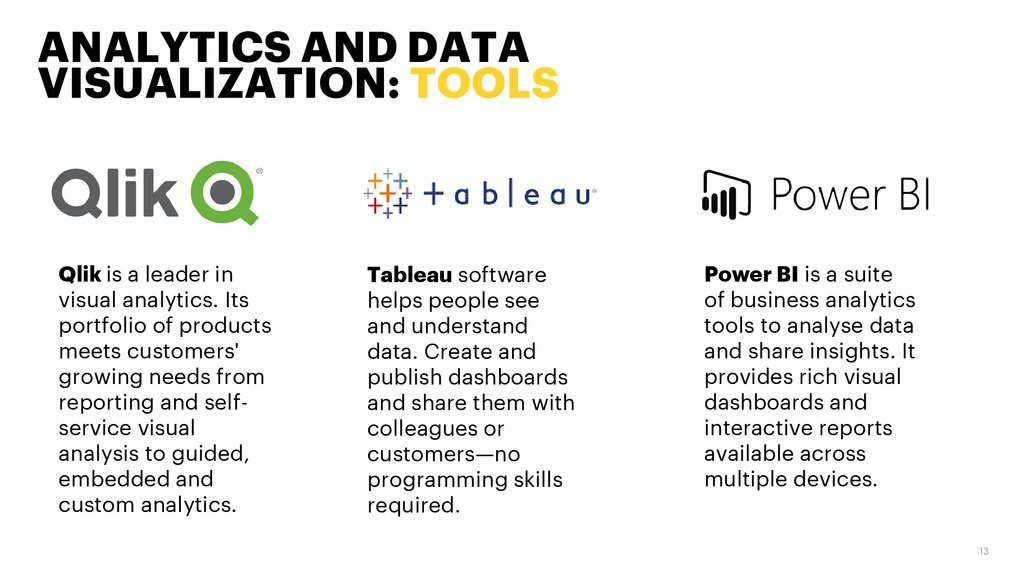
ANALYTICS AND DATAVISUALIZATION: TOOLS
Qlik is a leader in
visual analytics. Its
portfolio of products
meets customers'
growing needs from
reporting and selfservice visual
analysis to guided,
embedded and
custom analytics.
Tableau software
helps people see
and understand
data. Create and
publish dashboards
and share them with
colleagues or
customers—no
programming skills
required.
Power BI is a suite
of business analytics
tools to analyse data
and share insights. It
provides rich visual
dashboards and
interactive reports
available across
multiple devices.
13
14.
FOR INTERNAL USE ONLYINFORM INSIGHTS
STRUCTURE YOUR MESSAGE
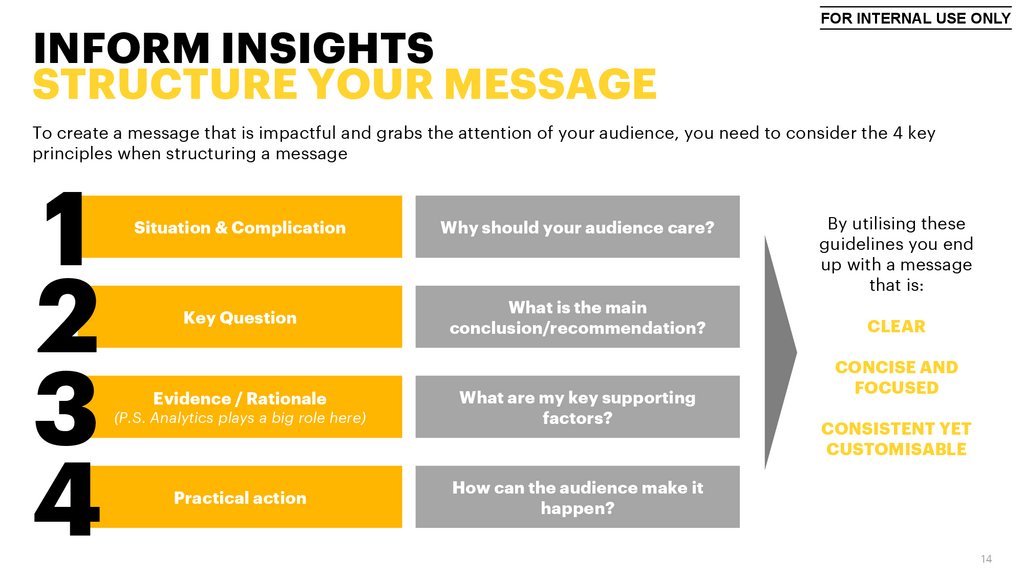
To create a message that is impactful and grabs the attention of your audience, you need to consider the 4 key
principles when structuring a message
1
2
3
4
Situation & Complication
Why should your audience care?
Key Question
What is the main
conclusion/recommendation?
Evidence / Rationale
(P.S. Analytics plays a big role here)
Practical action
What are my key supporting
factors?
By utilising these
guidelines you end
up with a message
that is:
CLEAR
CONCISE AND
FOCUSED
CONSISTENT YET
CUSTOMISABLE
How can the audience make it
happen?
14
15.
FOR INTERNAL USE ONLYKEY THINGS TO REMEMBER
Don’t just focus on the
data, the storytelling
and visualisations pull
everything together
Make use of all the trainings
and tools that Accenture
provides to make the analysis
process much simpler
Guard around data
biases and don’t
get caught out by
it
Understand what problem
you are trying to solve and
which data/analytics type
will get you there
Don’t try and solve
problems which
the data does not
allow for
15
16.
FOR INTERNAL USE ONLYDATA AT WORK
Avio:
https://www.youtube.com/watch?v=k3JucPPqd40&feature=youtu.be
Evolution:
https://www.youtube.com/watch?v=jbkSRLYSojo&feature=youtu.be
Power BI VS Excel:
https://www.youtube.com/watch?v=yZoLW72IO5o
16