


 Маркетинг
Похожие презентации:


")
Introduction to Statistics
1.
WINTER TERM 2021/2022Zuzana Pacáková
pacakova@pef.czu.cz
FEM - E429
consultations: Wed 9:30-11:00
2.
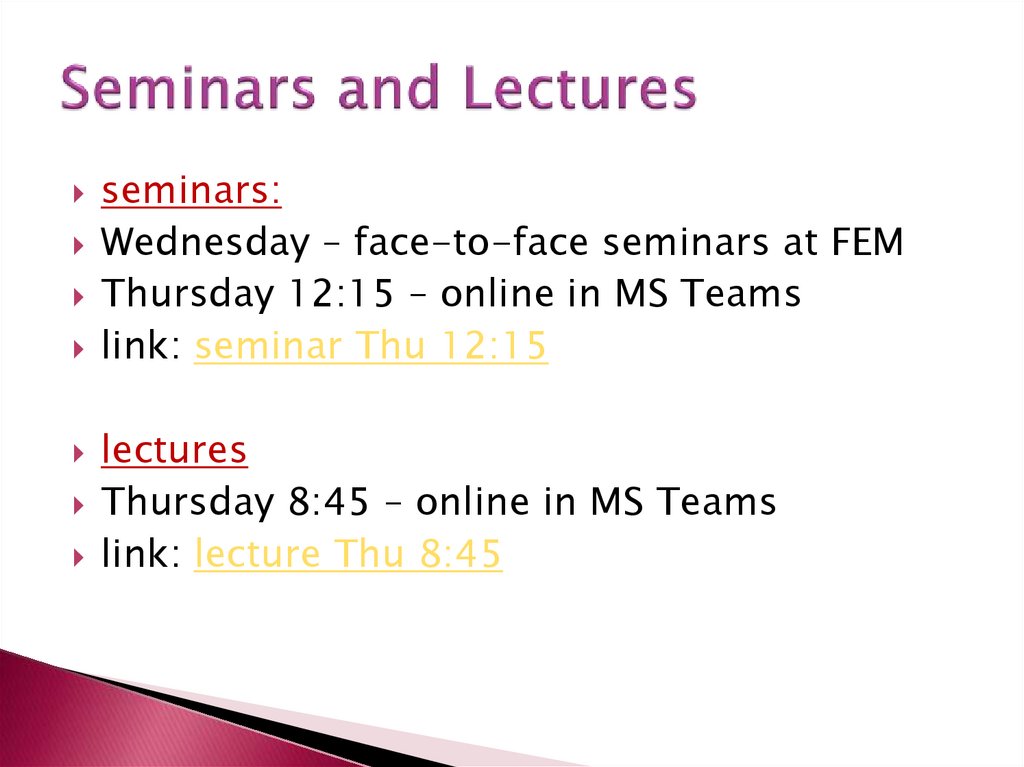
seminars:Wednesday – face-to-face seminars at FEM
Thursday 12:15 – online in MS Teams
link: seminar Thu 12:15
lectures
Thursday 8:45 – online in MS Teams
link: lecture Thu 8:45
3.
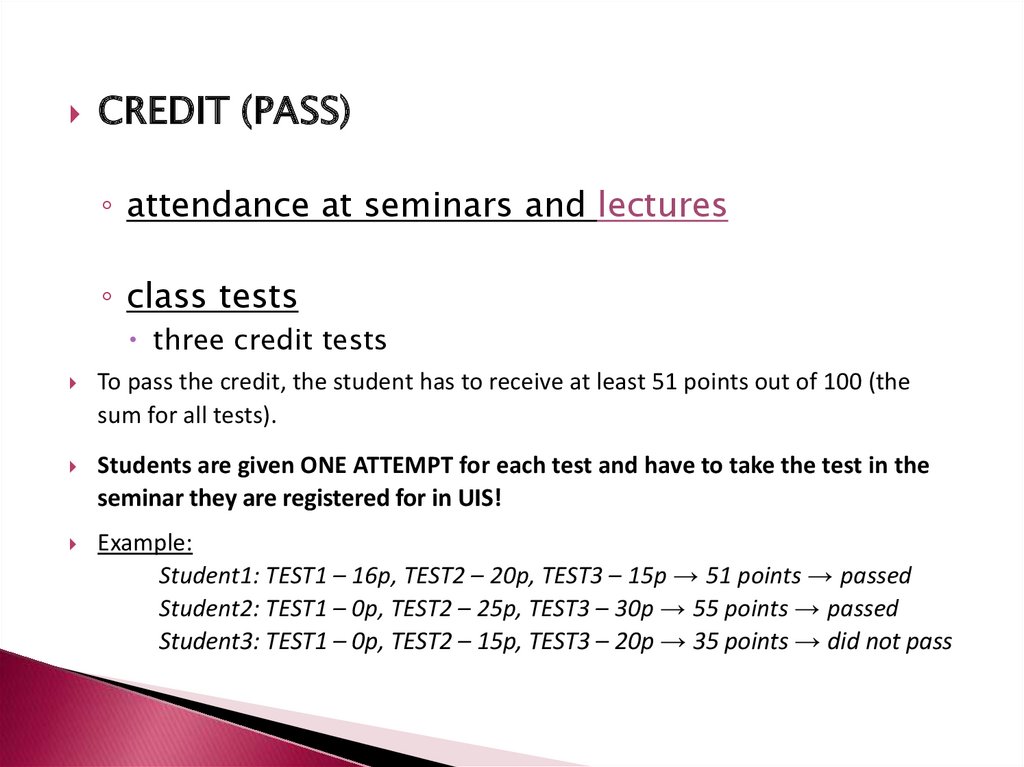
CREDIT (PASS)◦ attendance at seminars and lectures
◦ class tests
three credit tests
To pass the credit, the student has to receive at least 51 points out of 100 (the
sum for all tests).
Students are given ONE ATTEMPT for each test and have to take the test in the
seminar they are registered for in UIS!
Example:
Student1: TEST1 – 16p, TEST2 – 20p, TEST3 – 15p → 51 points → passed
Student2: TEST1 – 0p, TEST2 – 25p, TEST3 – 30p → 55 points → passed
Student3: TEST1 – 0p, TEST2 – 15p, TEST3 – 20p → 35 points → did not pass
4.
EXAMINATION◦ oral – project defence
5.
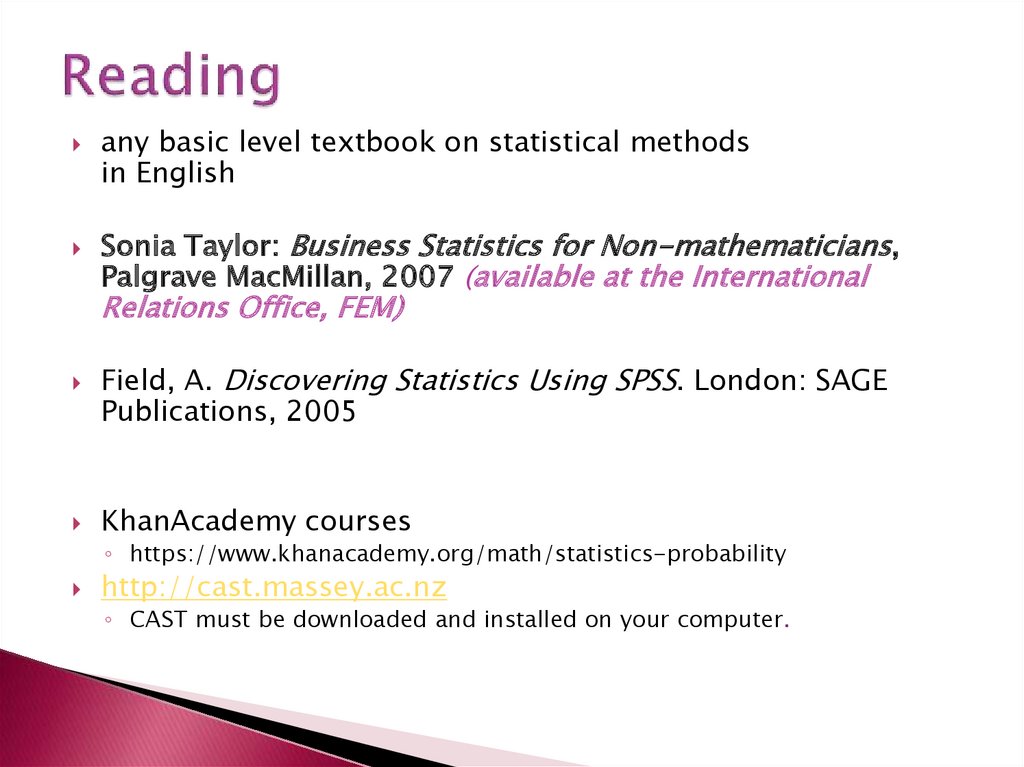
any basic level textbook on statistical methodsin English
Sonia Taylor: Business Statistics for Non-mathematicians,
Palgrave MacMillan, 2007 (available at the International
Relations Office, FEM)
Field, A. Discovering Statistics Using SPSS. London: SAGE
Publications, 2005
KhanAcademy courses
◦ https://www.khanacademy.org/math/statistics-probability
http://cast.massey.ac.nz
◦ CAST must be downloaded and installed on your computer.
6.
https://moodle.czu.cz/IBM SPSS Statistics
7.
8.
Many people understand statistics asa collection of numerical facts expressed as
a summarizing statement
For example
seven out of ten doctors recommend to eat ice
cream when having a sore throat
Jaromír Jágr scored the goal for 54 times in the
period 2005/2006
9.
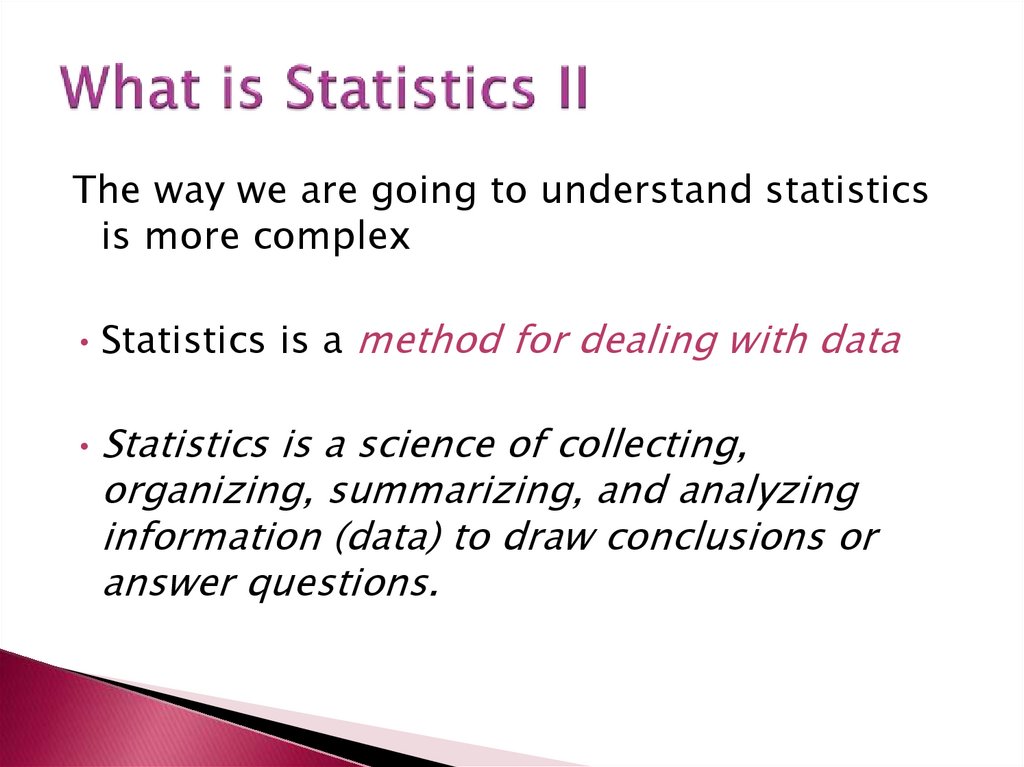
The way we are going to understand statisticsis more complex
• Statistics is a method for dealing with data
• Statistics is a science of collecting,
organizing, summarizing, and analyzing
information (data) to draw conclusions or
answer questions.
10.
Population – complete set of individuals,objects, or measurements having same
common observable characteristic
Sample – subset or part of population
Unit – single member of a population
11.
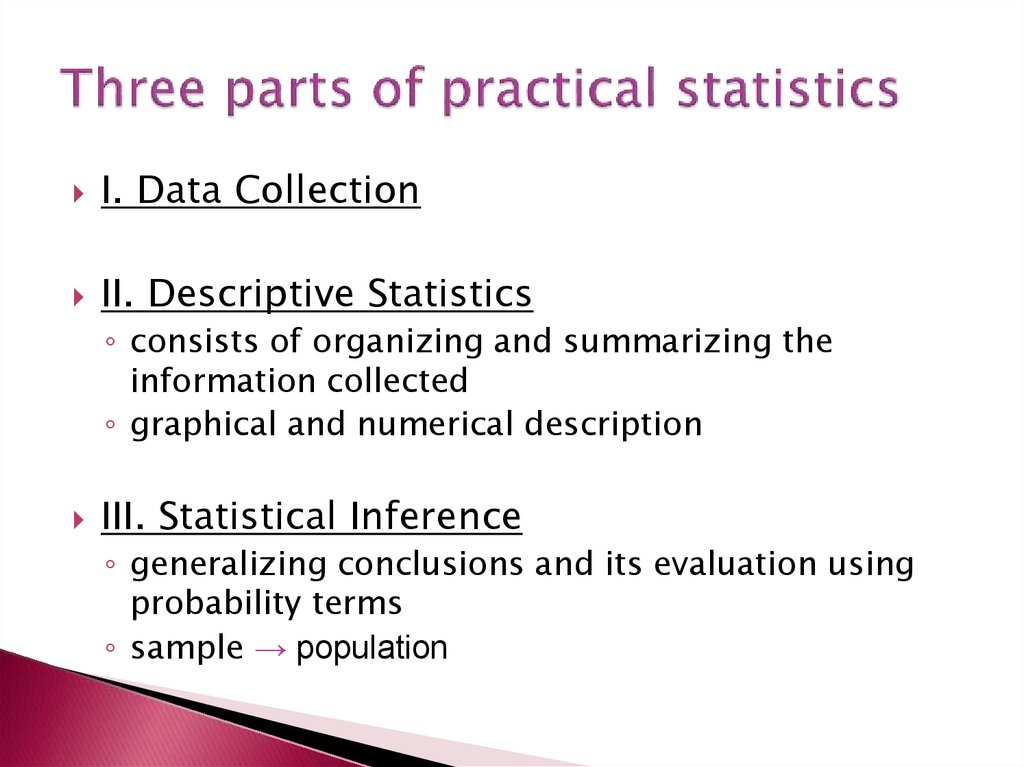
I. Data CollectionII. Descriptive Statistics
◦ consists of organizing and summarizing the
information collected
◦ graphical and numerical description
III. Statistical Inference
◦ generalizing conclusions and its evaluation using
probability terms
◦ sample → population
12.
a censussurvey samples
designed experiments
existing data sources
13.
simple random samplestratified sample
systematic sample
cluster sample
14.
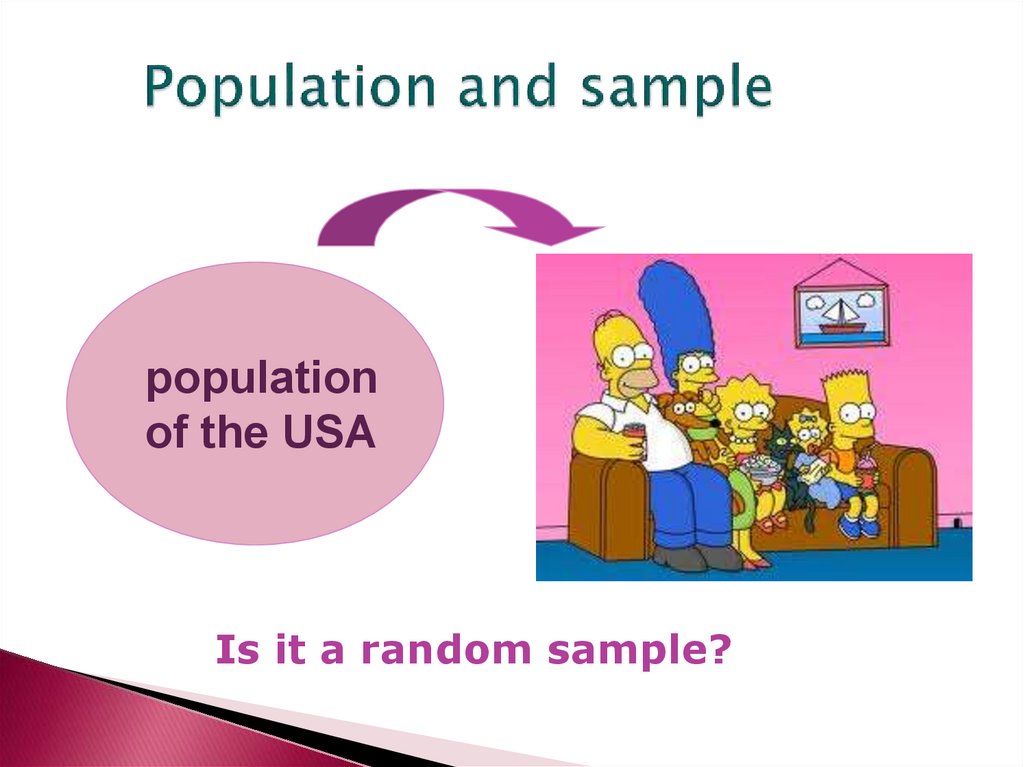
populationof the USA
Is it a random sample?
15.
A population can be◦ very general (all human beings)
OR
◦ very narrow (all male ginger cats called Bob)
BUT
◦ in praxis we collect data from samples and
use these data to infer about
the population as a whole
◦ e.g. election survey, medical research survey,
biological experiments, computer literacy
survey
16.
Population – CULS studentsSample – students of statistical course
Is it a random sample?
Unit – a concrete student
Variables – age, height, number of
siblings, hair colour, …
17.
methods used to describe and graph the datadepend on the type of a variable
18.
Variable – any characteristic of a person, group, orenvironment (it means a statistical unit) that can
vary or denote a difference
(e.g. age, political ideology, pollution count)
Data – numbers collected as a result of
observations, interviews, this is set of information
for a sample of units
Statistic – number describing a characteristic of
a sample (e.g. average age of a sample of CULS
students, percentage of students successfully
passing the exam)
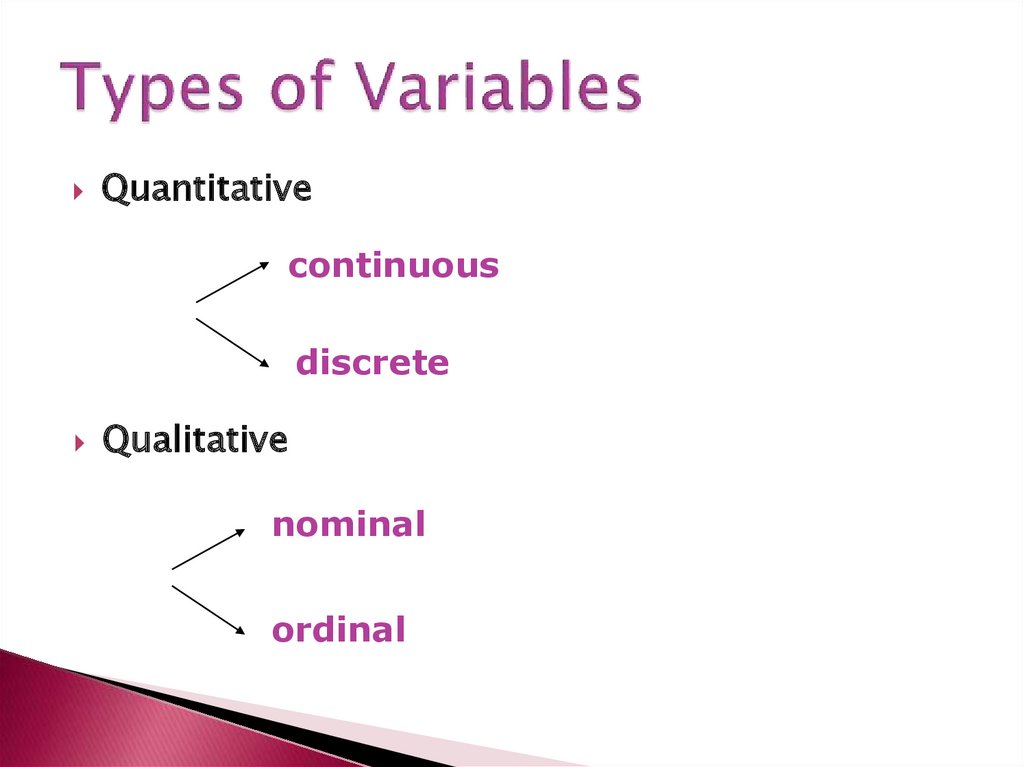
19.
Quantitativecontinuous
discrete
Qualitative
nominal
ordinal
20.
heightvital capacity
number of
siblings
hair colour
level of education
21.
How to handle with qualitative variables?We are usually not working with original
values (words), but we use variable coding.
variable GENDER
◦ values – female, male
◦ coding – female → 1
– male → 2
22.
with ordinal variables it is recommended touse a scale that reflects the order of the
values
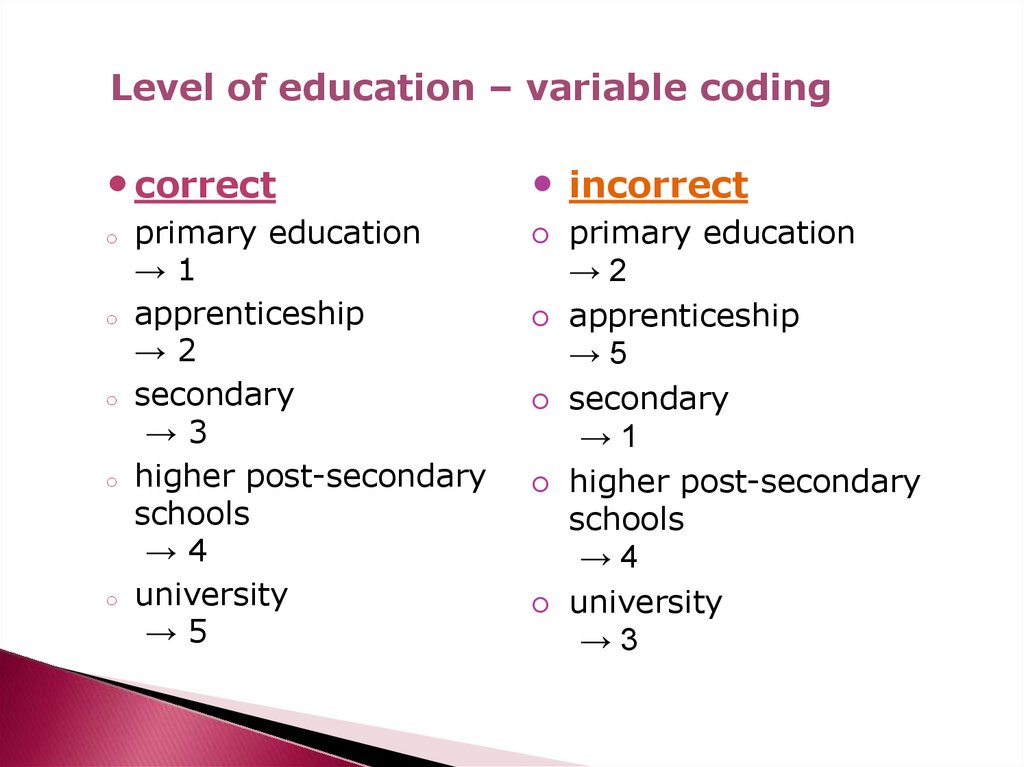
23.
Level of education – variable coding• correct
o
o
o
o
o
primary education
→1
apprenticeship
→2
secondary
→3
higher post-secondary
schools
→4
university
→5
• incorrect
primary education
→2
apprenticeship
→5
secondary
→1
higher post-secondary
schools
→4
university
→3
24.
qualitativevariable
25.
quantitativevariable
26.
IDname
3407 Zora Mlčochová
3698 Beata Nová
date of
birth
degree
assistant
12.6.1980 professor
VARIABLES
lenght of
praxis (years)
6
35
1247 Petra Šulcová
12.5.1945 docent
assistant
3.2.1978 professor
assistant
13.11.1962 professor
3408 Jana Rychlá
5.4.1975
assistant
9
1266 Jaroslav Tichý
3.3.1963
docent
23
1354 Helena Veselá
16.9.1964 docent
24
1058 Petr Krátký
23.10.1956 professor
assistant
6.4.1973 professor
31
1135 Jan Spurný
3245 Květa Pešková
8
23
12
27.
date ofbirth
degree
lenght of
praxis (years)
12.6.1980
2
6
3
35
2
8
1247 Petra Šulcová
13.11.1962
1 – assistant
3408 2 Jana
Rychlá professor
5.4.1975
–assistant
3 – docent
1266 Jaroslav Tichý
3.3.1963
4 - professor
1354 Helena Veselá
16.9.1964
2
23
1
9
3
23
3
24
1058 Petr Krátký
23.10.1956
4
31
3245 Květa Pešková
6.4.1973
2
12
ID
name
3407 Zora Mlčochová
VARIABLES
3698 Beata
Nová
12.5.1945
with coding for variable
1135 Jan Spurný
„degree“ 3.2.1978
28.
IDname
3407 Zora Mlčochová
3698 Beata Nová
date of
birth
degree
assistant
12.6.1980 professor
lenght of
praxis (years)
6
35
1247 Petra Šulcová
12.5.1945 docent
assistant
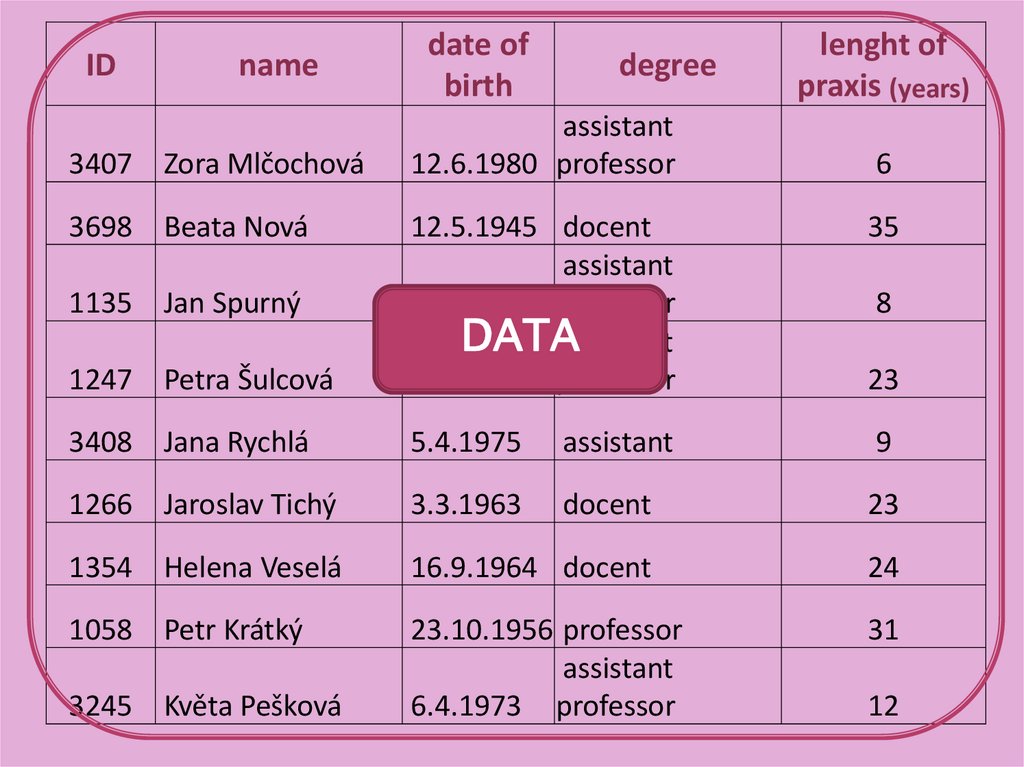
3.2.1978 professor
each row represents
one
assistant
13.11.1962UNIT
professor
3408 Jana Rychlá
5.4.1975
assistant
9
1266 Jaroslav Tichý
3.3.1963
docent
23
1354 Helena Veselá
16.9.1964 docent
24
1058 Petr Krátký
23.10.1956 professor
assistant
6.4.1973 professor
31
1135 Jan Spurný
3245 Květa Pešková
8
23
12
29.
IDname
3407 Zora Mlčochová
3698 Beata Nová
date of
birth
degree
assistant
12.6.1980 professor
lenght of
praxis (years)
6
35
1247 Petra Šulcová
12.5.1945 docent
assistant
3.2.1978 professor
DATAassistant
13.11.1962 professor
3408 Jana Rychlá
5.4.1975
assistant
9
1266 Jaroslav Tichý
3.3.1963
docent
23
1354 Helena Veselá
16.9.1964 docent
24
1058 Petr Krátký
23.10.1956 professor
assistant
6.4.1973 professor
31
1135 Jan Spurný
3245 Květa Pešková
8
23
12
30.
average length of praxis is 19 years3 out of 9 lecturers (30%) are „docents“
STATISTICS
31.
Inferential statistics uses methods that takethe results obtained from a sample, extend
them to the population, and measures the
reliability of the result.