


 Программное обеспечение
Похожие презентации:


Data PowerPoint
1.
DATAPOWERPOINT
Template by HubSpot
2.
Thanks for downloading this resource.How to Use This Template:
• Use this presentation as a guide/inspiration for your own PowerPoints. Format the
presentation using your brand’s colors, fonts, images, and style.
• Add new slides using the “New Slide” button in the toolbar.
• These templates are for both Mac and PC users, but if anything shows up a little
funky or misaligned, just adjust to the slide and shift around anything that may appear
different.
• Use the elements you need. If you like a text box or layout from one slide, copy & paste
it onto another and mix and match designs.
3.
Sharpen yourskills
With HubSpot
Academy
Take free courses
on Inbound
Marketing, Sales,
and Customer
Service
Visit https://bit.ly/3auUHUl
to Get Started Free
4.
PresentationBest Practices
• Use this presentation as a guide/inspiration for your own PowerPoints.
Format the presentation using your brand’s colors, fonts, images, and style.
• Add new slides using the “New Slide” button in the toolbar.
• These templates are for both Mac and PC users, but if anything shows up a
little funky or misaligned, just adjust to the slide and shift around anything that
may appear different.
• Use the elements you need. If you like a text box or layout from one slide, copy
& paste it onto another and mix and match designs.
5.
Presenter: Chris Pierce6.
AgendaIntroductions
Q1 Recap
Q2 Goals
Q3 Projections
7.
1Introduce a new section here.
What’s this section about?
8.
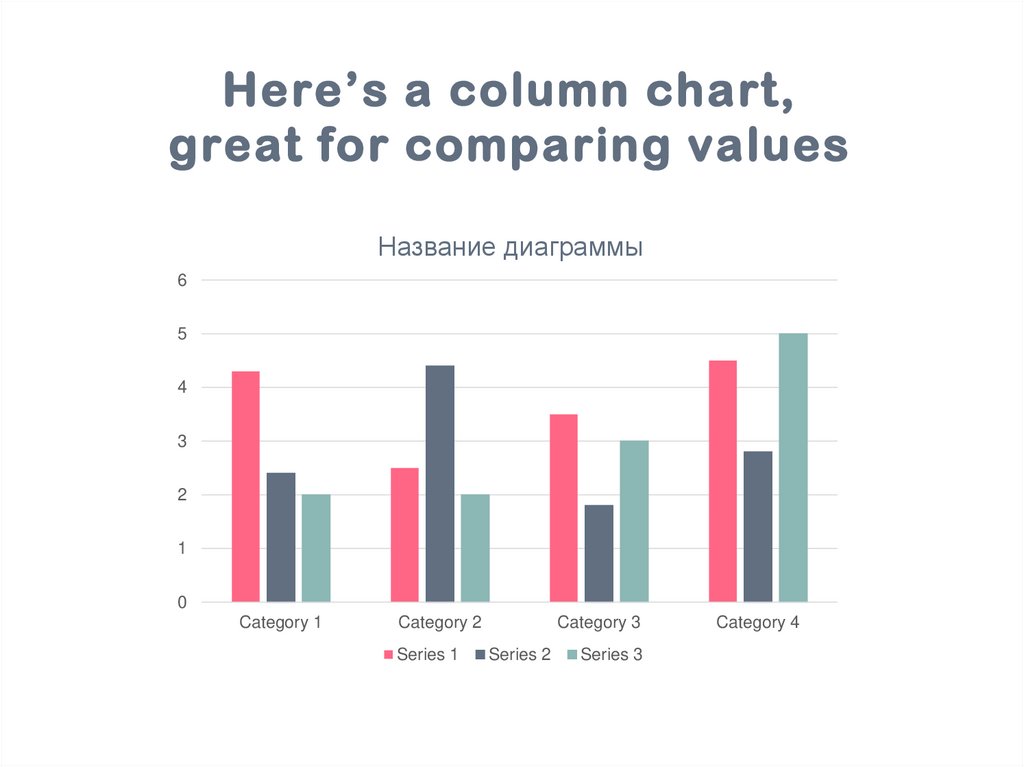
Here’s a column chart,great for comparing values
Название диаграммы
6
5
4
3
2
1
0
Category 1
Category 2
Series 1
Category 3
Series 2
Series 3
Category 4
9.
100%of people think this slide
is a great way to display
a statistic.
Source: Insert Here
10.
2Introduce a new section here.
What’s this section about?
11.
Use the line graph below tocompare values over time
Название диаграммы
6
5
4
3
2
1
0
Category 1
Category 2
Series 1
Category 3
Series 2
Series 3
Category 4
12.
100%of people think this slide
is a great way to display
a statistic.
Source: Insert Here
13.
3Introduce a new section here.
What’s this section about?
14.
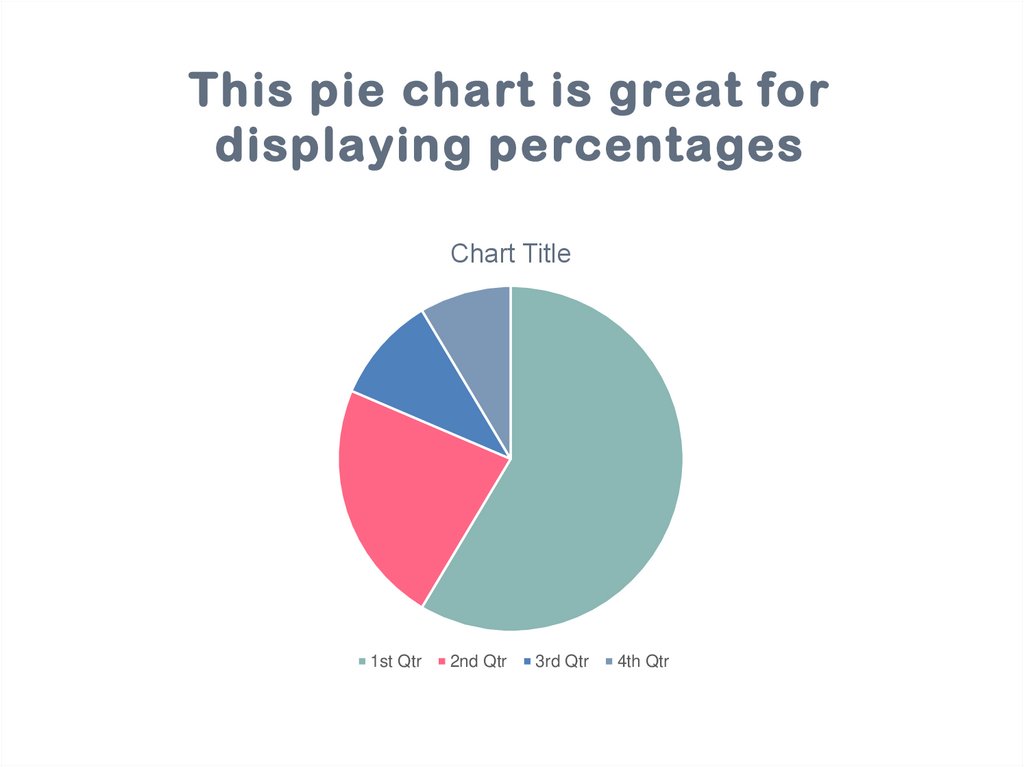
This pie chart is great fordisplaying percentages
Chart Title
1st Qtr
2nd Qtr
3rd Qtr
4th Qtr
15.
100%of people think this slide
is a great way to display
a statistic.
16.
QUESTIONS?17.
Grow your traffic, convert leads, andprove ROI with our all-in-one marketing
software.
Visit bit.ly/2zfjZD4 for a free demo.