


 Программное обеспечение
Похожие презентации:


Drawing inspection data graphs with amChart
1.
Drawing inspection data graphs with amChart_OrderSheet1. Background
We want to modify a web page so that the inspection data graphs, which were created as images
and posted on the web page, will be rendered directly from Json in JS as appropriate.
2. Deliverables
Source code for the rendering process
- Please share the newly created github private repository and push to it.
3.Details
Please create the code to draw the graphs from the sample data we give you.
For more details, please refer to page 4 of the slide.
4. Required skills
Please refer to page 3 of the slide.
© COPYRIGHT 2021 FIXER inc.
1
2.
Drawing inspection data graphs with amChart_OrderSheet5. Deadlines and Procedures
- Deadline
- Tuesday, February 15 (Japan time)
- Procedures
- In order to prevent rework, please show us your interim deliverables as appropriate.
- Roughly once a day.
6. Rewards
Please provide a cost estimate at the time of application.
7. other
If you submit good work, we may ask you to continue to work on other projects.
If you have any questions, please do not hesitate to ask.
Thank you for your cooperation.
© COPYRIGHT 2021 FIXER inc.
2
3.
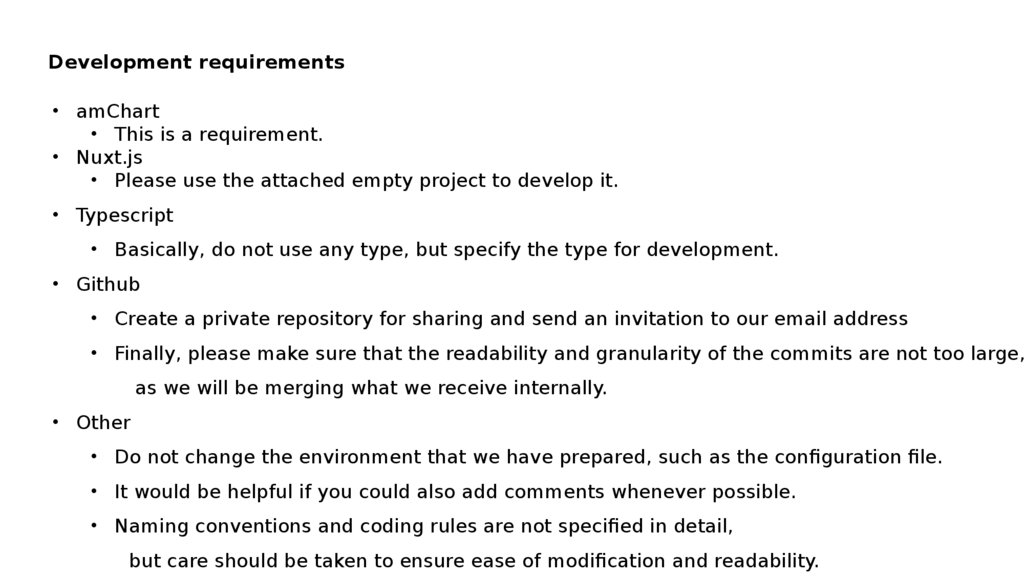
Development requirements• amChart
• This is a requirement.
• Nuxt.js
• Please use the attached empty project to develop it.
• Typescript
• Basically, do not use any type, but specify the type for development.
• Github
• Create a private repository for sharing and send an invitation to our email address
• Finally, please make sure that the readability and granularity of the commits are not too large,
as we will be merging what we receive internally.
• Other
• Do not change the environment that we have prepared, such as the configuration file.
• It would be helpful if you could also add comments whenever possible.
• Naming conventions and coding rules are not specified in detail,
but care should be taken to ensure ease of modification and readability.
4.
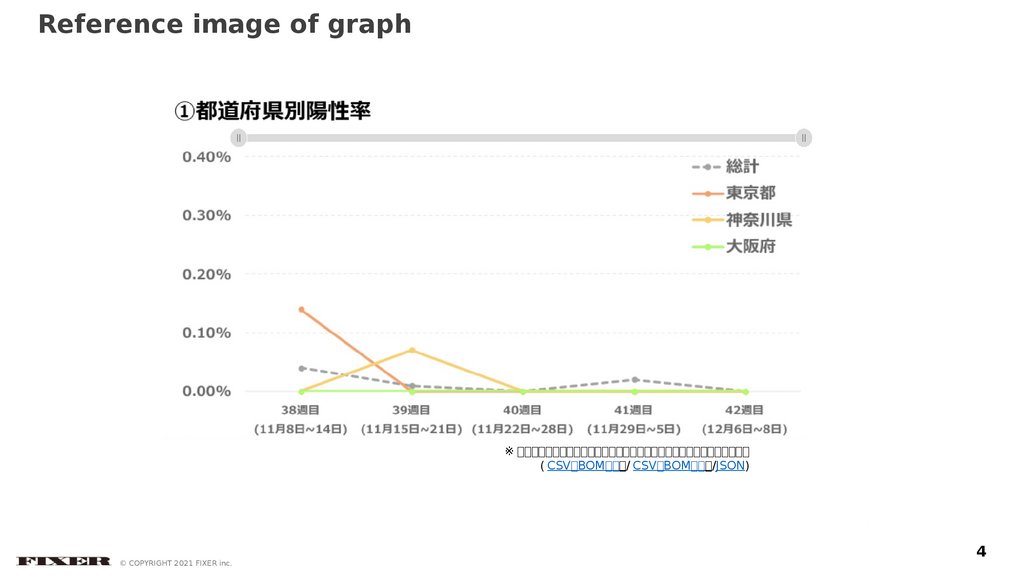
Reference image of graph※ このグラフで利用しているデータはダウンロードして利用いただけます。
( CSV BOMあり / CSV BOMなし /JSON)
© COPYRIGHT 2021 FIXER inc.
4
5.
Reference image of graphDraw
four line graphs
4 つの凡例におよびそれに応じた
4つ
in
and according to
の折れ線グラフを描画してください
- “ 総計”
the
four legends.
- 総計”
“
= "Total."
“ 東京都”
-“ 東京都”
= "Tokyo."
“ 神奈川県”
- 神奈川県”
“
“ 大阪府” = "Kanagawa
Prefecture."
“ 大阪府” = "Osaka
Prefecture."
Also, please have the
ability to show/hide
the graphs by clicking
on the legends.
神奈川県 : 陽性率 _0.088, 検査数 _xxx
総計 : 陽性率 _0.018, 検査数 _xxx
大阪府 : 陽性率 _0.088, 検査数 _xxx
On mouse-over, please
show the positive rate
and number of tests for
the corresponding
week
東京都 : 陽性率 _0.018, 検査数 _xxx
39 週目
※ このグラフで利用しているデータはダウンロードして利用いただけます。
( CSV BOMあり / CSV BOMなし /JSON)
Please place a
download link for the
inspection data.
© COPYRIGHT 2021 FIXER inc.
Please
it
1 ~ 46 make
週分のデータを表示できる
possible
to display
ようにしてください
data
for 1 ~ 46 weeks
- 横軸の拡大縮小およびスクロール機能
-を持たせてください
Please provide
horizontal axis scaling
and scrolling
functions.
- If the size is smaller
than a certain
amount, please hide
the parentheses ( 〇月〇
日 ~ 〇日 ).
- If it is enlarged,
please redisplay it
5
6.
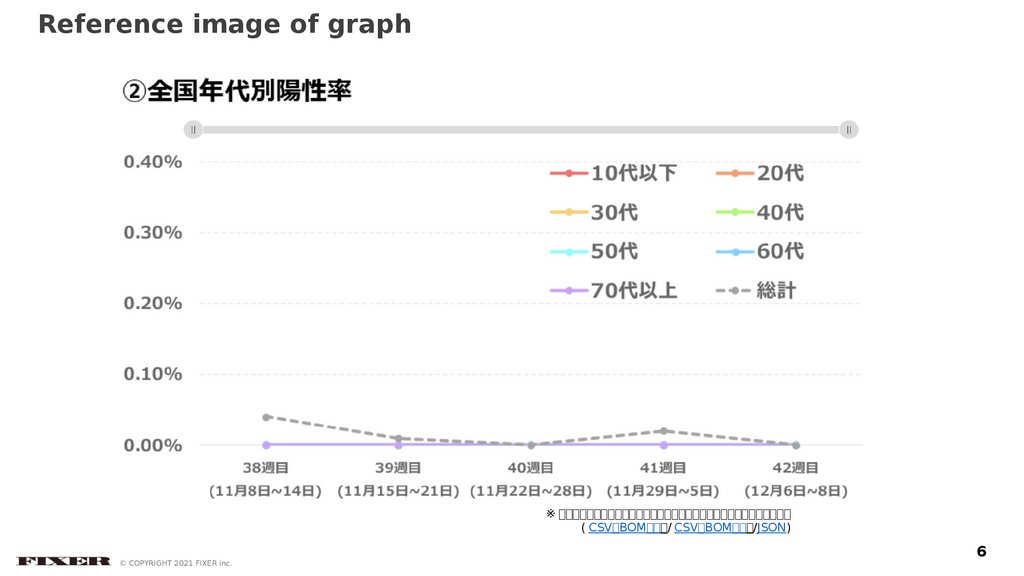
Reference image of graph※ このグラフで利用しているデータはダウンロードして利用いただけます。
( CSV BOMあり / CSV BOMなし /JSON)
© COPYRIGHT 2021 FIXER inc.
6
7.
Reference image of graph総計 : 陽性率 _0.012, 検査数 _xxx
70 台以上 : 陽性率 _0.003, 検査数 _xxx
50 代 : 陽性率 _0.000, 検査数 _xxx
- Draw eight line
graphs for each of
the eight legends
and the
corresponding eight
line graphs.
- "Under 10s", "20s",
"30s", "40s", "50s",
"60s", "Over 70s"
- "Total."Also, please
have the ability to
show/hide the
graphs by clicking
on the legends.
10 代以下 : 陽性率 _0.000, 検査数 _xxx
30 代 : 陽性率 _0.000, 検査数 _xxx
20 代 : 陽性率 _0.000, 検査数 _xxx
40 代 : 陽性率 _0.000, 検査数 _xxx
On mouse-over, please
show the positive rate
and number of tests for
the corresponding
week
60 代 : 陽性率 _0.000, 検査数 _xxx
39 週目
© COPYRIGHT 2021 FIXER inc.
Please place a
download link for the
inspection data.
※ このグラフで利用しているデータはダウンロードして利用いただけます。
( CSV BOMあり / CSV BOMなし /JSON)
Please
it
1 ~ 46 make
週分のデータを表示できる
possible
to display
ようにしてください
data
for 1 ~ 46 weeks
- 横軸の拡大縮小およびスクロール機能
-を持たせてください
Please provide
horizontal axis scaling
and scrolling
functions.
- If the size is smaller
than a certain
amount, please hide
the parentheses ( 〇月〇
日 ~ 〇日 ).
- If it is enlarged,
please redisplay it
7
8.
9.
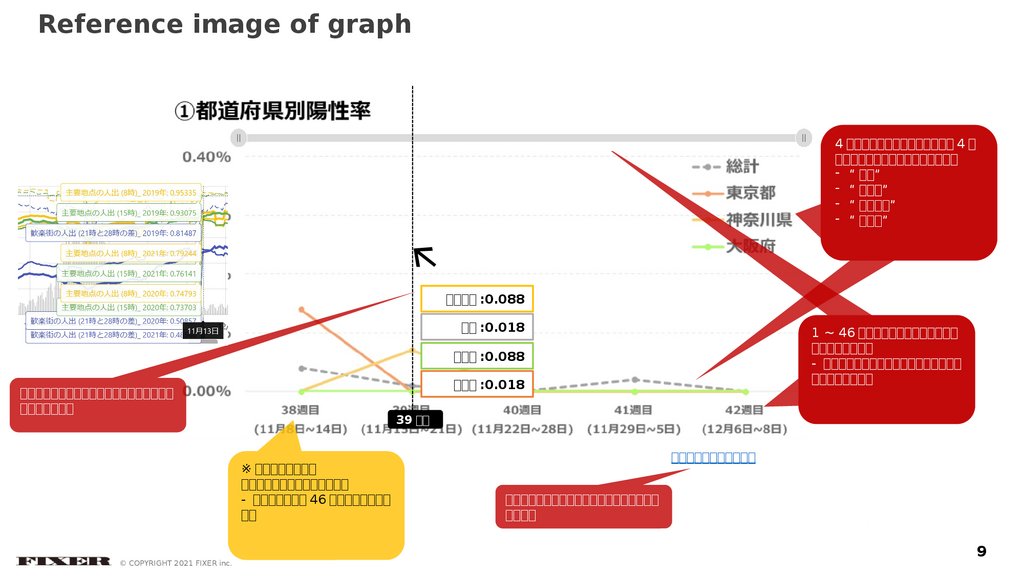
Reference image of graph4 つの凡例におよびそれに応じた 4 つ
の折れ線グラフを描画してください
- “ 総計”
- “ 東京都”
- “ 神奈川県”
- “ 大阪府”
神奈川県 :0.088
総計 :0.018
1 ~ 46 週分のデータを表示できるよ
うにしてください
- 横軸の拡大縮小およびスクロール機能を
持たせてください
大阪府 :0.088
東京都 :0.018
マウスオーバーした際、該当週の陽性率を表
示してください
39 週目
※ サトケンさん確認
ラベルの表記どうしましょう
- 現状の表示だと 46 週分表示すると潰
れる
© COPYRIGHT 2021 FIXER inc.
検査データダウンロード
検査データのダウンロードリンクを設置して
ください
9