


 Экономика
Похожие презентации:


")


Business statistics
1. BUSINESS STATISTICS
KOLESNIKOVA IRINAIVANOVNA
DEPARTMENT OF STATISTICS
2nd building, 217 room
(017) 209-88-51
KLSNK_A@TUT.BY
2. LITERATURE
1. Siegel, Andrew F. Practical Business Statistics. Sixthedition. Amsterdam: Academic Press. – 2015. - 619 p.
2. Andersen, T.G. Davis, R.A., Kreib, J.P., Mikosch, T.
Handbook of Financial Time Series // Andersen T. et al.
(Eds.). Springer, 2009. – 1024 p.
3. Box, G.E.P., Jenkins, J.M., Reinsel, G.C. Time Series
Analysis: Forecasting and Control. – 4th ed. Wiley, 2008.
– 756 p.
4. Krehbiel, Timothy C, Levin, David M, Berenson, Mark
L, Basic Business Statistics. Concept and applications.
12th Edition, Prentice Hall, 2011. - 890p.
5. Lind, D. A., Marchal, W. G., Wathen, S. A.. Basic
Statistics for Business & Economics. 8 edition. McGrawHill Higher Education – 2013.
3.
6.Сигел, Э. Практическая бизнесстатистика: Пер. с англ. / Э.Сигел. – М.:Издательский дом «Вильямс», 2002. 1056 с.
7.Колесникова, И.И. Статистика.
Практикум: учеб. пособие. / И.И.
Колесникова, Г.В. Круглякова. – Минск.:
Вышэйшая школа, 2011. – 285с.
8.Образцова, О.И. Статистика
предприятий и бизнес-статистика: учеб.
пособие / О.И. Образцова. - М.: Изд. дом
Высшей школы экономики, 2011. – 704 с.
4. Business Statistics
What and Why5.
Welcome to the world of statistics. This is aworld you will want to get comfortable with
because you will make better management
decisions when you know how to assess the
available information and how to ask for
additional facts as needed. How else can you
expect to manage 12 divisions, 683 products,
and 5809 employees?
And even for small business, you will need to
understand the larger business
environmental of potential customers and
competitors it operates within.
6.
The early chapters will introduce you tothe role of statistics and data mining in
business management to the various
types of data sets. Next chapter will show
you a good way to see the basic facts
about a list of numbers – by looking at a
histogram. Fundamental summary
numbers (such as average, median,
percentiles, etc. ) will be explained in the
next chapter. One reason statistical
methods are so important is that there is
so much variability out there that gets in
the way of message in the data.
7.
Is knowledge of statistics really necessaryto be successful in business? Or is it
enough to rely on intuition, experience,
and hunches? Let’s put in another way:
Do you really want to ignore much of the
vast potentially useful information out
there that comes in the form of data?
8.
Is statistics difficult?Statistics is no more difficult than any other
field of study. Naturally, some hard work is
needed to achieve understanding of the
general ideas and concepts. Although some
attention to details and computation is
necessary, it is much easier to become an
expert user of statistics than it is to become
an expert statistician trained in all of the fine
details. Statistics is easier than it used to be
now that personal computers can do the
repetitive number-crunching tasks, allowing
you to concentrate on interpreting the results
and their meaning.
9.
Although a few die-hard purists maybemoan the decline of technical detail in
statistics teaching, it is good to see that
these details are now in their proper
place; life is too short for all human being
to work out the intricate details of
techniques such as long division and
matrix inversion.
10.
Does learning statistics decrease yourdecision-making flexibility?
Knowledge of decisions enhances your
ability to make good decisions. Statistics
is not a rigid, exact science and should
not get in the way of your experience and
intuition. By learning about data and the
basic properties of uncertain events, you
will help solidify the information on which
your decisions are based, and you will
add a new dimension to your intuition.
11.
Think of statistical methods as acomponent of decision making, but not
the whole story. You want to supplement
– not replace – business experience,
common sense, and intuition.
12. Introduction into Business statistics
Introduction intoBusiness Statistics
13. СHAPTER QUESTIONS
1.2.
3.
4.
5.
6.
7.
Definition of the term ‘statistics’.
Statistical Methods
Functions of Statistics
Key Terms: Data, Population, Parameter,
Sample, Variables (Independent and
Dependent). Types Of Variables
Descriptive аnd Inferential statistics
Data Sources
Worthiness Evaluating Survey
14. Chapter Goals
After completing this chapter, you shouldbe able to:
Explain how decisions are often based on incomplete
information
Explain key definitions:
Population vs. Sample
Parameter vs. Statistic
Descriptive vs. Inferential Statistics
Describe random sampling
Explain the difference between Descriptive and
Inferential statistics
Statistics for Business and
Economics, 6e © 2007 Pearson
Education, Inc.
Chap 1-14
15. Introduction
The word “statistics” is very popularly used inpractice. It conveys a variety of meanings to
people, many of which are inaccurate or, at
the very least, misleading.
The average persons conceive of “statistics”
as column of figures, zigzag graphs or tables
like statistics of production, consumption, per
capita income, imports, exports, crimes,
divorce, share prices, etc.
16.
Such statistics are quite commonly found innewspapers, journals, reports and one can
hear them on radio, television, classroom
lectures and so on.
For example, one may find statements like
“the production of food grains is expected to
decrease from 192.3 m tones in 1997-98 to
183.2 m tones in 2002-03.
17.
In addition to meaning numerical facts,“statistics” also refers to a subject, just as
‘mathematics’ as well as symbols, formulae
and theorems.
Thus, the word ‘statistics’ refers either to
quantitative information or to a method of
dealing with quantitative information.
18. What is statistics?
Statistics is the art and science ofcollecting and understanding data.
Since data refers to any kind of
recorded information, statistics
plays an important role in many
human endeavors.
19. Definition
There have been many definitions of theterm ‘statistics’- indeed scholarly articles
have carefully collected together hundreds
of definitions, some have defined statistics
as statistical data whereas others as
statistical methods.
Croxton and Cowden – “Statistics may be
defined as a science of collection,
presentation, analysis and interpretation of
numerical data.”
20.
Statistics Looks at the Big PictureWhen you have a large, complex
assemblage of many small pieces of
information, statistics can help you classify
and analyze the situation, providing a
useful overview and summary of the
fundamental features in the data. If you
don’t yet have the data, then statistics can
help you collect them, ensuring that your
questions can be answered and that you
spend enough (but not too much) effort in
the process.
21. Statistics in Management
What should a manager know about statistics?Your knowledge should include a broad overview
of the basic concepts of statistics, with some
details. You should be aware that the world is
random and uncertain in many aspects. You
should be able to effectively perform two
important activities:
1. Understand and use the results of statistical
analysis as background information in your work.
2. Play the appropriate leadership role during the
course of a statistical study if you are responsible
for the actual data collection and/or analysis.
22.
To fulfill these roles, you do not need to be ableto perform a complex statistical analysis by
yourself. However, some experience with actual
statistical analysis is essential for you to obtain
the perspective that leads to effective
interpretation.
Experience with actual analysis will also help
you to lead other to sound results and to
understand what they are going through.
Moreover, there may be times when it will be
most convenient for you to do some analysis on
your own. Thus, we will concentrate on the
ideas and concepts of statistics, reinforcing
these with practical examples.
23. The five basic activities of statistics
In the beginning stages of a statistical study,either there are not yet any data or else it
has not yet been decided what data to
look closely at.
The design phase will resolve these
issues so that useful data will result.
Once data are available, an initial
inspection is called for, provided by the
exploratory phase.
24.
In the modeling phase, a system ofassumptions and equations is selected in
order to provide a framework for further
analysis.
A numerical summary of an unknown
quantity, based on data, is the result of the
estimation process.
The last of these basic activities is
hypothesis testing, which uses the data
to help you decide what the world is really
like in some respect.
We will now consider these five activities in
turn.
25.
26. Designing a Plan for Data Collection -
Designing a Plan for Data Collection might be called sample survey design for amarketing study or experimental design for a
chemical manufacturing process optimization study.
This phase of designing the study involves
planning the details of data gathering. A careful
design can avoid the cost and disappointment of
finding out – too late – that the data collected are
not adequate to answer the important questions. A
good design will also collect just the right amount
the data: enough to be useful, but not so much as to
be wasteful. Thus, by planning ahead, you can help
ensure that the analysis phase will go smoothly and
hold down the cost of the project.
27.
Statistics is particularly useful when youhave a large group of people, firms, or
other items (the population) that you would
like to know about but can’t reasonable
afford to investigate completely. Instead, to
achieve a useful but imperfect
understanding of this population, you
select a smaller group (the sample)
consisting of some – but not all – of the
items in the population. The process of
generalizing from the observed sample to
the larger population is known as statistical
inference.
28.
The random sample is one ofthe best ways to select a
practical sample, to be studied
in detail, from a population
that is too large to be
examined in its entirety. By
selecting randomly, you
accomplish two goals:
29.
1. You are guaranteed that the selectionprocess is fair and proceeds without bias; that
is, all items have an equal chance of being
selected. This assures you that, on average,
samples will be representative of the
population (although each particular random
sample is usually only approximately, and not
perfectly, representative).
2. The randomness, introduced in a controlled
way during the design phase of the project, will
help ensure validity of the statistical inferences
drawn later.
30. Exploring the Data
As soon as you have a set of data, youwill want to check it out. Exploring the data
involves looking at your data set from
many angles, describing it, and
summarizing it. In this way you will be able
to make sure that the data are really what
they are claimed to be and that there are
no obvious problems. But good exploration
also prepares you for the formal analysis
in either of two ways:
31.
Exploration is the first phase once you have data to look at. It is often not enough to rely on a formal, a1. By verifying that the expected
relationships actually exist in the
data, thereby validating the planned
techniques of analysis.
2. By finding some unexpected
structure in the data that must be
taken into account, thereby
suggesting some changes in the
planned analysis.
32.
Exploration is the first phase once you havedata to look at. It is often not enough to rely on
a formal, automated analysis, which can be
only as good as the data that go into the
computer and which assumes that the data set
is “well behaved”. Whenever possible,
examine the data directly to make sure to look
OK: That is, there are no large errors, and the
relationships observable in the data are
appropriate to the kind of analysis to be
performed. This phase can help in (1) editing
the data for errors, (2) selecting an appropriate
analysis, (3) validating the statistical
techniques that are to be used in further
analysis.
33. Modeling the Data
In statistics, a model is a system ofassumption and equations that can
generate artificial data similar to the data
you are interested in, so that you can work
with a few numbers (called parameters)
that represent the important aspects of the
data. A model can be a very effective
system within which questions about largescale properties of the data can be
answered.
34.
Here are some models that can beuseful in analyzing data. Notice that each
model generates data with the general
approach “data equals structure plus
noise”, specifying the structure in
different ways. In selecting a model, it
can be very useful to consider what you
have learned by exploring the data.
35.
1. Consider a simple model that generatesartificial data consisting of a single number plus
noise. Follows we explore how to extract
information about the single number and how to
describe the noise.
2. Consider a model that generates pairs of
artificial noisy data values that are related to each
other. Next we’ll show some useful models for
describing the nature and extent of the
relationship and the noise.
3. Consider a model that generates a series of
noisy data values where the next one is related to
the previous one.
36. Estimating an Unknown Quantity
- produces the best educatedguess possible based on the
available data. We all want
estimates of things that are just
plan impossible to know exactly.
Here are some examples of
unknowns to be estimated:
37. Estimating an Unknown Quantity
1.2.
3.
4.
5.
6.
Next period (quarter’s) sales.
What the government will do next to our tax
rates.
How the population of region will react to a
new product.
How your portfolio of investment will fare
next year.
The productivity gains of a change in
strategy.
The defect rate in a manufacturing process.
38.
Statistics can shed light on some of thesesituations by producing a good, educated
guess when reliable data are available.
Keep in mind that all statistical estimates
are just guesses and are, consequently,
often wrong. However, they will serve their
purpose when they are close enough to
the unknown truth to be useful. If you
knew how accurate these estimates were
(approximately), you could decide how
much attention to give them.
39.
Statistical estimation also provides anindication of the amount of uncertainty
or error involved in the guess,
accounting for the consequences of
random selection of a sample from a
large population. The confidence
interval gives probable upper and lower
bounds on the unknown quantity being
estimated, as if to say, I’m not sure
exactly what the answer is, but I’m quite
confident it’s between these two
number.
40. Hypothesis testing
Statistical hypothesis testing is the use ofdata in deciding between two (or more)
different possibilities in order to resolve an
issue in an ambiguous situation. Hypothesis
testing produces a definite decision about
which of the possibilities is correct, based on
data. The procedure is to collect data that will
help decide among the possibilities and to use
careful statistical analysis for extra power
when the answer is not obvious from just
glancing at the data.
41.
Here are some examples of hypothesis that mightbe tested using data:
1. The average New Yorker plans to spend at least
10$ on your product next month.
2. You will win tomorrow’s election.
3. A new medical treatment is safe and effective.
4. Brand X produces a whiter, brighter wash.
5. The error in a financial statement is smaller
than some material amount.
6. It is possible to predict the stock market based
on careful analysis of the past.
7. The manufacturing defect rate is below that
expected by customers.
42.
Notethat each hypothesis
makes a definite statement, and
it may be either true or false.
The result of a statistical
hypothesis test is the
conclusion that either the data
support the hypothesis or they
don’t.
43.
44. What is “Statistics”?
Statistics is the science of data thatinvolves:
Collecting
Classifying
Summarizing
Organizing and
Interpretation
45. Statistical Methods
The methods by which statistical data areanalyzed are called statistical methods.
Statistical methods are applicable to a very
large number of fields- economics, sociology,
anthropology,
business,
agriculture,
psychology, medicine and education.
Statistical methods are used by governmental
bodies, private business firms, and research
agencies as an indispensable aid in
i) forecasting ii) controlling and iii) exploring.
46. Statistical Methods
There are fiveinvestigation:
stages
in
a
statistical
1.Collection: Utmost care must be exercised in
collecting data because they form the foundation
of statistical analysis. If data are faulty, the
conclusion drawn can never be reliable. The
data may be available from existing published or
unpublished sources or else may be collected by
investigator himself.
47.
2. Organization: Data from published sourcesare generally in organized form. Data from
survey needs organization. The first step is data
editing so that the omissions, inconsistencies,
irrelevant answers and wrong computation in the
returns may be corrected or adjusted. The
second step is to classify data and the last step
is tabulation of data-arrange data in rows and
columns.
48.
3.Presentation: After the data have beencollected and organized, they are ready for
presentation. It facilitates statistical analysis.
4. Analysis: Data are analyzed mostly in tabular
form. Methods used are numerous ranging from
simple observation of data to complicated,
sophisticated
and
highly
mathematical
techniques.
49.
5.Interpretation: Drawing conclusions from thedata collected and analyzed. It is a difficult task
and necessitates a high degree of skills and
experience. Correct interpretation will lead to a
valid conclusion of the study and thus can aid in
decision-making.
50. Statistics: Science or Art
Whether statistics is a science or an art is often a subjectof debate. Science refers to a systematized body of
knowledge. It studies cause and effect relationship and
attempts to make generalizations in the form of scientific
principles or laws. It describes facts objectively and
avoids vague judgments as good as bad.
Science, in short, is like a lighthouse that gives light to
the ships to find out their own way but does not indicate
the direction in which they should go.
51.
Art, on the other hand, refers to the skill ofhandling facts so as to achieve a given
objective. It is concerned with ways and
means of presenting and handling data,
making inferences logically and drawing
relevant conclusions.
If science is knowledge, the art is action.
52. Functions of Statistics
Definiteness: To present general statements in a precise anddefinite form. The sex ratio (i.e. number of females per 1000males)
is going up in Belarus.
The sex ratio has gone up from 927 in 1991 to 933 in 2001.
Condensation: It simplifies mass of data into a few significant
figures.
Comparison: It facilitates comparison.
53.
Formulating and testing Hypothesis: Statisticalmethods are extremely useful in formulating
and testing hypothesis and to develop new
theories.
Prediction: Statistical methods provide helpful
means of forecasting future events.
Formulation of policies: Statistics provide the
basic material for framing suitable policies.
How much oil a nation should import in 2005.
54. Dealing with Uncertainty
Everyday decisions are based onincomplete information
Consider:
The price of IBM stock will be higher in six months
than it is now.
If the federal budget deficit is as high as predicted,
interest rates will remain high for the rest of the year.
Statistics for Business and
Economics, 6e © 2007 Pearson
Education, Inc.
Chap 1-54
55. Dealing with Uncertainty
(continued)Because of uncertainty, the statements
should be modified:
The price of IBM stock is likely to be higher in six
months than it is now.
If the federal budget deficit is as high as predicted, it
is probable that interest rates will remain high for the
rest of the year.
Statistics for Business and
Economics, 6e © 2007 Pearson
Education, Inc.
Chap 1-55
56.
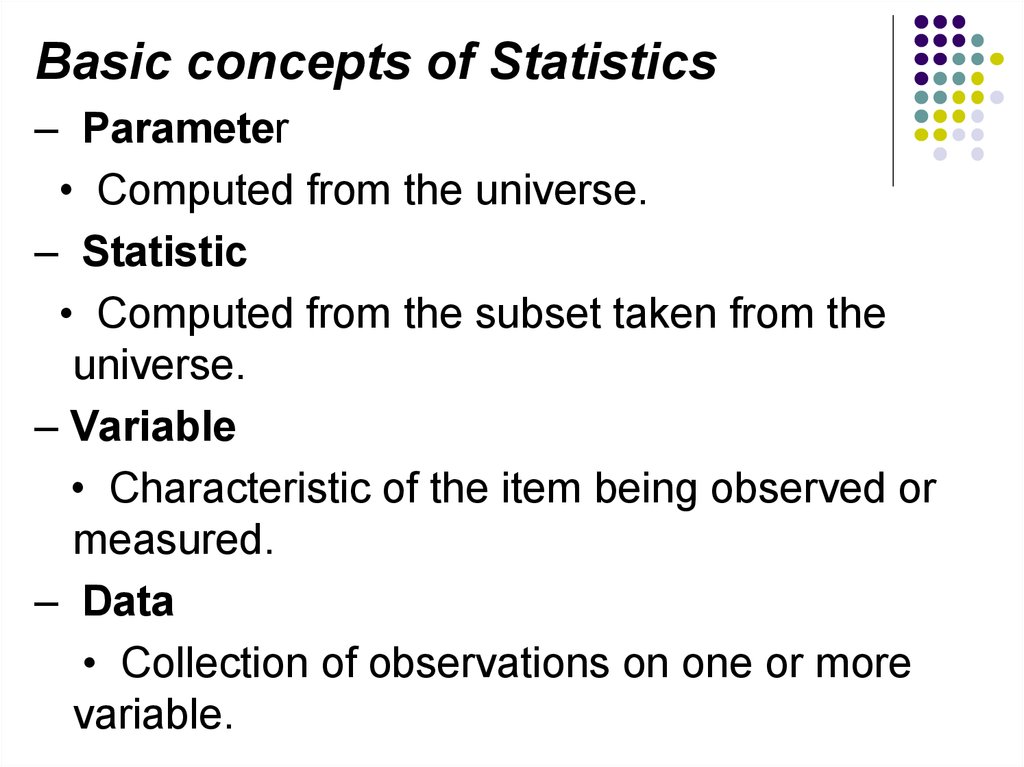
Basic concepts of Statistics– Parameter
• Computed from the universe.
– Statistic
• Computed from the subset taken from the
universe.
– Variable
• Characteristic of the item being observed or
measured.
– Data
• Collection of observations on one or more
variable.
57.
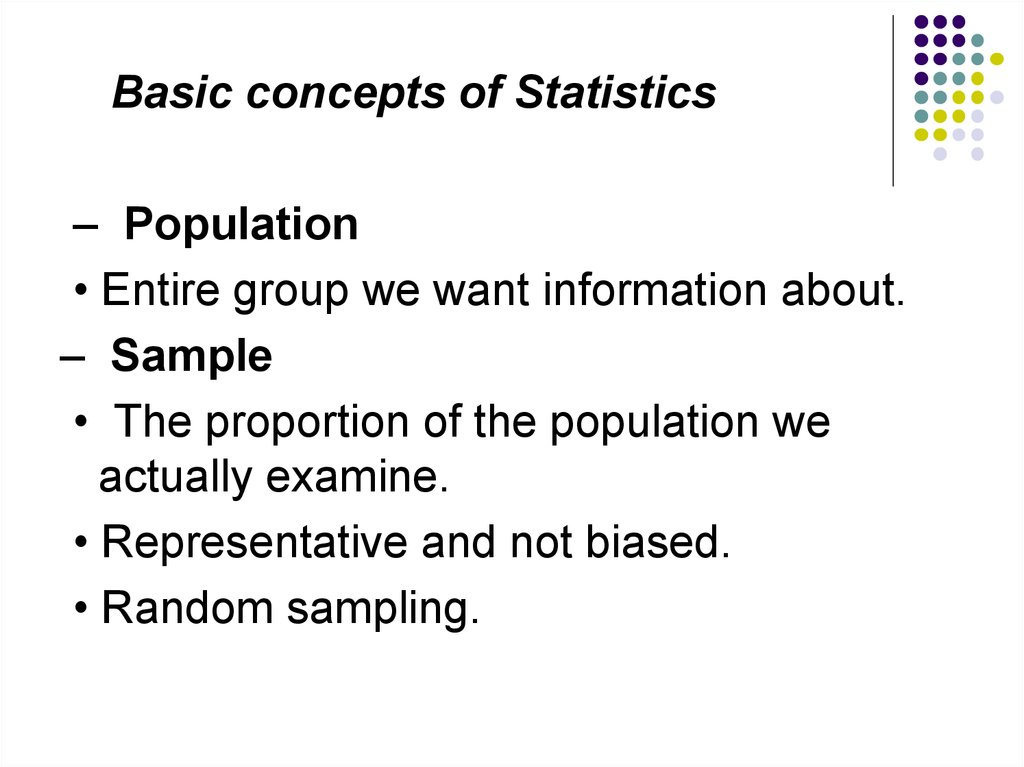
Basic concepts of Statistics– Population
• Entire group we want information about.
– Sample
• The proportion of the population we
actually examine.
• Representative and not biased.
• Random sampling.
58.
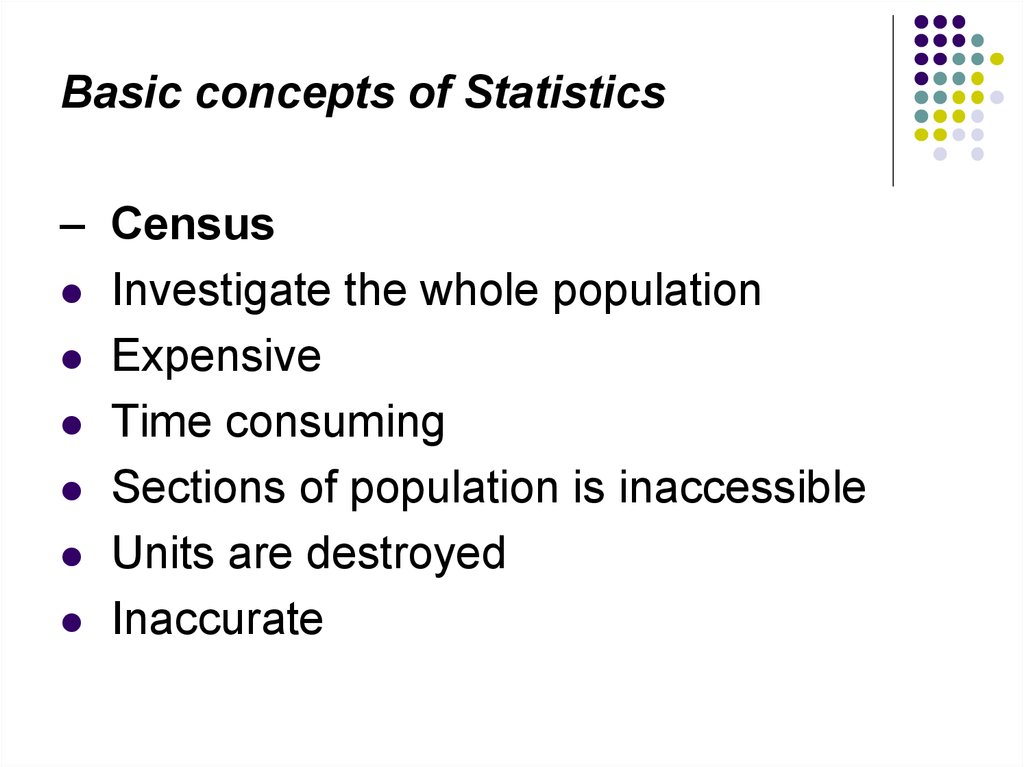
Basic concepts of Statistics– Census
Investigate the whole population
Expensive
Time consuming
Sections of population is inaccessible
Units are destroyed
Inaccurate
59.
60. Key Definitions
What is Data?facts or information that is relevant or appropriate
to a decision maker
A population is the collection of all items of
interest or under investigation
N represents the population size
A sample is an observed subset of the population
n represents the sample size
Statistics for Business and
Economics, 6e © 2007 Pearson
Education, Inc.
Chap 1-60
61. Key Definitions
Aparameter is a specific
characteristic of a population
A
statistic is a specific
characteristic of a sample
62. Population vs. Sample
Populationa b
Sample
cd
b
ef gh i jk l m n
gi
o p q rs t u v w
x y
Economics, 6e © 2007 Pearson
Education, Inc.
o
z
Values calculated using
population data are called
parameters
Statistics for Business and
c
n
r
u
y
Chap 1-62
Values computed from
sample data are called
statistics
63. Examples of Populations
Names of all registered voters in the UnitedStates
Incomes of all families living in Belarus
Annual returns of all stocks traded on the
New York Stock Exchange
Grade point averages of all the students in
your university
Statistics for Business and
Economics, 6e © 2007 Pearson
Education, Inc.
Chap 1-63
64. Random Sampling
Simple random sampling is a procedure inwhich
each member of the population is chosen strictly by
chance,
each member of the population is equally likely to be
chosen,
and
every possible sample of n objects is equally likely to
be chosen
The resulting sample is called a random
sample
Statistics for Business and
Economics, 6e © 2007 Pearson
Education, Inc.
Chap 1-64
65. Variables
Traits or characteristics that can change valuesfrom case to case.
A variable is what is measured or manipulated in
an experiment
•Examples:
•Age
•Gender
•Income
•Social class
66. Types Of Variables
In causal relationships:CAUSE =>EFFECT
independent variable & dependent variable
•Independent variable: is a variable that can be
controlled or manipulated.
An independent variable is the variable you have
control over (dose of drug)
•Dependent variable: is a variable that cannot
be controlled or manipulated. Its values are
predicted from the independent variable (
effect on the condition)
67. Types Of Variables
•Discrete variables are measured in unitsthat cannot be subdivided. Example:
Number of children
•Continuous variables are measured in a
unit that can be subdivided infinitely.
Example: Height
68. Descriptive and Inferential Statistics
Two branches of statistics:Descriptive statistics
Collecting, summarizing, and processing data to
transform data into information
Inferential statistics
provide the bases for predictions, forecasts, and
estimates that are used to transform information
into knowledge
Statistics for Business and
Economics, 6e © 2007 Pearson
Education, Inc.
Chap 1-68
69. Descriptive Statistics
Collect datae.g., Survey
Gives us the overall picture about data
•Presents data in the form of tables, charts
and graphs
70. Descriptive Statistics
Summarize datae.g., Sample mean =
•Avoids inferences
X
i
n
Examples:
•Measures of central location
Mean, median, mode and midrange
•Measures of Variation
•Variance, Standard Deviation, z-scores
71. Inferential Statistics
•Take decision on overall population using asample
“Sampled” data are incomplete but can still
be representative of the population
•Permits the making of generalizations
(inferences) about the data
Probability theory is a major tool used to
analyze sampled data
72. Inferential Statistics
Estimatione.g., Estimate the population
mean weight using the sample
mean weight
Hypothesis testing
e.g., Test the claim that the
population mean weight is 120
pounds
Inference is the process of drawing conclusions or making decisions
about a population based on sample results
Statistics for Business and
Economics, 6e © 2007 Pearson
Education, Inc.
Chap 1-72
73. Predictive Modeling
The science of predicting future outcomesbased on historical events.
Model Building: “Developing set of
equations or mathematical formulation to
forecast future behaviors based on current
or historical data.”
Regression, logistic Regression, time
series analysis etc.
74. The Decision Making Process
DecisionKnowledge
Experience, Theory,
Literature, Inferential
Statistics, Computers
Information
Descriptive Statistics,
Probability, Computers
Begin Here:
Identify the
Problem
Statistics for Business and
Economics, 6e © 2007 Pearson
Education, Inc.
Data
Chap 1-74
75. Why We Need Data
To provide input to surveyTo provide input to study
To measure performance of service or
production process
To evaluate conformance to standards
To assist in formulating alternative courses
of action
To satisfy curiosity
Statistics for Managers Using
Microsoft Excel, 4e © 2004
Prentice-Hall, Inc.
Chap 1-75
76. Data Sources
PrimarySecondary
Data Collection
Data Compilation
Print or Electronic
Observation
Survey
Experimentation
Statistics for Managers Using
Microsoft Excel, 4e © 2004
Prentice-Hall, Inc.
Chap 1-76
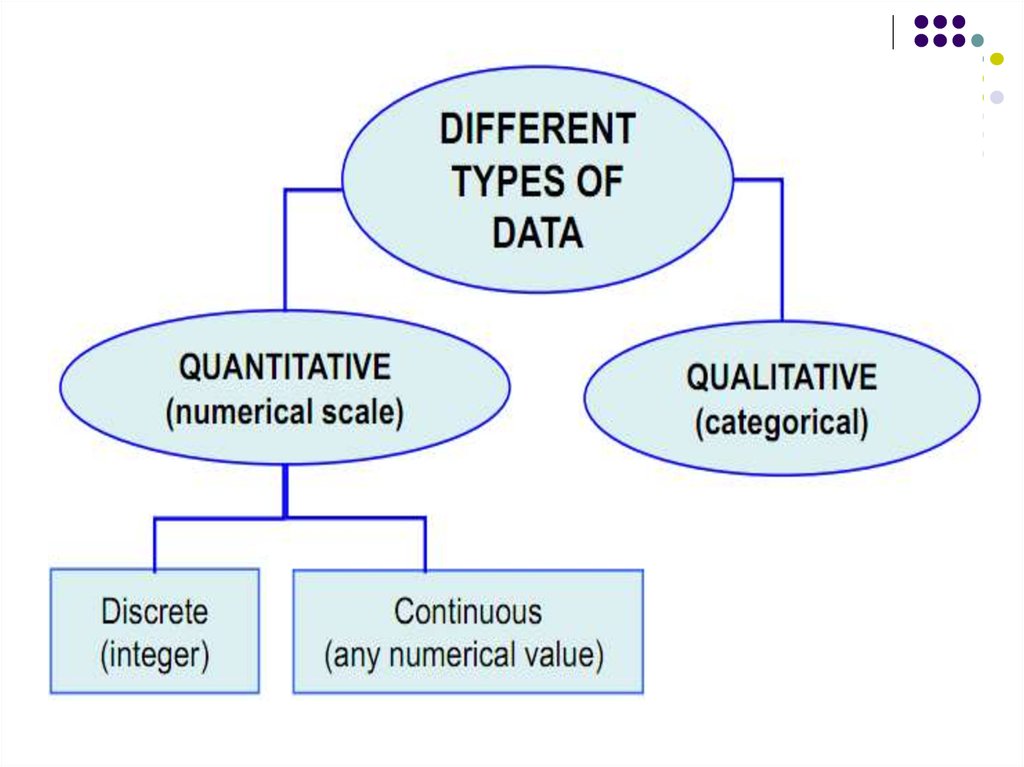
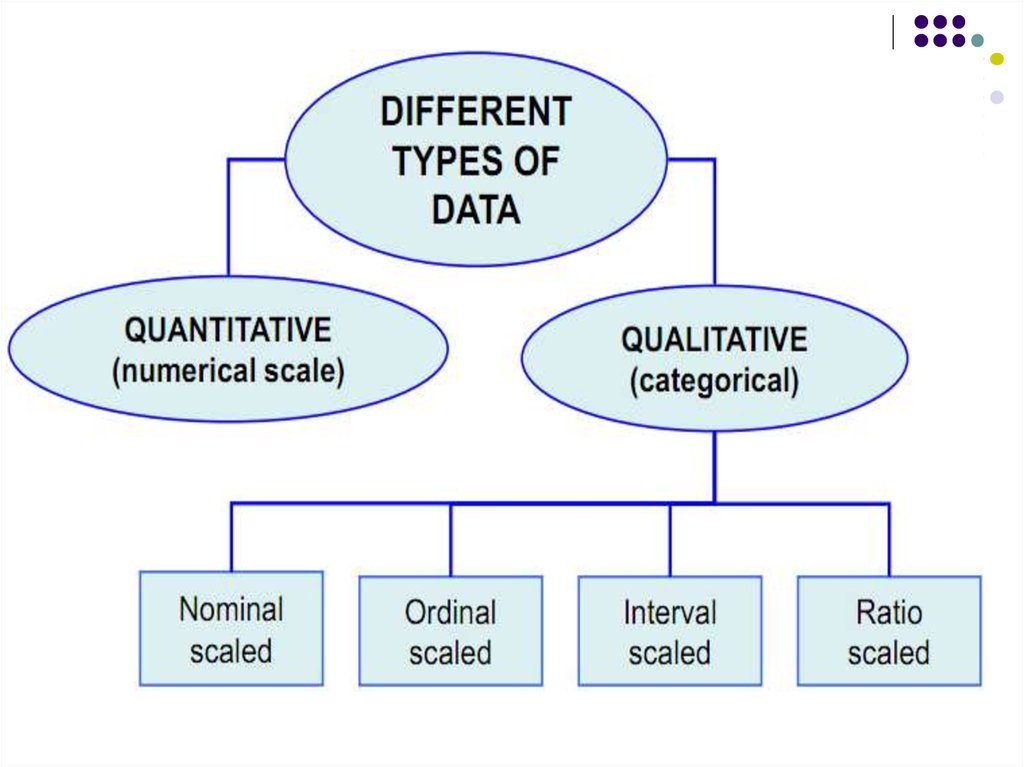
77. Types of Data
DataCategorical
Numerical
Examples:
Marital Status
Political Party
Eye Color
(Defined categories)
Discrete
Examples:
Number of Children
Defects per hour
(Counted items)
Chap 1-77
Continuous
Examples:
Weight
Voltage
(Measured characteristics)
78.
79.
80.
Problems associated with the collectionof data:
– Characteristics have to be measured.
– Measurements can be complicated.
– Measurements must be valid and
accurate.
– Secondary data not easy to validate.
– Data can be incomplete, typographical
errors, small sample.
– Biased or misleading responses.
81.
Problems associated with the collectionof data:
– Make sure of the following:
• Who conducted the study?
• What data was collected?
• What sampling method was used?
• Sample size?
• Chance of bias?
• Is data relevant to the problem at hand?
82.
How to design a questionnaire– Questions should:
• Be simply stated.
• Have no suggestion of a specific answer.
• Be specific and address only one issue.
• Carefully word sensitive issues.
• Not require calculations or a study to be
answered.
– Types of questions:
• Closed
• Open
• Combined
83.
Appearance and layout of a questionnaire– Attractive look.
– Coloured paper.
– Clear instructions on how to complete.
– Reasonably short.
– Enough space to complete questions.
– Mother-tongue language.
– Interesting questions first.
– Simple questions first, controversial questions
later.
– Complete one topic before starting the next.
– Important information first.
84.
Interview– Fieldworker completed questionnaire
• Higher response rate and data collection is
immediate.
– Mailed questionnaires
• When population is large or dispersed.
• Low response rate.
• Time consuming.
– Telephone interview
• Lower costs.
• Quicker contact with geographically dispersed
respondents.
85.
Editing the data– Obvious errors should be eliminated.
– Eliminate questionnaires that are
incomplete and unreliable.
– Questionnaires should be pre-tested
on a small group of people.
86.
87. Levels of Measurement and Measurement Scales
Differences betweenmeasurements, true
zero exists
Ratio Data
Differences between
measurements but no
true zero
Interval Data
Ordered Categories
(rankings, order, or
scaling)
Ordinal Data
Categories (no
ordering or direction)
Nominal Data
Highest Level
Strongest forms of
measurement
Higher Level
Lowest Level
Weakest form of
measurement
88. Evaluating Survey Worthiness
What is the purpose of the survey?Is the survey based on a probability sample?
Coverage error – appropriate frame?
Non-response error – follow up
Measurement error – good questions elicit
good responses
Sampling error – always exists
Statistics for Managers Using
Microsoft Excel, 4e © 2004
Prentice-Hall, Inc.
Chap 1-88
89. Types of Survey Errors
Coverage error or selection biasNon response error or bias
People who do not respond may be different from those who
do respond
Sampling error
Exists if some groups are excluded from the frame and have
no chance of being selected
Variation from sample to sample will always exist
Measurement error
Due to weaknesses in question design, respondent error, and
interviewer’s effects on the respondent
Chap 1-89
90. Types of Survey Errors
(continued)Excluded from
frame
Coverage error
Non response error
Follow up on
nonresponses
Random differences
from sample to sample
Sampling error
Measurement error
Chap 1-90
Bad or leading question
91. What do we expect from the statistical analysis?
To find out whether there is a statisticallysignificant difference between our sample
and general population