


")


 Медицина
Похожие презентации:


Электрокардиография – ЭКГ Electrocardiography - ECG
1. Электрокардиография – ЭКГ Electrocardiography - ECG
Normal ECG2. Электрокардиогра́фия definition
- a technique for recording and studying theelectric fields generated during the work
of the heart.
3. Hystory
В 1901 году Виллем Эйнтховен,работавший в Лейдене (Нидерланды),
использовал струнный гальванометр:
первый практический ЭКГ-аппарат.
1906 г. Эйнтховен издает первое в мире
руководство по электрокардиографии.
В 1924 году Эйнтховен был удостоен
Нобелевской премии по медицине за
новаторскую работу по разработке ЭКГаппарата
Awarded the Nobel Prize
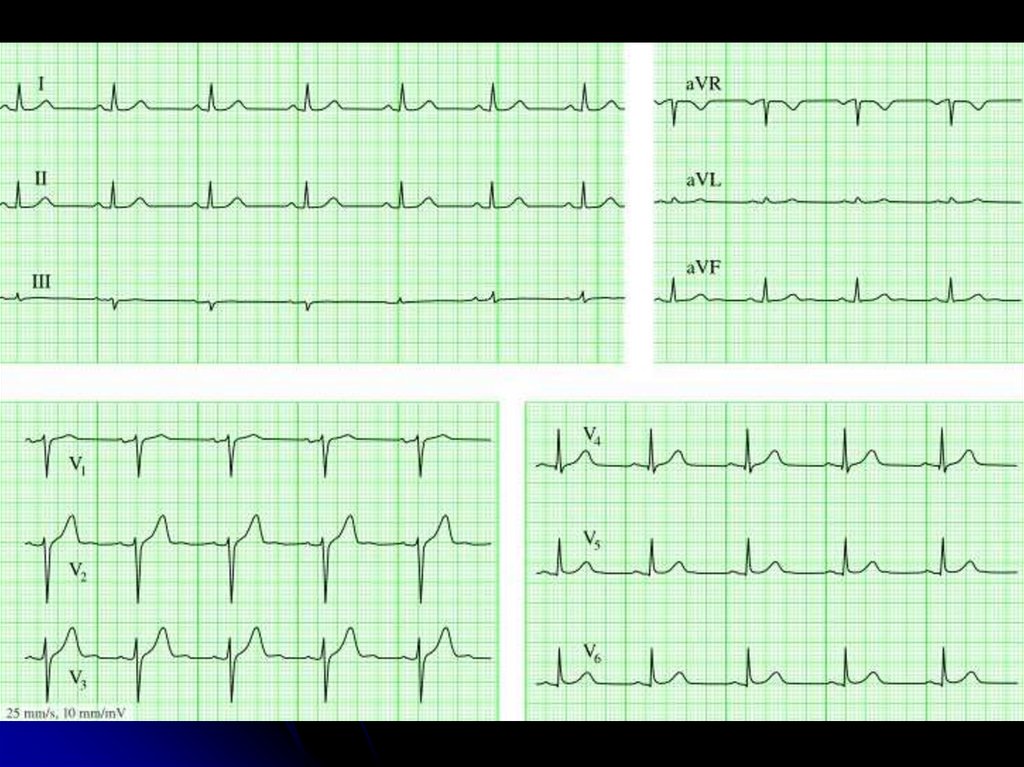
4. Leads ECG
IaVR
aVL
II
III
V1
V6
V2
V3
aVF
V4 V5
5. Waves of ECG
QRS1 mV =10 мм
1 мм = 0,1 mV
R
T
Р
q s
R
Q
QS
QR
rS
rsR'
6. Intervals and segments
segment PQinterval PQ (PR)
Сегмент ST
Сегмент ТР
Интервал QT
7.
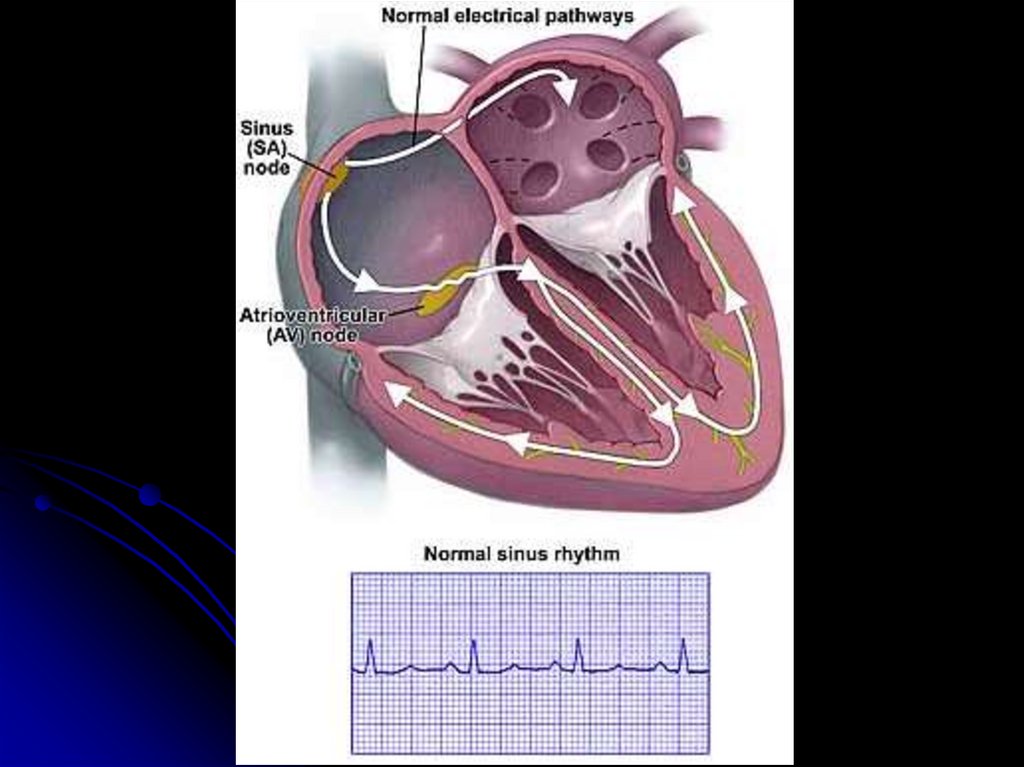
8. ECG description outline 1. Heart rate / cердечный ритм
Sinus rhythm criteria :- P (+) II
- behind each P QRS
- constant form of P
- PQ > 120 мс
II
9. 2. Frequency and regularity of rhythm
25 мм/с – 1 мм – 0,04 sec50 мм/с – 1 мм – 0,02 сек
60/(R-R)c (bradycardia <60 (55) bpm,
tachycardia> 90 (80*) bpm)
ΔRR < 10% (>10% - sinus arrhythmia)
R-R 20 мм
Частота ритма=60/(20*0,04)=75
10. 3. p wave (зубец)
The shape, duration (<100 ms) andamplitude (<2.5 mm) of the p wave in leads
II, V1 are analyzed to detect an increase in
the left and right atria
LA hypertrophy
I II aVL V5 V6
RA hypertrophy
II III aVF
V1
p >100 ms
duration
P > 2,5 mm
amplitude
11. 4. Interval PQ
N 120-200 мс>200 ms – AV block
12. 5. QRS
5.1. QRS duration <100 msIf the sinus QRS width is more than 100
ms , then a blockade of the His bundle
branch (HBBB) is diagnosed: incomplete
(100-120 ms) or complete (≥120 ms)
3 reasons of QRS widerning: HBBB,
ventricular origin, WPW syndrom
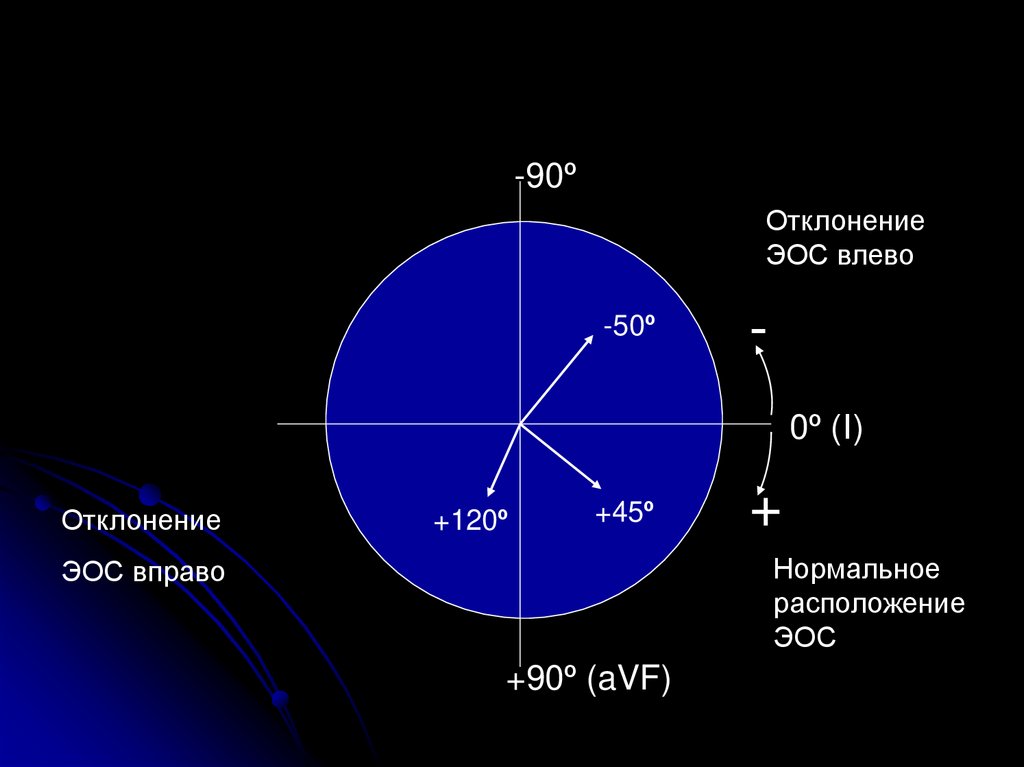
13. 5.2. Determination of the electrical axis of the heart
IаVR
+
aVL
N axis 0-90o
RII > RI > RIII
III
II
+
+
aVF
14. Deviation of the axis to the left
IаVR
+
aVL
RI>RII>RIII
III
II
+
+
aVF
15. Deviation to the right
IаVR
RIII>RII>RIII
+
aVL
III
II
+
+
aVF
16.
-90ºОтклонение
ЭОС влево
-50º
0º (I)
Отклонение
+120º
+45º
+
Нормальное
расположение
ЭОС
ЭОС вправо
+90º (aVF)
17. 5.3. Q wave– along or preceding negative wave in QRS
A normal q wave is recorded in V4-V6,- in I and aVL with horizontal EAH,
- in II, III, aVF with vertical EAH.
Pathological q wave (sign of necrosis):
> 30 ms width
> 2 mV (20 mm) or > 25% R
(> 15% R V4-V6)
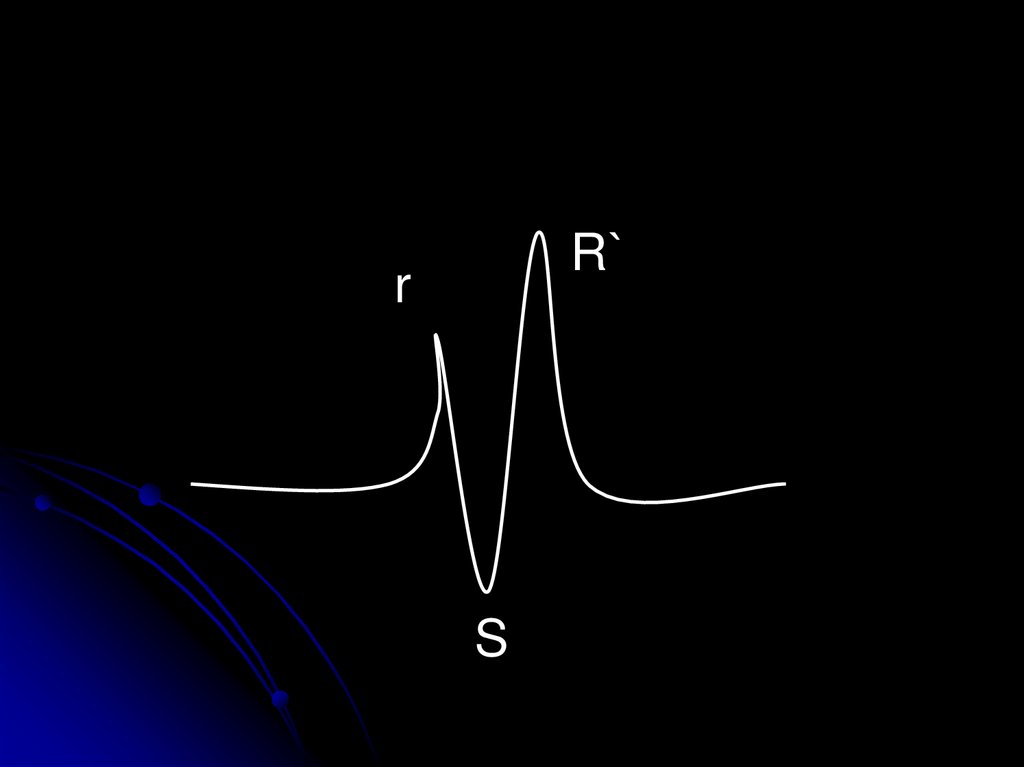
18. 5.4. R and S waves
All positive waves of QRS complex are R wavesThe R wave should grow from V1 to V4
V1
V2
V3
Переходная зона
V4
S -subsequent negative wave of QRS complex
S should decrease from V1 to V4
19.
R`r
S
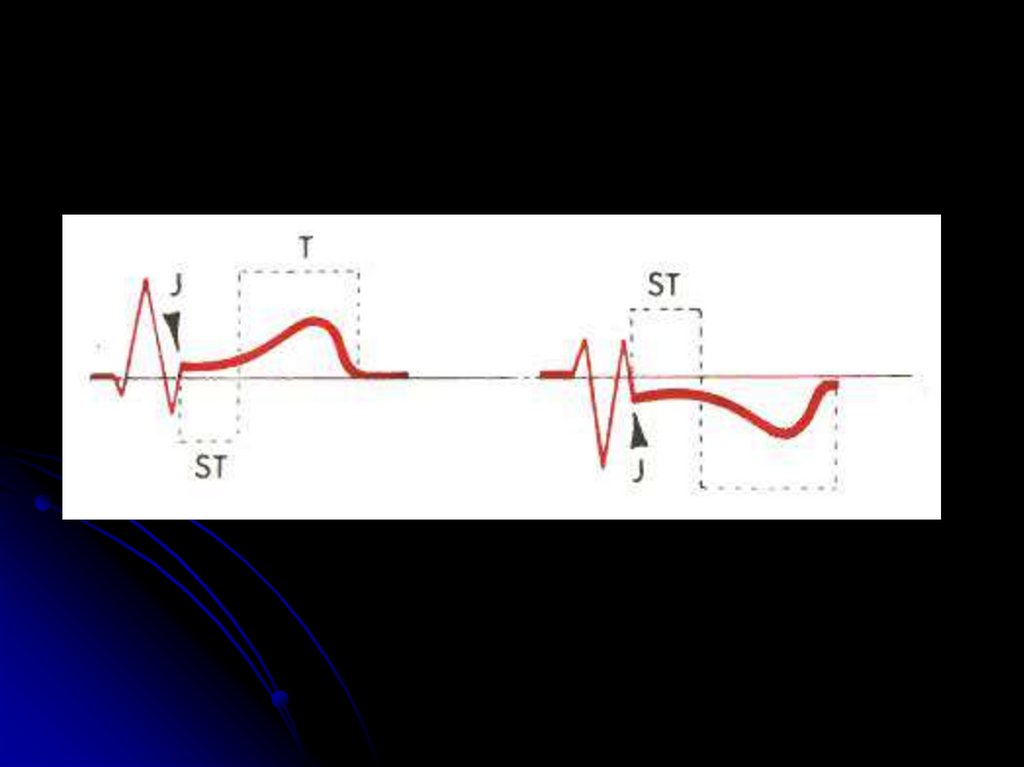
20. 6. ST segment
The ST segment must beon the isoline (a deviation
of 0.5 mm is permissible)
The elevation of the ST
segment is estimated in
40 ms from point j
ST segment depression
is assessed in 60-80 ms
from point j
In V1-V3, it is normal for
ST elevation up to 2.5
mm with a bulge
downward
N
ischemic
21. J -point
Point j is the place of the visible end of the QRScomplex!
J-точка
22.
23. 7. Т wave
Analysis of the shape and amplitude of theT wave in all leads
The most informative, when analyzing
dynamics
Ischemic T
Ишемический Т
24. 8. QT interval
N 450 msQT has a significant direct dependence on the
duration of the RR interval (or inversely from the
heart rate)
QTc - corrected QT
Bazett's formula QTc = QT: √RR
Causes of lengthening: Long QT syndrome,
medication (amiodarone, antibiotics,
antihistamines)