


")


")


 Various phases can be seen through ECG wave tracings following a heart attack:")


 :")


 makes the pretest probability of obstructive CAD so high that the test result does not")


")


 Медицина
Похожие презентации:


Myocardial Infarction
1. Myocardial Infarction
Lecture by associate professorY.P.Smuglov
2. The interior of the heart is composed of valves, chambers, and associated vessels.
Definition :A heart attack
(myocardial infarction)
occurs when an area of
heart muscle dies or is
permanently damaged
because of an inadequate
supply of oxygen to that
area.
3.
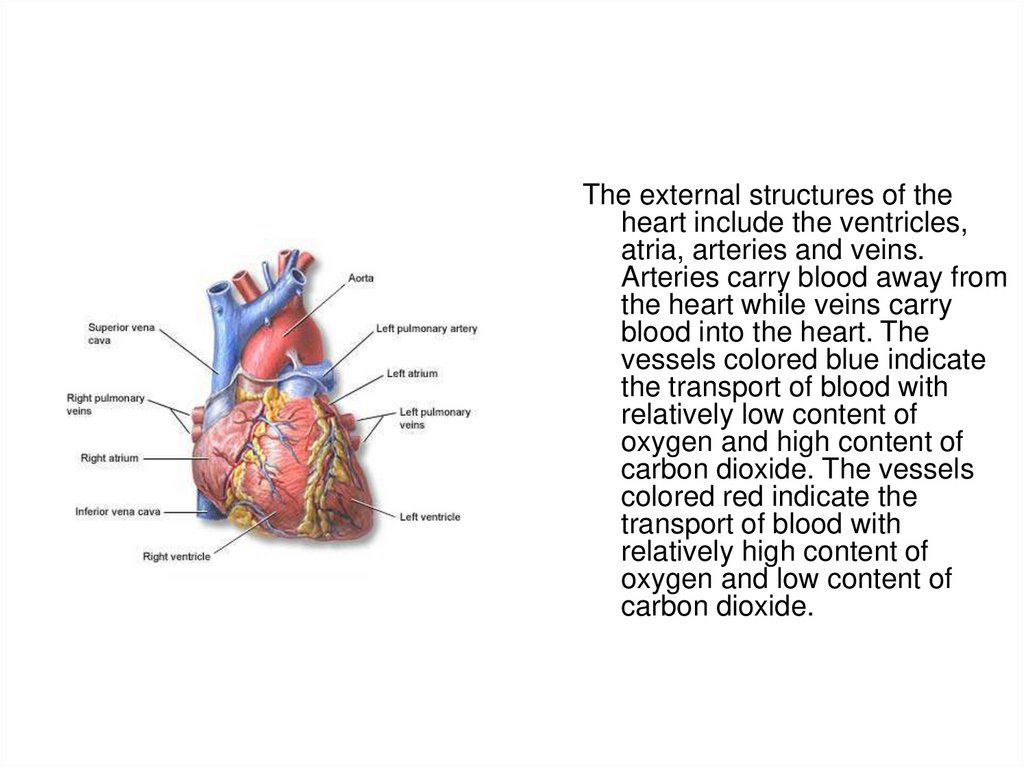
The external structures of theheart include the ventricles,
atria, arteries and veins.
Arteries carry blood away from
the heart while veins carry
blood into the heart. The
vessels colored blue indicate
the transport of blood with
relatively low content of
oxygen and high content of
carbon dioxide. The vessels
colored red indicate the
transport of blood with
relatively high content of
oxygen and low content of
carbon dioxide.
4. DEFINITION
• Myocardial infarction (MI) – ischaemic necrosisis almost always due to the formation of
occlusive thrombus at the site of rupture or
erosion of an atheromatous plaque in a coronary
artery.
• More rarely, MI may result from prolonged vasospasm, inadequate myocardial blood flow or
excessive metabolic demand.
• Very rarely, MI may be caused by embolic occlusion, vasculitis, aortic root or coronary artery
dissection or aortitis.
5.
6.
7.
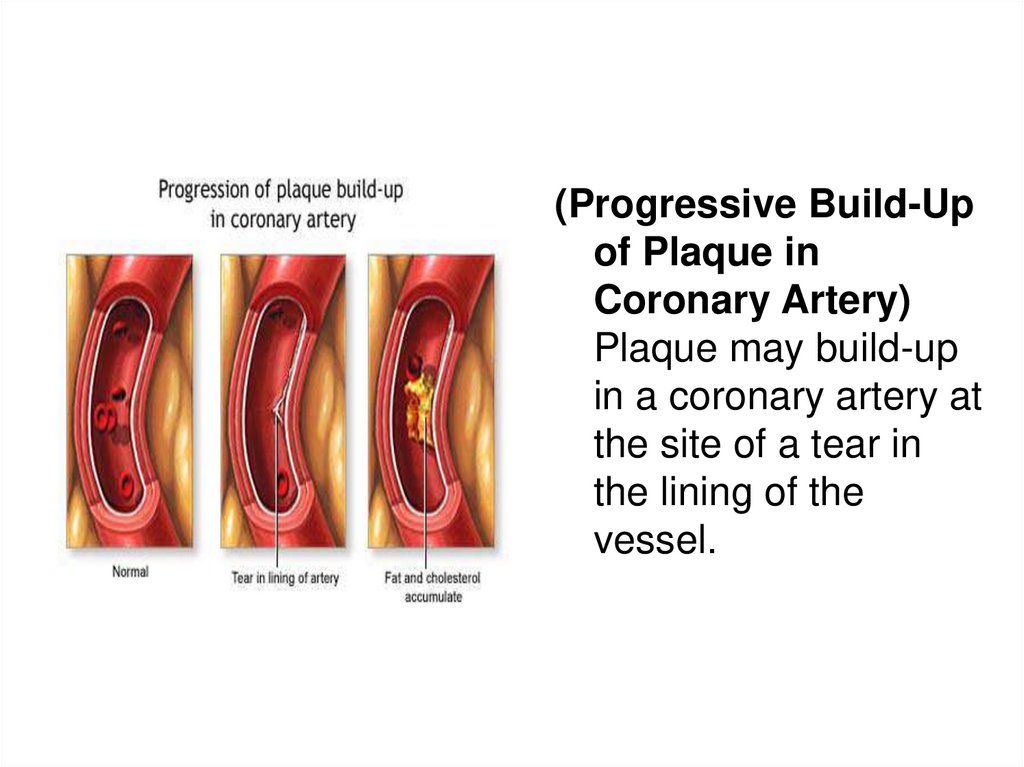
(Progressive Build-Upof Plaque in
Coronary Artery)
Plaque may build-up
in a coronary artery at
the site of a tear in
the lining of the
vessel.
8. Posterior Heart Arteries
The coronary arteriessupply blood to the
heart muscle. The
right coronary artery
supplies both the left
and the right heart;
the left coronary
artery supplies the left
heart.
9. Anterior Heart Arteries
The coronary arteriessupply blood to the
heart muscle. The
right coronary artery
supplies both the left
and the right heart;
the left coronary
artery supplies the left
heart.
10. INTERNATIONAL CLASSIFICATION OF DEASESES – 10
ACUTE MI - WITH PATHOLOGICAL Q-WAVE
ACUTE MI – WITHOUT PATHOLOGICAL Q-WAVE
ACUTE MI SUBENDOCARDIAL
ACUTE UNCERTAIN MI
RELAPSING MI (FROM 3 to 28 DAYS )
REPETATIVE MI ( AFTER 28 DAYS )
ACUTE CORONARY FAILURE – acute
ischaemia before development of attributes of
myocardial necrosis or sudden coronary death.
11. Classification of MI
• TYPE 1 – Acute coronary syndrom:primary coronaryevent- plaque rupture, erosion, ulceration, coronary dissection
• TYPE 2 – Infarction secondary to oxygen supply and
demand imbalance- spasm,endothelial dysfunction,left ventricule
hypertrophy,anemia,hypoxemia,arrhythmia,hypotension,cocaine
• TYPE 3 – Cardiac arrest/ Sudden death- No biomarcer
assays
• TYPE 4a - Infarction secondary to PCI
• TYPE 4b - Infarction secondary to stent thrombosis
• TYPE 5 - Infarction secondary to CABG
12. Heart Attack Symptoms Symptoms of a possible heart attack include chest pain and pain that radiates down the shoulder and arm.
13. Causes, & Risk Factors
Causes, & Risk Factors• Most heart attacks are caused by a clot that blocks one
of the coronary arteries (the blood vessels that bring
blood and oxygen to the heart muscle). The clot usually
forms in a coronary artery that has been previously
narrowed from changes related to atherosclerosis. The
atherosclerotic plaque (buildup) inside the arterial wall
sometimes cracks, and this triggers the formation of a
clot, also called a thrombus.
A clot in the coronary artery interrupts the flow of blood
and oxygen to the heart muscle, leading to the death of
heart cells in that area. The damaged heart muscle loses
its ability to contract, and the remaining heart muscle
needs to compensate for that weakened area.
Occasionally, sudden overwhelming stress can trigger a
heart attack.
14. RISK FACTORS
• Nonmodifable :• Age (> 45 )
• Male gender
• Family history
(genetic
predisposition)
• Aethnic origin
• Modifable :
Dyslipidaemia
Arterial hypertension
Smoking
Diabetes mellitus
Obesity
Fatty food diet
Physical inactivity
Stress
Hypoestrogenemia in
female
15. Heart Attack Symptoms & Signs :
Heart Attack Symptoms & Signs :Chest pain behind the sternum (breastbone) is a major
symptom of heart attack, but in many cases the pain
may be subtle or even completely absent (called a "silent
heart attack"), especially in the elderly and diabetics.
Often, the pain radiates from the chest to the arms or
shoulder; neck, teeth, or jaw; abdomen or back.
Sometimes, the pain is only felt in one these other
locations.
The pain typically lasts longer than 20 minutes and is
generally not fully relieved by rest or nitrioglycerine, both
of which can clear pain from angina.
16.
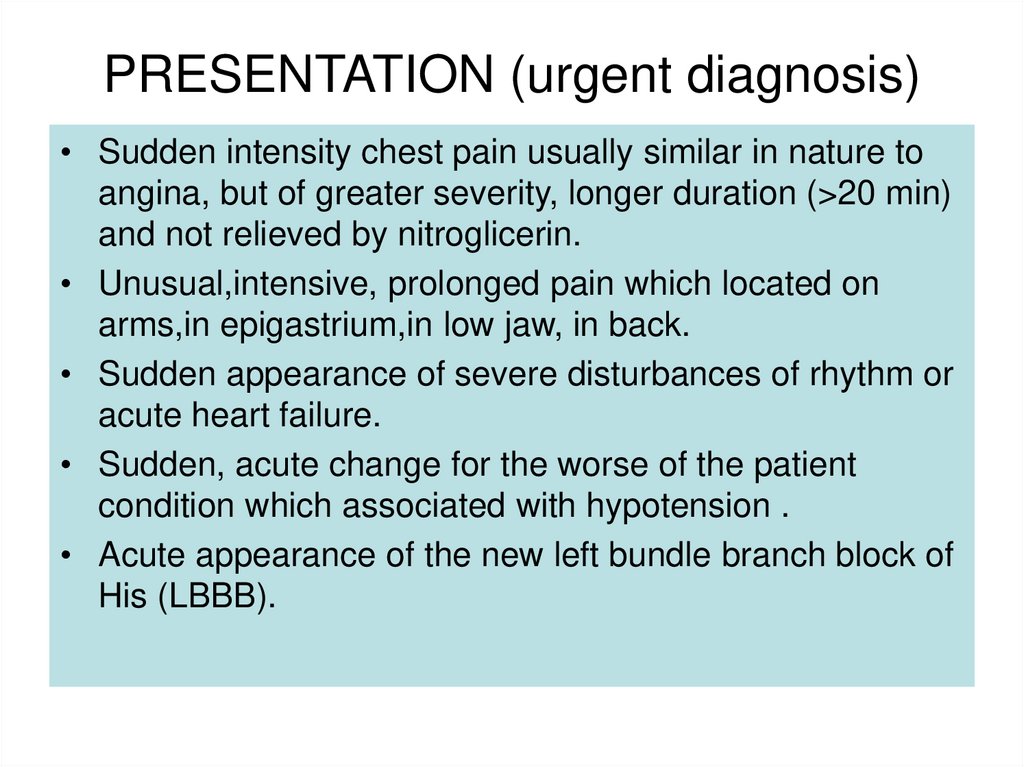
PRESENTATION (urgent diagnosis)• Sudden intensity chest pain usually similar in nature to
angina, but of greater severity, longer duration (>20 min)
and not relieved by nitroglicerin.
• Unusual,intensive, prolonged pain which located on
arms,in epigastrium,in low jaw, in back.
• Sudden appearance of severe disturbances of rhythm or
acute heart failure.
• Sudden, acute change for the worse of the patient
condition which associated with hypotension .
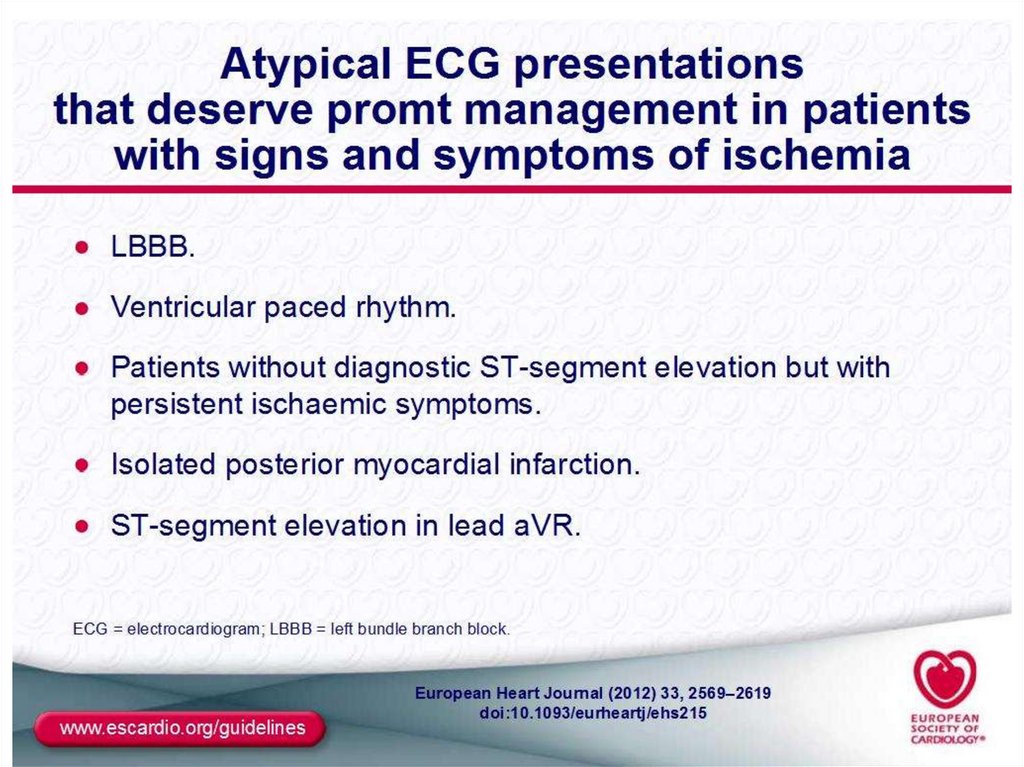
• Acute appearance of the new left bundle branch block of
His (LBBB).
17. HEART ATTACK SYMPTOMS
The pain can be intense and severe or quite subtle andconfusing. It can feel like:
squeezing or heavy pressure
a tight band on the chest
"an elephant sitting on the chest"
bad indigestion
• Other symptoms you may have either alone or along
with chest pain include:
Shortness of breath
Cough
Lightheadedness - dizziness
Fainting
Nausea or vomiting
Sweating, which may be profuse
Feeling of "impending doom"
Anxiety
18. Variants of AMI clinical course
• Anginous – typical (70-90%);• Asthmatic – cardiac asthma and pulmonary
oedema-like type (10 %);
• Abdominal – stomach-ache, dyspepsia;
• Arrhythmic – sudden development of impaired
rhythm and conductibility;
• Cerebrovascular – fainting, loss of consciousness,
acute impairment of cerebral blood flow;
• AMI with atypical pain syndrome – pain in the
jaw, back, arm, the right side of chest;
• Painless AMI – diagnosed by ECG.
19. Clinical course of MI
• Latent period till 28 days (in which presenting featuresincludes signs of unstable angina pectoris)
• Superacute period from 30 min till 2 hours (time
from appearance of acute ischaemia till first signs of myocardial
necrosis)
• Acute period till 10 to 14 days (occur after 2-3 hours
and prolonged till final formation of focal necrosis and complicated
by resorbtion of necrosis products with increases cardiospeciphic
enzymes)
• Subacute period till 4-8 weeks (time from limitation of
focal necrosis till substitution of primary connective tissue)
• Postmyocardial infarction period from 3-6
monthes (final formation of scar and named by
Сardiosclerosis).
20. Criterias of diagnosis
• Typical clinical signs (combination ofhistory)
• Typical ECG changes (Q-wave, STsegment, T-wave)
• Biochemical markers of cardiac injury
(myoglobin,CK,CK-MB,troponins T and I )
21. DIAGNOSIS OF MI
• The diagnosis is based on thoroughanalysis of clinical manifestations, ECG,
and necrosis marker levels;
• ECG should be taken within the first 10
minutes since a physician sees a patient
and is repeated 6 and 24 hours later;
• The level of troponins T and I should be
determined within 60 minutes since
admission to hospital and is repeated 6 and
12 hours later in case of negative test
results;
22. Heart Attack Diagnosis & Tests :
Heart Attack Diagnosis & Tests :During a physical examination, the doctor will usually note a
rapid pulse. Blood pressure may be normal, high, or low. While
listening to the chest with a stethoscope, the doctor may hear
crackles in the lungs, a heart murmur, or other abnormal
sounds.
The following tests may reveal a heart attack and the extent of
heart damage:
Electrocardiogram(ECG) -- single or repeated over several hours
Echocardiography
Coronary angiography
Nuclear ventriculography (MUGA or RNV)
• The following tests may show the by-products of heart damage and
factors indicating you have a high risk for heart attack:
• Troponin I and troponin T
• CK and CK-MB
• Serum myoglobin
23. The ECG in acute myocardial infarction (MI)
Acute MI may cause changes in the QRS complex, ST segment or theT wave. However, the only definitive diagnostic changes of
myocardial infarction are changes in the QRS complex.
The QRS complex in infarction
Two types of QRS abnormalities may indicate infarction:
1) Inappropriately low R wave voltage in a local area and
2) Abnormal Q waves
The above two abnormalities are actually part of the same process i.e. the development of a negative Q wave and the reduction in size
of the positive wave.
The loss of positivity is the result of myocardial necrosis beneath the
exploring electrode. The size of the positive wave in each precordial
lead is related to the thickness of viable myocardium underneath
that electrode.
24. The ECG and Myocardial Infarction
• During an MI, theECG goes through a
series of
abnormalities. The
initial abnormality is
called a hyperacute
T wave. This is a T
wave that is taller and
more pointed than the
normal T wave.
25. The ECG and Myocardial Infarction
The abnormality lasts for a very short time, and thenelevation of the ST segment occurs. This is the hallmark
abnormality of an acute MI. It occurs when the heart
muscle is being injured by a lack of blood flow and
oxygen and is also called a current of injury.
26.
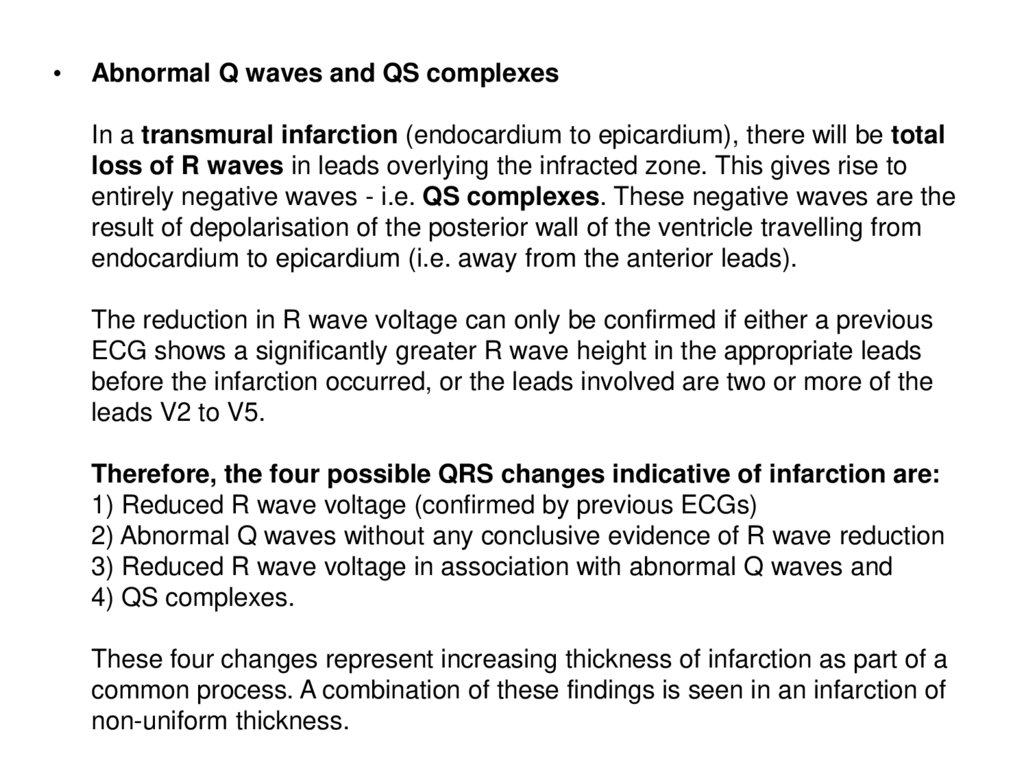
Abnormal Q waves and QS complexes
In a transmural infarction (endocardium to epicardium), there will be total
loss of R waves in leads overlying the infracted zone. This gives rise to
entirely negative waves - i.e. QS complexes. These negative waves are the
result of depolarisation of the posterior wall of the ventricle travelling from
endocardium to epicardium (i.e. away from the anterior leads).
The reduction in R wave voltage can only be confirmed if either a previous
ECG shows a significantly greater R wave height in the appropriate leads
before the infarction occurred, or the leads involved are two or more of the
leads V2 to V5.
Therefore, the four possible QRS changes indicative of infarction are:
1) Reduced R wave voltage (confirmed by previous ECGs)
2) Abnormal Q waves without any conclusive evidence of R wave reduction
3) Reduced R wave voltage in association with abnormal Q waves and
4) QS complexes.
These four changes represent increasing thickness of infarction as part of a
common process. A combination of these findings is seen in an infarction of
non-uniform thickness.
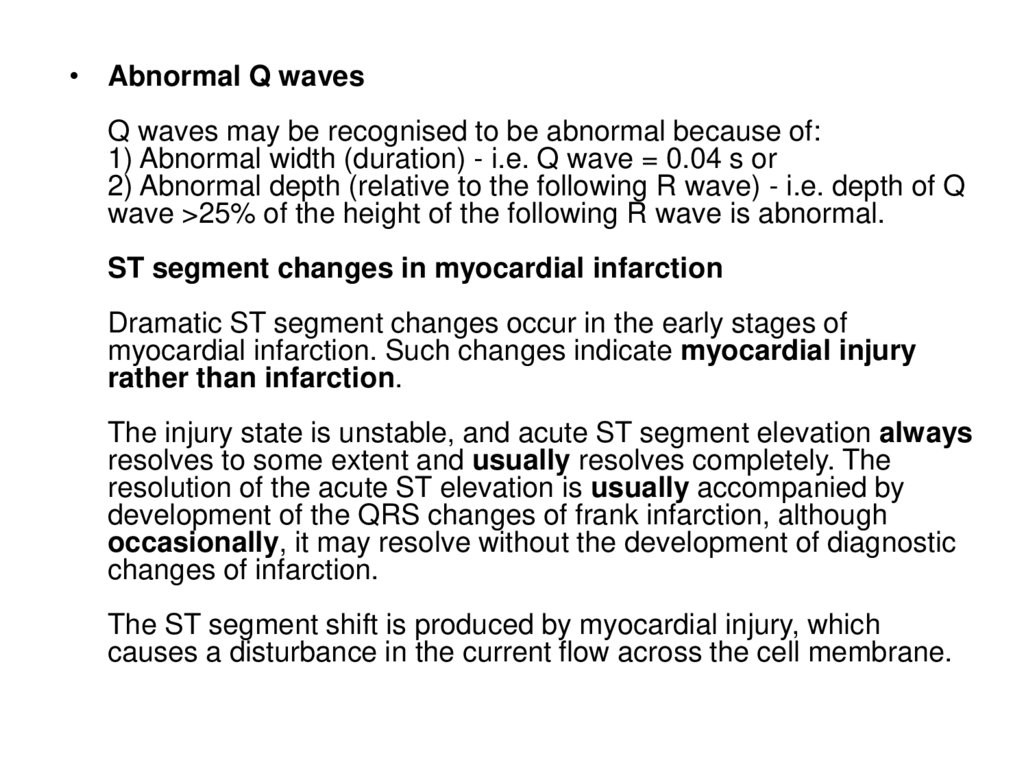
27.
• Abnormal Q wavesQ waves may be recognised to be abnormal because of:
1) Abnormal width (duration) - i.e. Q wave = 0.04 s or
2) Abnormal depth (relative to the following R wave) - i.e. depth of Q
wave >25% of the height of the following R wave is abnormal.
ST segment changes in myocardial infarction
Dramatic ST segment changes occur in the early stages of
myocardial infarction. Such changes indicate myocardial injury
rather than infarction.
The injury state is unstable, and acute ST segment elevation always
resolves to some extent and usually resolves completely. The
resolution of the acute ST elevation is usually accompanied by
development of the QRS changes of frank infarction, although
occasionally, it may resolve without the development of diagnostic
changes of infarction.
The ST segment shift is produced by myocardial injury, which
causes a disturbance in the current flow across the cell membrane.
28.
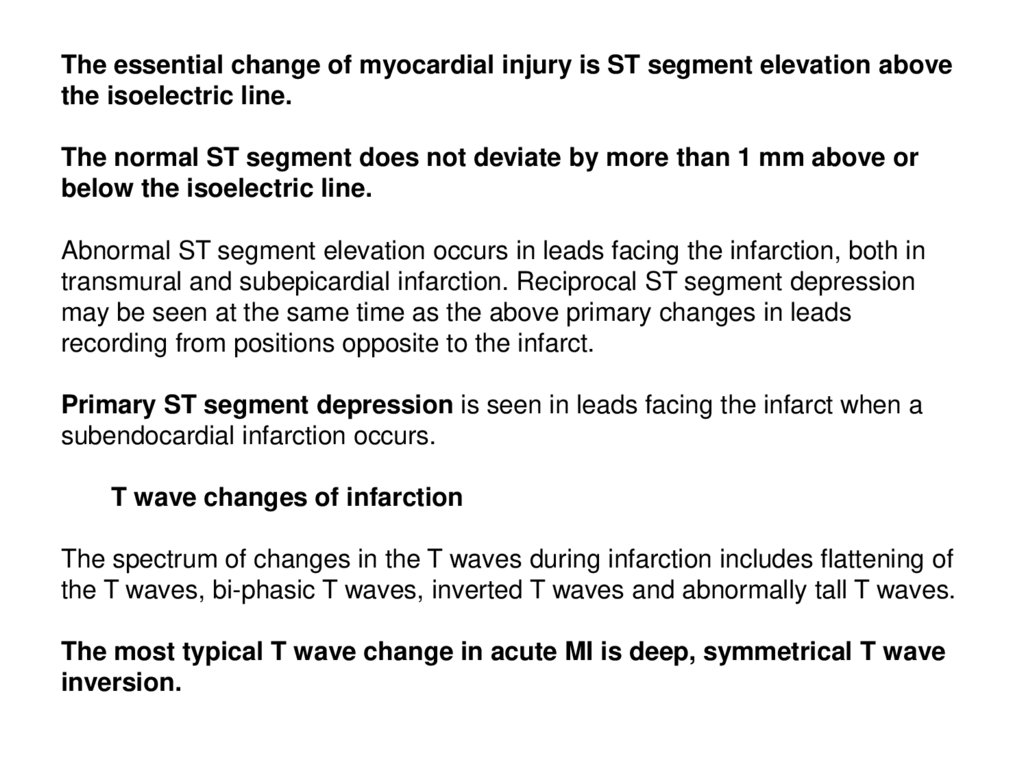
The essential change of myocardial injury is ST segment elevation abovethe isoelectric line.
The normal ST segment does not deviate by more than 1 mm above or
below the isoelectric line.
Abnormal ST segment elevation occurs in leads facing the infarction, both in
transmural and subepicardial infarction. Reciprocal ST segment depression
may be seen at the same time as the above primary changes in leads
recording from positions opposite to the infarct.
Primary ST segment depression is seen in leads facing the infarct when a
subendocardial infarction occurs.
T wave changes of infarction
The spectrum of changes in the T waves during infarction includes flattening of
the T waves, bi-phasic T waves, inverted T waves and abnormally tall T waves.
The most typical T wave change in acute MI is deep, symmetrical T wave
inversion.
29. Sequence of changes in acute MI
A) Shows the normal QRS complex in a lead.B & C) Within hours of the clinical onset of
an MI, there is ST segment elevation. At
this stage no QRS or T wave changes have
occurred. This indicates myocardial damage
only, not definitive evidence of infarction.
D) Within days, the R wave voltage falls and
abnormal Q waves appear. This is sufficient
evidence of an infarction. In addition, T wave
inversion will also have appeared but the ST
segment elevation may be less obvious than
before.
E) Within one or more weeks, the ST
segment changes revert completely to
normal. The R wave voltage remains low and
the abnormal Q waves persist. Deep,
symmetrical T wave inversion may develop
at this stage.
F) Months after the MI, the T waves may
gradually return to normal. The abnormal Q
waves and reduced R wave voltage persist.
Occasionally, all evidence of infarction may
be lost with the passing of time; this is due to
shrinkage of scar tissue.
30.
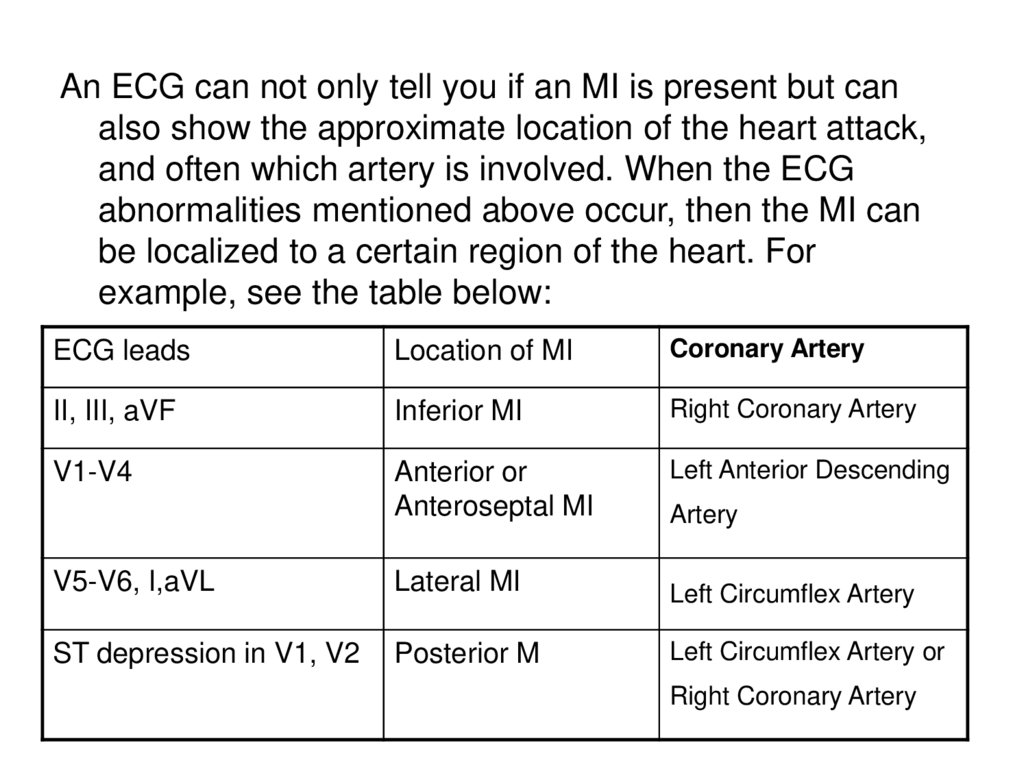
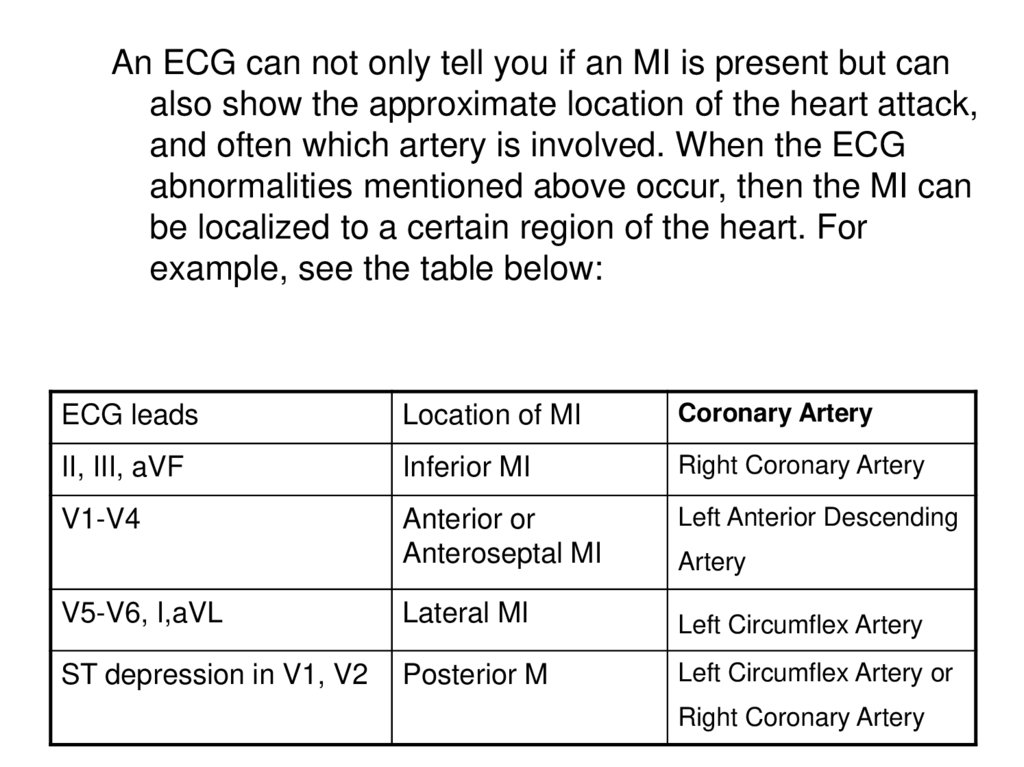
An ECG can not only tell you if an MI is present but canalso show the approximate location of the heart attack,
and often which artery is involved. When the ECG
abnormalities mentioned above occur, then the MI can
be localized to a certain region of the heart. For
example, see the table below:
ECG leads
Location of MI
Coronary Artery
II, III, aVF
Inferior MI
Right Coronary Artery
V1-V4
Anterior or
Anteroseptal MI
Left Anterior Descending
Artery
V5-V6, I,aVL
Lateral MI
Left Circumflex Artery
ST depression in V1, V2
Posterior M
Left Circumflex Artery or
Right Coronary Artery
31. Location of changes in MI
• Because primary ECGchanges occur in leads
overlying the infarct,
the location of an
infarct can be derived
by looking at the
primary changes
occurring in such
leads. This is depicted
in the following table:
32. Diagnostic criteria for MI
A definitive diagnosis of MI from the ECG can only be made on thebasis of abnormalities in the QRS complex. The following
changes are seen:
1) q waves which are either 0.04 s or longer in duration
(excluding aVR and lead III) or have a depth which is more than
25% of the height of the following R wave (excluding aVR and
lead III).
2) qs or QS complexes (excluding aVR and lead III).
3) Local area of inappropriately low R wave voltage.
Additional changes frequently associated with MI are:
a) ST segment elevation (convex upwards) in leads facing the
infarcted zone.
b) ST segment depression occurs as a reciprocal change in
leads mutually opposite to the primary leads showing evidence
of infarction.
c) Horizontal ST segment depression may occur as a primary
change in subendocardial infarction.
33.
34. Acute anterior MI
35. Extensive anterior/antero-lateral MI
Significant pathological Q waves (V2-6, I, aVL) plus markedST segment elevation are evidence for this large
anterior/antero-lateral MI. The exact age of the infarction
cannot be determined without clinical correlation and
previous ECGs, but this is likely to be a recent MI.
36. Inferior MI: Fully evolved
Significant pathological Q waves are seen in leads II, IIIand aVF along with resolving ST segment elevation and
symetrical T wave inversion. This is a classic inferior MI.
37. Inferior & antero-septal MI + RBBB
Inferior & antero-septal MI + RBBBPathological Q waves are seen in leads II, III, aVF (inferior MI) and in
leads V1-3 (antero-septal MI). RBBB is recognised by the wide QRS
(>0.12 s) and the anterior/rightwards orientation of terminal QRS
forces. When an antero-septal MI complicates RBBB (or vice versa),
the rSR' complex in V1 (typical of RBBB) becomes a qR complex.
38. Infero-posterior MI with RBBB
This is an unusual RBBB because the initial R wave is taller than the R'wave in lead V1. This is the clue for true posterior MI. The tall initial
R wave in V1 is a "pathological R" wave analagous to the
"pathological Q" wave of an anterior MI.
39. extensive anterior wall myocardial infarction.
Figure : A twelve-lead electrocardiogram (ECG), recorded on admission to Cardiac
Care Unit, showing recent extensive anterior wall myocardial infarction.
Coronary angiography revealed total occlusion of the proximal segment of left
anterior descending artery, and severe disease involving the proximal segment of the
obtuse marginal branch (Figure 3). He was treated with direct Percutaneous
Coronary Intervention (PCI).
40. Coronaroangiography
• Figure : Left coronaryartery angiograms
showing total occlusion of
the left anterior
descending artery (LAD)
and subtotal occlusion of
the obtuse marginal (OM)
branch of the left
circumflex coronary
artery.
41. Heart Attack Treatment
• A heart attack is a medical emergency! Hospitalization isrequired and, possibly, intensive care. Continuous ECG
monitoring is started immediately, because lifethreatening arrhythmias are the leading cause of death
in the first few hours of a heart attack.
The goals of treatment are to stop the progression of the
heart attack, to reduce the demands on the heart so that
it can heal, and to prevent complications.
An intravenous line will be inserted to administer
medications and fluids. Various monitoring devices may
be necessary. A urinary catheter may be inserted to
closely monitor fluid status.
Oxygen is usually given, even if blood oxygen levels are
normal. This makes oxygen readily available to the
tissues of the body and reduces the workload of the
heart.
42. Management of Patients with non-ST-elevation AMI in the prehospital setting
• Calling an ambulance• Clinical death –
cardiopulmonary resuscitation
• To calm down, to provide fresh
air, to seat
• Nitroglycerin 0.5 mg (tablets,
spray) 1-3 times every 3-5 min.
(check BP and pulse rate!)
• Aspirin (160-325 mg a day) to
chew
• Clopidogrel (Plavix, Reodar) –
300 mg → 75 mg a day
43. Management of Patients with non-ST-elevation AMI in the prehospital setting
• Inspection and physical examination• Taking ECG (whether there are or are not
changes in ST, Т, pathological Q wave,
impaired rhythm and conductibility)
• Decision as to admission to hospital
• to the Intensive Care Unit (ICU)
• to the emergency (infarction) department
44. TREATMENT OF NON-ST-ELEVATION AMI A list and range of obligatory medical services
1. Antithrombotic drugs: acetylsalicylicacid of 160 – 325 mg as a first dose, then
75 – 100 mg a day; + tienopyridin
derivatives: Clopidogrel of 300 – 600 mg
as a first dose, then 75 mg a day – DAPT.
45. TREATMENT OF NON-ST-ELEVATION AMI A list and range of obligatory medical services
• 2. Anticoagulants:• Unfractionated heparin 60 IU/kg as
intravenous (IV) bolus (up to 4000 IU),
then 12 IU/kg/hour as IV infusion (up to
1000 IU per hour) under the control over
aPPT (1,5 – 2 times higher than normal)
46. TREATMENT OF NON-ST-ELEVATION AMI A list and range of obligatory medical services
• ANTICOAGULANTS:• Low molecular weight heparins or
Fondaparinux subcutaneously (SC):
• Fondaparinux 2.5 mg SC once a day;
• Enoxaparin 1 mg/kg SC every 12 hours;
• Dalteparin 120 IU/kg every 12 hours;
• Nadroparin 86 IU/kg every 12 hours;
• Duration of therapy: 2-5 days
47. TREATMENT OF NON-ST-ELEVATION AMI A list and range of obligatory medical services
• 3. Antiischemic therapy:• β-adrenoreceptor blockers without intrinsic
sympathomimetic activity (Atenolol, Metoprolol,
Bisoprolol, Nebivolol) ;
• Nitrates (isosorbide dinitrate, isosorbide
mononitrate) or, in their intolerance, sydnonimins
(Sydnopharm);
• Calcium channel blockers (Verapamil,
Diltiazem) if β-blockers are contraindicated or in
patients with Prinzmetal’s angina.
48. TREATMENT OF NON-ST-ELEVATION AMI A list and range of obligatory medical services
• 4. Statins: Lovastatin, Simvastatin,Atorvastatin, Rosuvastatin.
• 5. ACE inhibitors or, in case of their
intolerance, angiotensin receptor
blockers (ARBs)
49. TREATMENT OF NON-ST-ELEVATION AMI A list and range of obligatory medical services
6. Non-narcotic and narcotic analgesics
if effect of short-acting nitrates is not sufficient;
7. Symptomatic therapy
(anti-hypertensive, antiarrhythmic);
8. Surgical myocardial revascularization
(indications and choice of a method of
revascularization are determined by the
character of coronary artery impairment based
on coronary ventriculography).
50. Heart Attack Treatment
• PAIN CONTROL MEDICATIONSSublingual (under the tongue) or intravenous (IV) nitrates
such as nitroglycerin are given for pain and to reduce the
oxygen requirements of the heart. Morphine or morphine
derivatives are potent pain killers that may also be given
for a heart attack.
• BLOOD THINNING MEDICATIONS
If the ECG recorded during chest pain shows a change
called "ST-segment elevation," clot-dissolving
(thrombolytic) therapy may be initiated within 6 hours of
the chest pain onset. This initial therapy will be
administered as an IV infusion of streptokinase or tissue
plasminogen activator, and will be followed by an IV
infusion of heparin. Heparin therapy will last for 48 to 72
hours. Additionally, warfarin,taken orally, may be
prescribed to prevent further development of clots
51. Basic therapy in ST-elevation AMI
• 1 – Pain relief (morphine 2-4 mg IV, every 10-15minutes);
• 2 – Oxygen therapy (through the mask or nasal
catheter, 2- 4 L/min)
• 3 – Reperfusion therapy (thrombolysis, PCI
and/or stenting, ACB);
• 4 – Anticoagulant therapy (unfractionated
heparin, low molecular weight heparins,
fondaparinux);
• 5 – Antithrombotic drugs: (aspirin,
clopidogrel);
52. Basic therapy in ST-elevation AMI
• 6 – β-blockers to all patients who have nocontraindications;
• 7 – Nitrates – at first nitroglycerin 0.5 mg
under the tongue, every 3-5 minutes, then
isoket 0.1% -10 mL IV infusion;
• 8 – ACE inhibitors to all patients who
have no contraindications;
• 9 – Statins
53. Thrombolysis
• Streptokinase – 1500 000 U in 100 ml ofsaline given as an IV infusion over 1 hour
is a widely used regimen .
• Streptokinase is antigenic and
occasionally causes serious allergic
manifestations. Circula-ting neutralising
antibodies may persist for 5 years or more.
• Streptokinase may also cause
hypotension
54. Thrombolysis
• Alteplase (human tissue plasminogenactivator or t-PA)
The standart regimen is given over 90 min
Bolus dose of 15 mg IV
Followed by 0,75 mg/kg body weight (but
not exceeding 50 mg ) over 30 min IV
Followed by 0,5 mg/kg body weight (but
not exceeding 35 mg ) over 60 min IV
55. Thrombolysis
• TENECTEPLASE (TNK) – is an effectiveas alteplase at redusing death and MI
whilst conferring similar intracerebral
bleeding risks.
• Bolus dose of 0,5 mg/kg body weight IV
during 10 sec.BUT not exceeding 50 mg.
56. Heart Attack Treatment
• Thrombolytic therapy is not appropriate forpeople who have had:
• A major surgery, organ biopsy, or major trauma within the
past 6 weeks
• Recent neurosurgery
• Head trauma within the past month
• History of GI (gastrointestinal) bleed
• Brain tumor
• Stroke within the past 6 months
• Aortic dissection
• Current severely elevated high blood pressure
• Use of thrombolytic therapy can be complicated by
significant bleeding.
57. Heart Attack Treatment
• A cornerstone of therapy for a heart attack isantiplatelet medication. Such medication can
prevent the collection of platelets at a site of
injury in a blood vessel wall -- like a crack in an
atherosclerotic plaque. Platelets collecting and
accumulating is the initial event that leads to clot
formation. One antiplatelet agent widely used is
aspirin. Two other important antiplatelet
medications are ticlopidine (Ticlid) and
clopidogrel (Plavix).
58. Heart Attack Treatment
• OTHER MEDICATIONS• Beta-blockers (like metoprolol, atenolol, and propranolol)
are used to reduce the workload of the heart.
• ACE Inhibitors (like ramipril, lisinopril, enalapril, or
captopril) to prevent heart failure.
• SURGERY AND OTHER PROCEDURES
Emergency coronary angioplasty may be required to
open blocked coronary arteries. This procedure may be
used instead of thrombolytic therapy, or in cases where
thrombolytics should not be used. Often the re-opening
of the coronary artery after angioplasty is ensured by
implantation of a small device called a stent. Emergency
coronary artery bypass surgery (CABG) may be required
in some cases.
59.
60.
61. Heart Attack Complications
• Arrhythmias such as ventricular tachycardia,ventricular fibrillation, heart blocks
• Congestive heart failure
• Cardiogenic shock
• Infarct extension: extension of the amount of
affected heart tissue
• Pericarditis(infection around the lining of the
heart)
• Pulmonary embolism (blood clot in the lungs)
• Complications of treatment (For example,
thrombolytic agents increases the risk of
bleeding.)
62. Heart Attack Prognosis (Expectations)
• The expected outcome varies with the amount andlocation of damaged tissue. The outcome is worse if
there is damage to the electrical conduction system (the
impulses that guide heart contraction).
Approximately one-third of cases are fatal. If the person
is alive 2 hours after an attack, the probable outcome for
survival is good, but may include complications.
Uncomplicated cases may recover fully; heart attacks
are not necessarily disabling. Usually the person can
gradually resume normal activity and lifestyle, including
sexual activity.
63. Heart Attack Prevention
To prevent a heart attack- control risk factors• Control blood pressure.
• Control total cholesterol levels. To help with
cholesterol control, doctor may prescribe a
medication of the statins group (atorvastatin,
simvastatin).
• Stop smoking if patient smoke.
• Eat a low fat diet rich in fruits and vegetables
and low in animal fat.
• Control diabetes.
64. Heart Attack Prevention
• Lose weight if patient are overweight.• Exercise daily or several times a week by
walking and other exercises to improve heart
fitness. (Consult your health care provider first.)
• If patient have one or more risk factors for heart
disease, possible taking aspirin to help prevent a
heart attack.
After a heart attack, follow-up care is important
to reduce the risk of having a second heart
attack. Often, a cardiac rehabilitation program is
recommended to help you gradually return to a
"normal" lifestyle. Follow the exercise, diet, and
medication regimen prescribed by your doctor.
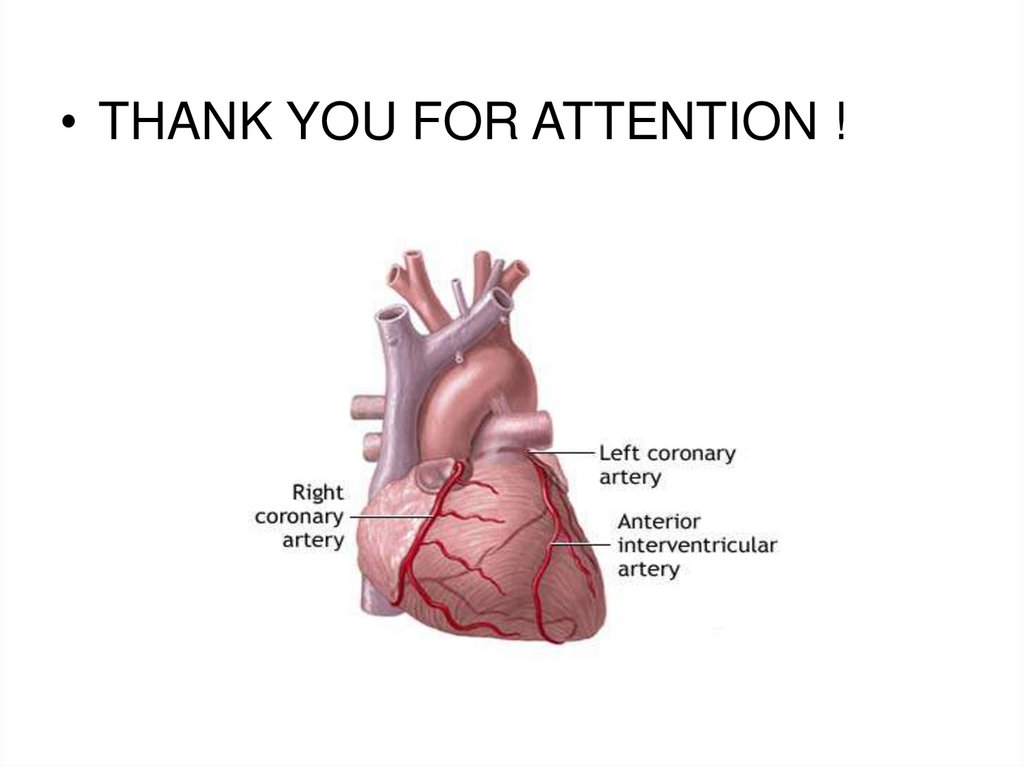
65.
• THANK YOU FOR ATTENTION !66. (Post Myocardial Infarction ECG Wave Tracings) Various phases can be seen through ECG wave tracings following a heart attack:
(Acute MI)
A heart attack or acute myocardial
infarction (MI) occurs when one of
the arteries that supplies the heart
muscle becomes blocked. Blockage
may be caused by spasm of the
artery or by atherosclerosis with
acute clot formation. The blockage
results in damaged tissue and a
permanent loss of contraction of
this portion of the heart muscle.
(Post Myocardial Infarction ECG Wave Tracings)
Various phases can be seen through ECG wave tracings following a heart attack:
Hyperacute phase begins immediately after a heart attack
Fully evolved phase starts a few hours to days after a heart attack
Resolution phase appears a few weeks after a heart attack
Stabilized chronic phase is the last phase and typically has permanent
pathological changes compared to a normal ECG tracing.
67.
68. Heart Attack Treatment :
A heart attack is a medical emergency! Hospitalization is required and, possibly,intensive care. Continuous ECG monitoring is started immediately, because lifethreatening arrhythmias are the leading cause of death in the first few hours of a
heart attack.
The goals of treatment are to stop the progression of the heart attack, to reduce the
demands on the heart so that it can heal, and to prevent complications.
An intravenous line will be inserted to administer medications and fluids. Various
monitoring devices may be necessary. A urinary catheter may be inserted to closely
monitor fluid status.
Oxygen is usually given, even if blood oxygen levels are normal. This makes oxygen
readily available to the tissues of the body and reduces the workload of the heart.
PAIN CONTROL MEDICATIONS
Sublingual (under the tongue) or intravenous (IV) nitrates such as nitroglycerin are
given for pain and to reduce the oxygen requirements of the heart. Morphine or
morphine derivatives are potent pain killers that may also be given for a heart attack.
BLOOD THINNING MEDICATIONS
If the ECG recorded during chest pain shows a change called "ST-segment
elevation," clot-dissolving (thrombolytic) therapy may be initiated within 6 hours of the
chest pain onset. This initial therapy will be administered as an IV infusion of
streptokinase or tissue plasminogen activator, and will be followed by an IV infusion
of heparin. Heparin therapy will last for 48 to 72 hours. Additionally, warfarin,taken
orally, may be prescribed to prevent further development of clots.
69.
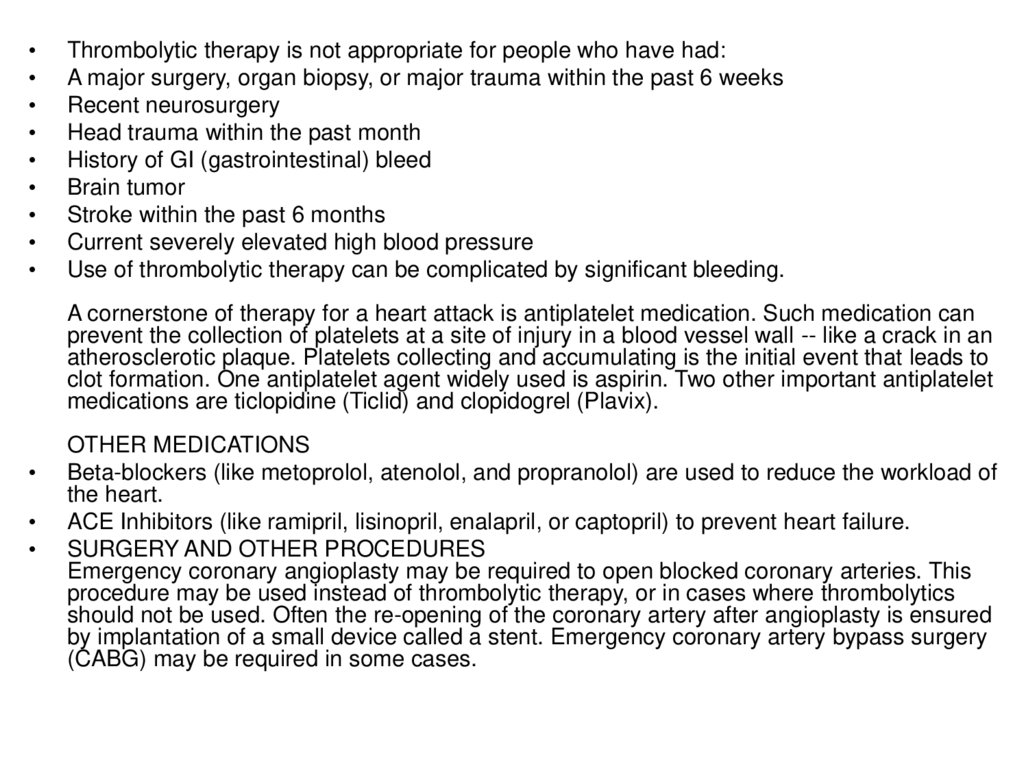
Thrombolytic therapy is not appropriate for people who have had:
A major surgery, organ biopsy, or major trauma within the past 6 weeks
Recent neurosurgery
Head trauma within the past month
History of GI (gastrointestinal) bleed
Brain tumor
Stroke within the past 6 months
Current severely elevated high blood pressure
Use of thrombolytic therapy can be complicated by significant bleeding.
A cornerstone of therapy for a heart attack is antiplatelet medication. Such medication can
prevent the collection of platelets at a site of injury in a blood vessel wall -- like a crack in an
atherosclerotic plaque. Platelets collecting and accumulating is the initial event that leads to
clot formation. One antiplatelet agent widely used is aspirin. Two other important antiplatelet
medications are ticlopidine (Ticlid) and clopidogrel (Plavix).
OTHER MEDICATIONS
Beta-blockers (like metoprolol, atenolol, and propranolol) are used to reduce the workload of
the heart.
ACE Inhibitors (like ramipril, lisinopril, enalapril, or captopril) to prevent heart failure.
SURGERY AND OTHER PROCEDURES
Emergency coronary angioplasty may be required to open blocked coronary arteries. This
procedure may be used instead of thrombolytic therapy, or in cases where thrombolytics
should not be used. Often the re-opening of the coronary artery after angioplasty is ensured
by implantation of a small device called a stent. Emergency coronary artery bypass surgery
(CABG) may be required in some cases.
70. Heart Attack Prognosis (Expectations) :
The expected outcome varies with the amount and location ofdamaged tissue. The outcome is worse if there is damage to the
electrical conduction system (the impulses that guide heart
contraction).
Approximately one-third of cases are fatal. If the person is alive 2
hours after an attack, the probable outcome for survival is good, but
may include complications.
Uncomplicated cases may recover fully; heart attacks are not
necessarily disabling. Usually the person can gradually resume
normal activity and lifestyle, including sexual activity.
71. Heart Attack Complications :
• Arrhythmiassuch as ventricular tachycardia, ventricular fibrillation,heart blocks
• Congestive heart failure
• Cardiogenic shock
• Infarct extension: extension of the amount of affected heart tissue
• Pericarditis(infection around the lining of the heart)
• Pulmonary embolism (blood clot in the lungs)
• Complications of treatment (For example, thrombolytic agents
increases the risk of bleeding.)
72. INTRODUCTION
Despite its low sensitivity and specificity (67% and 72%,respectively), exercise testing has remained one of the most widely
used noninvasive tests to determine the prognosis in patients with
suspected or established coronary disease.
As a screening test for coronary artery disease, the exercise stress
test is useful in that it is relatively simple and inexpensive. It has
been considered particularly helpful in patients with chest pain
syndromes who have moderate probability for coronary artery
disease, and in whom the resting electrocardiogram (ECG) is
normal. The following case presentation and discussion will question
the predictive value of a negative stress testing in patients with
moderate probability for coronary artery disease.
73.
CASE PRESENTATIONOn October 02, 2006, a 56 year-old smoker male presented to our emergency
room (ER) with a prolonged episode of epigastric and lower sternal
discomfort. His discomfort was relieved with multiple doses of sublingual
nitroglycerine and 2 doses of oral antacids. His physical examination,
electrocardiogram (ECG),and cardiac markers (including creatine
phosphokinase and Troponin I) were unremarkable. His past medical history
is significant for mild hyperlipidemia and hypertension. He had a strong
family history of premature coronary artery disease; his brother died of
myocardial infarction at age 52 years.
Although his chest discomfort was atypical, he was considered as an
intermediate-risk patient, based on his multiple cardiac risks. A symptomlimited exercise stress test was carried out. He exercised for 12 minutes on
the standard Bruce protocol, achieving a peak heart rate of 144 per minute
and a total workload equivalent to 12.1 METS. He reported no chest pain
during this test. The exercise ECG revealed no significant ST-segment
depression (Figure 1). Therefore, this test was considered as a low-risk
negative test, predicting an annual mortality rate of less than 1%.
74.
On November 21, 2006, he presented to our ER again with several hours of mid-sternal chest pain radiating to the leftarm. His ECG revealed extensive ST-elevation anterior myocardial infarction (Figure 2).
Figure 1: A twelve-lead exercise stress electrocardiogram (ECG) recorded within the first minute of recovery,
showing no significant ST-segment depression in response to exercise.
75.
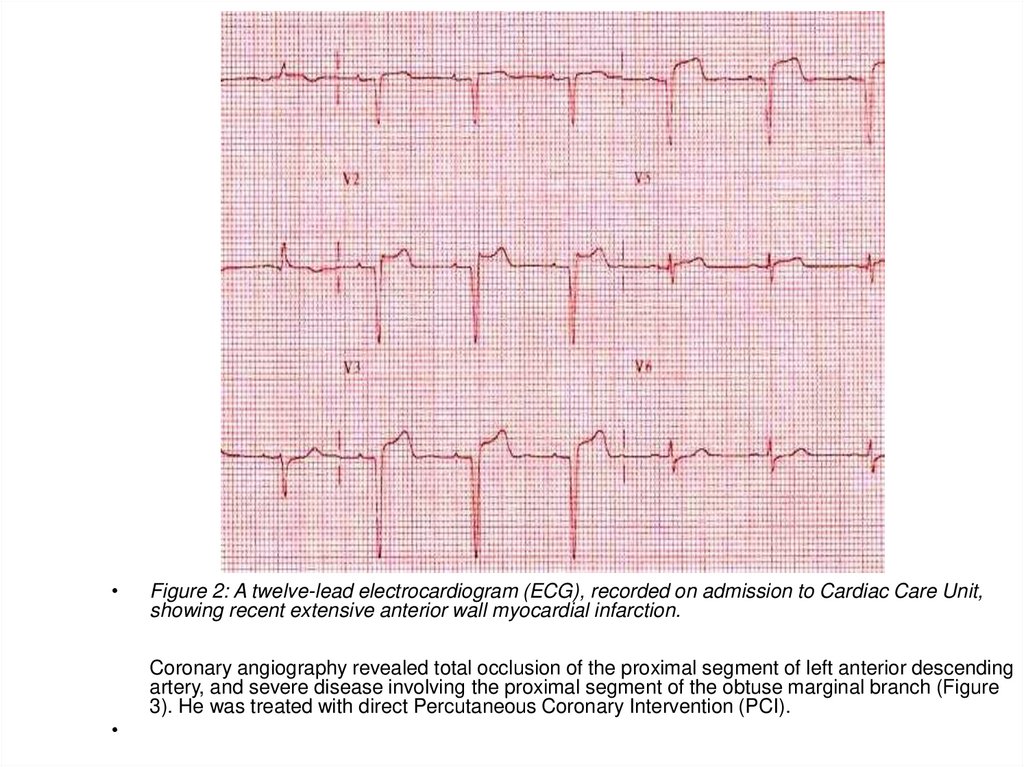
Figure 2: A twelve-lead electrocardiogram (ECG), recorded on admission to Cardiac Care Unit,
showing recent extensive anterior wall myocardial infarction.
Coronary angiography revealed total occlusion of the proximal segment of left anterior descending
artery, and severe disease involving the proximal segment of the obtuse marginal branch (Figure
3). He was treated with direct Percutaneous Coronary Intervention (PCI).
76.
• Figure 3: Left coronaryartery angiograms
showing total occlusion of
the left anterior
descending artery (LAD)
and subtotal occlusion of
the obtuse marginal (OM)
branch of the left
circumflex coronary
artery.
77. DISCUSSION
Exercise stress testing has traditionally served as a noninvasive tool in the diagnosisof coronary artery disease. It complements the medical history and physical
examination, and it remains the second most commonly performed cardiologic
procedure next to the routine ECG.
Our patient (described above) is also considered an intermediate-risk patient. Atypical
chest pain in a 56-year-old man is associated with a 50% probability of CAD.
Diagnostic stress testing is most valuable in this intermediate pretest probability
category, because the test result has the largest potential effect on diagnostic
outcome.
The type of patient being tested and the results of the exercise stress test must be
considered together when determining the likelihood of subsequent cardiac event [1].
The estimation of pretest probability of obstructive CAD is based on the patient’s
history (including age, gender, and chest pain characteristics), physical examination,
and initial testing.
78. Typical or definite angina (table 1) makes the pretest probability of obstructive CAD so high that the test result does not
dramatically change the probability.Exercise-induced typical anginal chest pain can be a
valuable indicator of the presences of coronary artery
disease. The presence of diagnostic ST-segment
depression in association with exercise-induced chest pain
is highly predictive of significant coronary artery disease [2]
(table 2).
79.
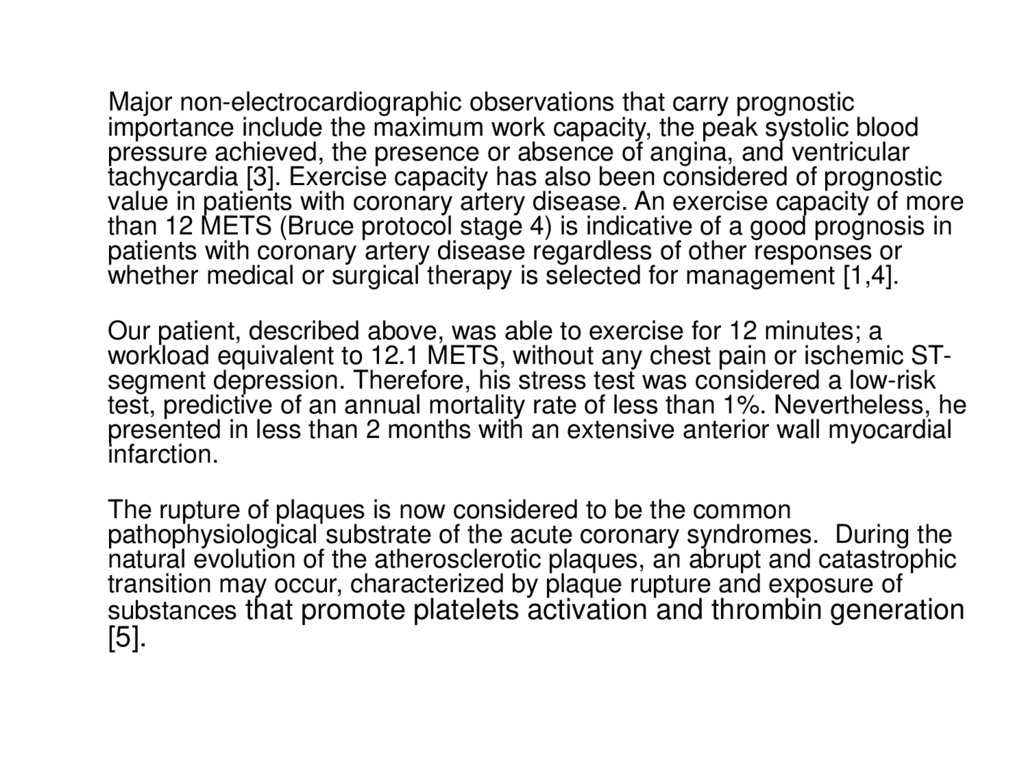
Major non-electrocardiographic observations that carry prognosticimportance include the maximum work capacity, the peak systolic blood
pressure achieved, the presence or absence of angina, and ventricular
tachycardia [3]. Exercise capacity has also been considered of prognostic
value in patients with coronary artery disease. An exercise capacity of more
than 12 METS (Bruce protocol stage 4) is indicative of a good prognosis in
patients with coronary artery disease regardless of other responses or
whether medical or surgical therapy is selected for management [1,4].
Our patient, described above, was able to exercise for 12 minutes; a
workload equivalent to 12.1 METS, without any chest pain or ischemic STsegment depression. Therefore, his stress test was considered a low-risk
test, predictive of an annual mortality rate of less than 1%. Nevertheless, he
presented in less than 2 months with an extensive anterior wall myocardial
infarction.
The rupture of plaques is now considered to be the common
pathophysiological substrate of the acute coronary syndromes. During the
natural evolution of the atherosclerotic plaques, an abrupt and catastrophic
transition may occur, characterized by plaque rupture and exposure of
substances that promote platelets activation and thrombin generation
[5].
80.
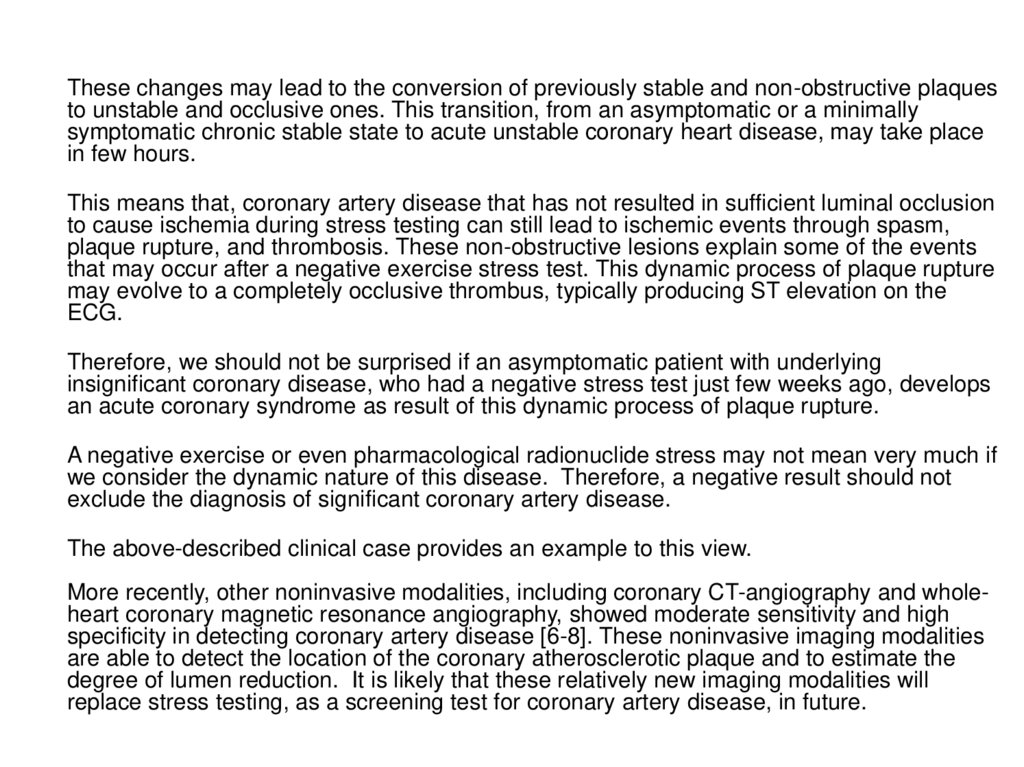
These changes may lead to the conversion of previously stable and non-obstructive plaquesto unstable and occlusive ones. This transition, from an asymptomatic or a minimally
symptomatic chronic stable state to acute unstable coronary heart disease, may take place
in few hours.
This means that, coronary artery disease that has not resulted in sufficient luminal occlusion
to cause ischemia during stress testing can still lead to ischemic events through spasm,
plaque rupture, and thrombosis. These non-obstructive lesions explain some of the events
that may occur after a negative exercise stress test. This dynamic process of plaque rupture
may evolve to a completely occlusive thrombus, typically producing ST elevation on the
ECG.
Therefore, we should not be surprised if an asymptomatic patient with underlying
insignificant coronary disease, who had a negative stress test just few weeks ago, develops
an acute coronary syndrome as result of this dynamic process of plaque rupture.
A negative exercise or even pharmacological radionuclide stress may not mean very much if
we consider the dynamic nature of this disease. Therefore, a negative result should not
exclude the diagnosis of significant coronary artery disease.
The above-described clinical case provides an example to this view.
More recently, other noninvasive modalities, including coronary CT-angiography and wholeheart coronary magnetic resonance angiography, showed moderate sensitivity and high
specificity in detecting coronary artery disease [6-8]. These noninvasive imaging modalities
are able to detect the location of the coronary atherosclerotic plaque and to estimate the
degree of lumen reduction. It is likely that these relatively new imaging modalities will
replace stress testing, as a screening test for coronary artery disease, in future.
81. ECG Basics
The electrocardiogram (ECG) is a diagnostic tool thatmeasures and records the electrical activity of the
heart in detail. Being able to interpretate these
details allows diagnosis of a wide range of heart
problems.
ECG Electrodes
Skin Preparation:
Clean with an alcohol wipe if necessary. If the patients
are very hairy – shave the electrode areas.
ECG standard leads
There are three of these leads, I, II and III.
Lead I: is between the right arm and left arm
electrodes, the left arm being positive.
Lead II: is between the right arm and left leg
electrodes, the left leg being positive.
Lead III: is between the left arm and left leg
electrodes, the left leg again being positive.
Chest Electrode Placement
V1: Fourth intercostal space to the right of the
sternum.
V2: Fourth intercostal space to the Left of the
sternum.
V3: Directly between leads V2 and V4.
V4: Fifth intercostal space at midclavicular line.
V5: Level with V4 at left anterior axillary line.
V6: Level with V5 at left midaxillary line. (Directly
under the midpoint of the armpit)
82. ECG Leads - Views of the Heart
The ECG records the electrical activity that resultswhen the heart muscle cells in the atria and
ventricles contract.
Atrial contractions show up as the P wave.
Ventricular contractions show as a series
known as the QRS complex.
The third and last common wave in an ECG
is the T wave. This is the electrical activity
produced when the ventricles are recharging
for the next contraction (repolarizing).
Interestingly, the letters P, Q, R, S, and T are
not abbreviations for any actual words but
were chosen many years ago for their
position in the middle of the alphabet.
The electrical activity results in P, QRS, and
T waves that are of different sizes and
shapes. When viewed from different leads,
these waves can show a wide range of
abnormalities of both the electrical
conduction system and the muscle tissue of
the hearts 4 pumping chambers.
83.
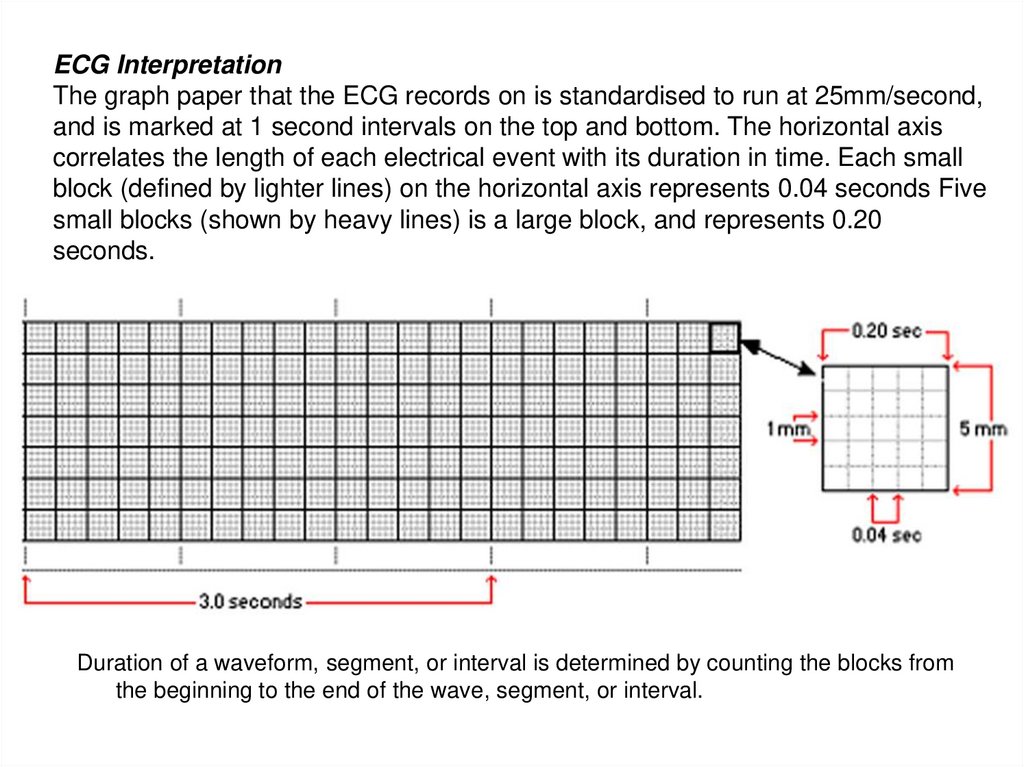
ECG InterpretationThe graph paper that the ECG records on is standardised to run at 25mm/second,
and is marked at 1 second intervals on the top and bottom. The horizontal axis
correlates the length of each electrical event with its duration in time. Each small
block (defined by lighter lines) on the horizontal axis represents 0.04 seconds Five
small blocks (shown by heavy lines) is a large block, and represents 0.20
seconds.
Duration of a waveform, segment, or interval is determined by counting the blocks from
the beginning to the end of the wave, segment, or interval.
84.
P-Wave: represents atrial depolarization - thetime necessary for an electrical impulse
from the sinoatrial (SA) node to spread
throughout the atrial musculature.
• Location: Precedes QRS complex
Amplitude: Should not exceed 2 to 2.5
mm in height Duration: 0.06 to 0.11
seconds
• P-R Interval: represents the time it takes
an impulse to travel from the atria through
the AV node, bundle of His, and bundle
branches to the Purkinje fibres.
• Location: Extends from the beginning of
the P wave to the beginning of the QRS
complex
Duration: 0.12 to 0.20 seconds.
85.
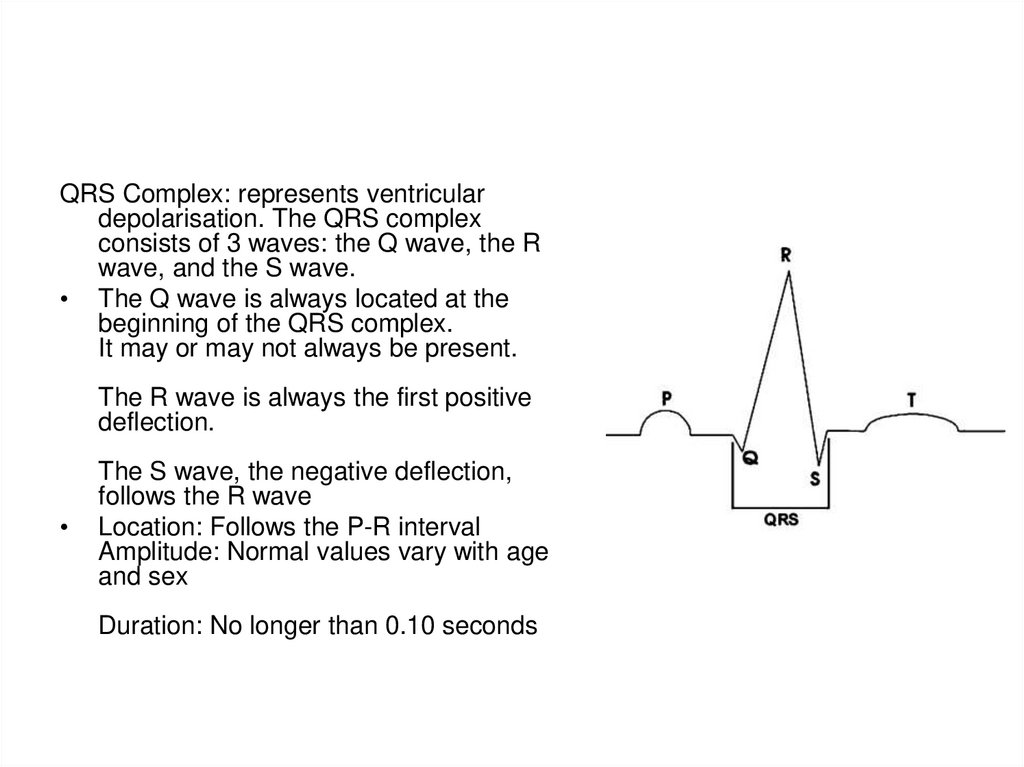
QRS Complex: represents ventriculardepolarisation. The QRS complex
consists of 3 waves: the Q wave, the R
wave, and the S wave.
• The Q wave is always located at the
beginning of the QRS complex.
It may or may not always be present.
The R wave is always the first positive
deflection.
The S wave, the negative deflection,
follows the R wave
Location: Follows the P-R interval
Amplitude: Normal values vary with age
and sex
Duration: No longer than 0.10 seconds
86.
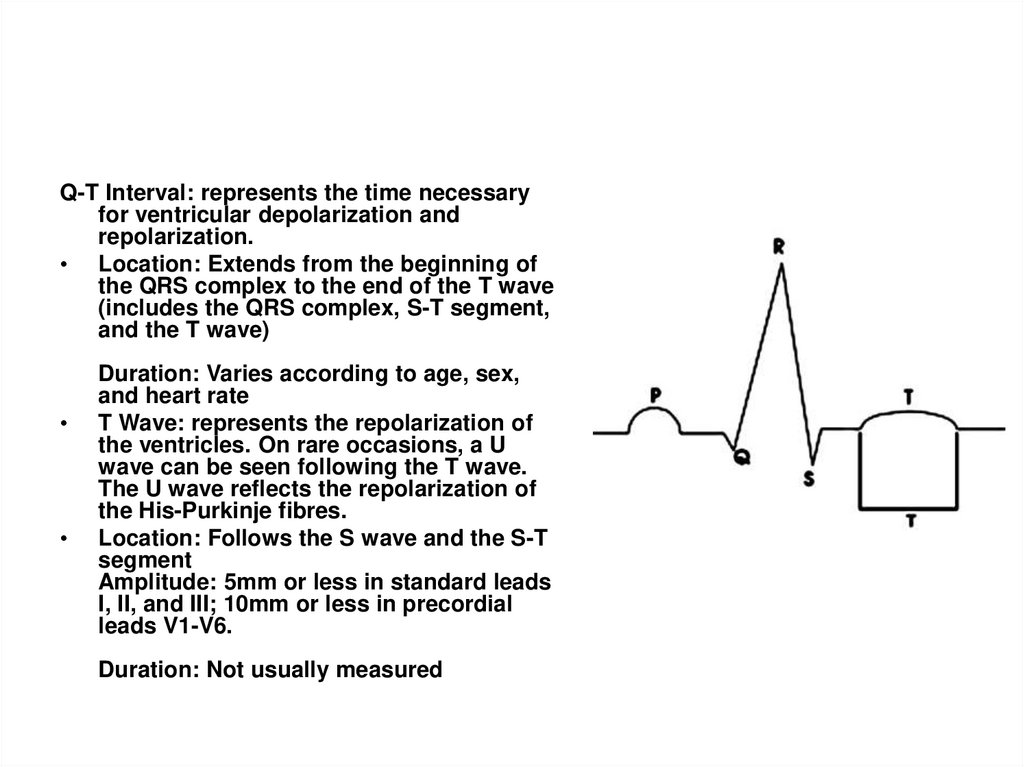
Q-T Interval: represents the time necessaryfor ventricular depolarization and
repolarization.
• Location: Extends from the beginning of
the QRS complex to the end of the T wave
(includes the QRS complex, S-T segment,
and the T wave)
Duration: Varies according to age, sex,
and heart rate
T Wave: represents the repolarization of
the ventricles. On rare occasions, a U
wave can be seen following the T wave.
The U wave reflects the repolarization of
the His-Purkinje fibres.
Location: Follows the S wave and the S-T
segment
Amplitude: 5mm or less in standard leads
I, II, and III; 10mm or less in precordial
leads V1-V6.
Duration: Not usually measured
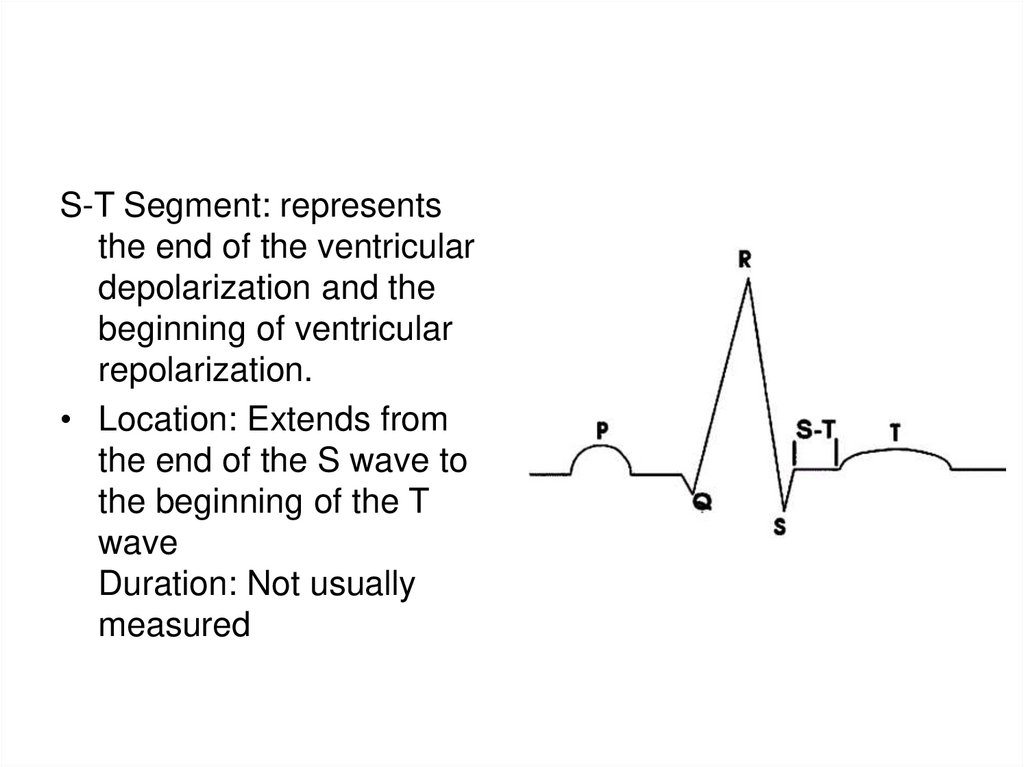
87.
S-T Segment: representsthe end of the ventricular
depolarization and the
beginning of ventricular
repolarization.
• Location: Extends from
the end of the S wave to
the beginning of the T
wave
Duration: Not usually
measured
88. The ECG and Myocardial Infarction
• During an MI, theECG goes through a
series of
abnormalities. The
initial abnormality is
called a hyperacute
T wave. This is a T
wave that is taller and
more pointed than the
normal T wave.
Hyperacute T Wave
89.
The abnormality lasts for a very short time, and thenelevation of the ST segment occurs. This is the hallmark
abnormality of an acute MI. It occurs when the heart
muscle is being injured by a lack of blood flow and
oxygen and is also called a current of injury.
ST Elevation
90.
An ECG can not only tell you if an MI is present but canalso show the approximate location of the heart attack,
and often which artery is involved. When the ECG
abnormalities mentioned above occur, then the MI can
be localized to a certain region of the heart. For
example, see the table below:
ECG leads
Location of MI
Coronary Artery
II, III, aVF
Inferior MI
Right Coronary Artery
V1-V4
Anterior or
Anteroseptal MI
Left Anterior Descending
Artery
V5-V6, I,aVL
Lateral MI
Left Circumflex Artery
ST depression in V1, V2
Posterior M
Left Circumflex Artery or
Right Coronary Artery
91. Right Ventricular Myocardial Infarction EKG
CharacteristicsThis EKG shows an Acute Inferior Myocardial Infarction which is often
associated with a Right Ventricular Myocardial Infarction. If there
is ST elevation in V1 and V2, the RV infarction should be
considered.
92. ECG Rounds
A 76-year-old retired physician came to the clinic for a medical check-up. He had neverexperienced any serious medical problem and had no history of heart disease. His
physical examination was unremarkable. A chest x-ray was ordered, revealing
prominence of the right heart border in the area of the ascending aorta, which was
not seen on an old x-ray taken 7 years earlier. His electrocardiogram (ECG) revealed
some irregularities (Figure 1).
Questions: Does the ECG show any specific heart disease? How do you explain the
loss of anterolateral R-wave forces? Is it a “Q-wave equivalent” and a marker of
previous silent myocardial infarction (MI) in this patient?
93. Inferior Myocardial Infarction with AV Block
94.
CharacteristicsBoth bradyarrhythmias and conduction disturbances can be seen with
myocardial infarctions and are generally related to ischemia or autonomic
disturbance. The clinical features and management of bradyarrhythmias
and conduction block depends on the location of the infarction. The right
coronary artery supplies the SA node in 60 percent of people and the left
circumflex the remaining. In over 90 percent of people, the RCA feeds the
AV node and proximal His. The terminal portion of the His and main left
bundle and right bundle branch are supplied by septal perforators of the
LAD. Sinus bradycardia, prolonged PR conduction with Wenkebach and
complete heart block are common in inferior myocardial infarctions (IMI).
Complete AV block occurs in approximately 10 percent of patients with IMI.
This rarely occurs suddenly, most often seen with prolonged PR conduction
gradually progressing to complete AV block. AV block occurs within the node
in over 90 percent of cases and typically results in a transient block. The
escape complex is usually narrow and infrequently requires pacing.
Bradyarrhythmias occurring in the setting of inferior infarctions are generally
responsive to atropine.
95. The ECG in acute myocardial infarction (MI)
Acute MI may cause changes in the QRS complex, ST segment or the T wave.However, the only definitive diagnostic changes of myocardial infarction are
changes in the QRS complex.
The QRS complex in infarction
Two types of QRS abnormalities may indicate infarction:
1) Inappropriately low R wave voltage in a local area and
2) Abnormal Q waves
The above two abnormalities are actually part of the same process - i.e. the
development of a negative Q wave and the reduction in size of the positive
wave.
The loss of positivity is the result of myocardial necrosis beneath the
exploring electrode. The size of the positive wave in each precordial lead is
related to the thickness of viable myocardium underneath that electrode.
96.
Abnormal Q waves and QS complexesIn a transmural infarction (endocardium to epicardium), there will be total
loss of R waves in leads overlying the infracted zone. This gives rise to
entirely negative waves - i.e. QS complexes. These negative waves are the
result of depolarisation of the posterior wall of the ventricle travelling from
endocardium to epicardium (i.e. away from the anterior leads).
The reduction in R wave voltage can only be confirmed if either a previous
ECG shows a significantly greater R wave height in the appropriate leads
before the infarction occurred, or the leads involved are two or more of the
leads V2 to V5.
Therefore, the four possible QRS changes indicative of infarction are:
1) Reduced R wave voltage (confirmed by previous ECGs)
2) Abnormal Q waves without any conclusive evidence of R wave reduction
3) Reduced R wave voltage in association with abnormal Q waves and
4) QS complexes.
These four changes represent increasing thickness of infarction as part of a
common process. A combination of these findings is seen in an infarction of
non-uniform thickness.
97.
Abnormal Q wavesQ waves may be recognised to be abnormal because of:
1) Abnormal width (duration) - i.e. Q wave = 0.04 s or
2) Abnormal depth (relative to the following R wave) - i.e. depth of Q wave >25% of the height of the following R
wave is abnormal.
ST segment changes in myocardial infarction
Dramatic ST segment changes occur in the early stages of myocardial infarction. Such changes indicate
myocardial injury rather than infarction.
The injury state is unstable, and acute ST segment elevation always resolves to some extent and usually
resolves completely. The resolution of the acute ST elevation is usually accompanied by development of the QRS
changes of frank infarction, although occasionally, it may resolve without the development of diagnostic changes
of infarction.
The ST segment shift is produced by myocardial injury, which causes a disturbance in the current flow across the
cell membrane.
The essential change of myocardial injury is ST segment elevation above the isoelectric line.
The normal ST segment does not deviate by more than 1 mm above or below the isoelectric line.
Abnormal ST segment elevation occurs in leads facing the infarction, both in transmural and subepicardial
infarction. Reciprocal ST segment depression may be seen at the same time as the above primary changes in
leads recording from positions opposite to the infarct.
Primary ST segment depression is seen in leads facing the infarct when a
ubendocardial infarction occurs.
T wave changes of infarction
The spectrum of changes in the T waves during infarction includes flattening of the T waves, bi-phasic T waves,
inverted T waves and abnormally tall T waves.
The most typical T wave change in acute MI is deep, symmetrical T wave inversion.
98. Sequence of changes in acute MI
A) Shows the normal QRS complex in a lead.B & C) Within hours of the clinical onset of an
MI, there is ST segment elevation. At this
stage no QRS or T wave changes have
occurred. This indicates myocardial damage
only, not definitive evidence of infarction.
D) Within days, the R wave voltage falls and
abnormal Q waves appear. This is sufficient
evidence of an infarction. In addition, T wave
inversion will also have appeared but the ST
segment elevation may be less obvious than
before.
E) Within one or more weeks, the ST segment
changes revert completely to normal. The R
wave voltage remains low and the abnormal Q
waves persist. Deep, symmetrical T wave
inversion may develop at this stage.
F) Months after the MI, the T waves may
gradually return to normal. The abnormal Q
waves and reduced R wave voltage persist.
Occasionally, all evidence of infarction may be
lost with the passing of time; this is due to
shrinkage of scar tissue.
99. Location of changes in MI
Because primary ECGchanges occur in leads
overlying the infarct,
the location of an
infarct can be derived
by looking at the
primary changes
occurring in such leads.
This is depicted in the
following table:
100. Examples of ECGs depicting MI
Antero-septal MI: Fully evolvedThe QS complexes, resolving ST segment elevation and T wave inversions in V1-2 are evidence
for a fully evolved antero-septal MI. The inverted T waves in V3-5, I, aVL are also probably related
to the MI.
101. Acute anterior MI
102. Extensive anterior/antero-lateral MI
Significant pathological Q waves (V2-6, I, aVL) plus marked STsegment elevation are evidence for this large anterior/antero-lateral
MI. The exact age of the infarction cannot be determined without
clinical correlation and previous ECGs, but this is likely to be a
recent MI.
103. High lateral wall MI
104. Inferior MI: Fully evolved
Significant pathological Q waves are seen in leads II, III and aVF alongwith resolving ST segment elevation and symetrical T wave
inversion. This is a classic inferior MI.
105. Inferior & antero-septal MI + RBBB
Inferior & antero-septal MI + RBBBPathological Q waves are seen in leads II, III, aVF (inferior MI) and in
leads V1-3 (antero-septal MI). RBBB is recognised by the wide QRS
(>0.12 s) and the anterior/rightwards orientation of terminal QRS
forces. When an antero-septal MI complicates RBBB (or vice versa),
the rSR' complex in V1 (typical of RBBB) becomes a qR complex.
106. Postero-lateral MI: Fully evolved
The "true" posterior MI is recognised by pathological R waves in leadsV1-2. These are the posterior equivalent of pathological Q waves
(seen from the perspective of the anterior leads). Tall T waves in
these same leads are the posterior equivalent of inverted T waves in
this fully evolved MI. The loss of forces in V6, I, aVL suggest a
lateral wall extension of this MI.
107. Infero-posterior MI with RBBB
This is an unusual RBBB because the initial R wave is taller than the R'wave in lead V1. This is the clue for true posterior MI. The tall initial
R wave in V1 is a "pathological R" wave analagous to the
"pathological Q" wave of an anterior MI.
108. Diagnostic criteria for MI
A definitive diagnosis of MI from the ECG can only be made on thebasis of abnormalities in the QRS complex. The following changes
are seen:
1) q waves which are either 0.04 s or longer in duration (excluding
aVR and lead III) or have a depth which is more than 25% of the
height of the following R wave (excluding aVR and lead III).
2) qs or QS complexes (excluding aVR and lead III).
3) Local area of inappropriately low R wave voltage.
Additional changes frequently associated with MI are:
a) ST segment elevation (convex upwards) in leads facing the
infarcted zone.
b) ST segment depression occurs as a reciprocal change in leads
mutually opposite to the primary leads showing evidence of
infarction.
c) Horizontal ST segment depression may occur as a primary change in
subendocardial infarction.
109. Reciprocal changes
In addition to the primary changes that occur in the ECG leads facing theinfarcted myocardium, "reciprocal changes" may occur in leads opposite to
the site of infarction. The changes are just the inverse of the primary
changes.
Thus, "ST segment elevation and T wave inversion" will appear as "ST
segment depression and tall pointed T waves", respectively.
The inferior limb leads on the one hand and the precordial leads, together
with leads I and aVL, on the other hand are "mutually opposite". Thus,
primary changes in one of the above groups will usually be accompanied by
reciprocal changes in the other group.
It will be safe to assume that if on the ECG there is ST segment elevation in
one group (as above) and ST segment depression in the other group, the
elevation is the primary change and the ST segment depression is the
secondary change.
110. True posterior MI
Infarction evident in the inferior leads (II, IIIand aVF) was previously called posterior
infarction (now called inferior infarction).
However, true posterior infarction is quite
rare and is not easily recognised, as
none of the ECG leads are actually
situated posteriorly.
Hence, it is only recognisable by looking
for "reciprocal" changes in the anterior
leads. Primary changes are not seen, as
there are no actual posterior leads.
The changes in the ECG of a true
posterior infarction are:
1) Abnormally tall and broad "R" waves in
V1 (reciprocal to abnormally deep and
wide q waves in a posterior lead, if there
were any) and
2) ST segment depression in V1 in recent
infarcts; in infarcts of intermediate age,
tall T waves may be present in V1, V2
and V3.
Right-sided chest leads, V1R - V6R, are shown.
The true posterior MI is evidenced by the
marked ST segment elevation in V1R (actual
V2) and V2R (actual V1). The RV MI is
evidenced by the ST elevation in V3R to V6R.
111. Subendocardial infarction
Infarcts are most commonly intramural infarcts (transmural orsubepicardial). Subendocardial infarcts are relatively rare and may
encircle the interior of the left ventricle.
The ECG shows primary ST segment depression or deep
symmetrical T wave inversion without any changes in the QRS
complexes. Since these changes can also be produced
by myocardial ischaemia without infarction, the diagnosis of a
subendocardial infarction cannot be made with a single ECG (unless
correlated with clinical or enzyme evidence of infarction).
When ST depression is the primary change, it will be seen in all or
most leads except the cavity leads (aVR - always a cavity lead, aVL
- a cavity lead in a vertical heart and aVF - a cavity lead in a
horizontal heart). By definition, cavity leads inevitably show QS
complexes.
112. Changes in myocardial ischaemia
Hypoxia of the myocardium may occur in the absence of infarction andnecrosis. The changes may occur following stress (physical or
emotional) or even spontaneously.
Significant degrees of ischaemia may exist with no evidence of ECG
abnormalities. The changes, when present, are confined to the ST
segment and T waves. There will be no change in the QRS
complexes.
The following ECG changes may accompany myocardial ischaemia:
1) Flattening of T waves
2) Inverted T waves
3) Abnormally tall T waves
4) "Normalisation" of primarily abnormal T waves
5) Sloping ST segment depression
6) Horizontal ST segment depression
7) ST segment elevation
8) Any combination of the above changes