

Похожие презентации:


Sustainable & Carbon Economy
1.
6th Forum of Academic FundraisingYekaterinburg, 12/11/2020
Sustainable & Carbon Economy
New Opportunity for Universities
Prof. Saša Žiković, PhD
Vice Dean for Science and International Strategic Partnerships
Faculty of Economics and Business Rijeka, Croatia
2.
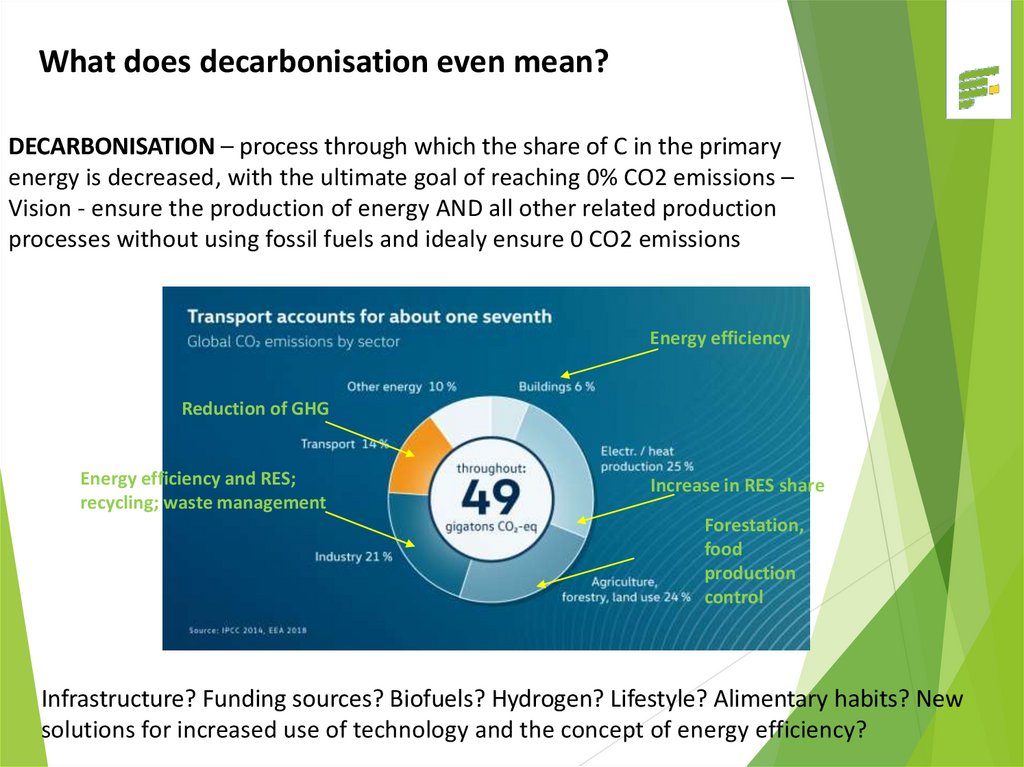
What does decarbonisation even mean?DECARBONISATION – process through which the share of C in the primary
energy is decreased, with the ultimate goal of reaching 0% CO2 emissions –
Vision - ensure the production of energy AND all other related production
processes without using fossil fuels and idealy ensure 0 CO2 emissions
Energy efficiency
Reduction of GHG
Energy efficiency and RES;
recycling; waste management
Increase in RES share
Forestation,
food
production
control
Infrastructure? Funding sources? Biofuels? Hydrogen? Lifestyle? Alimentary habits? New
solutions for increased use of technology and the concept of energy efficiency?
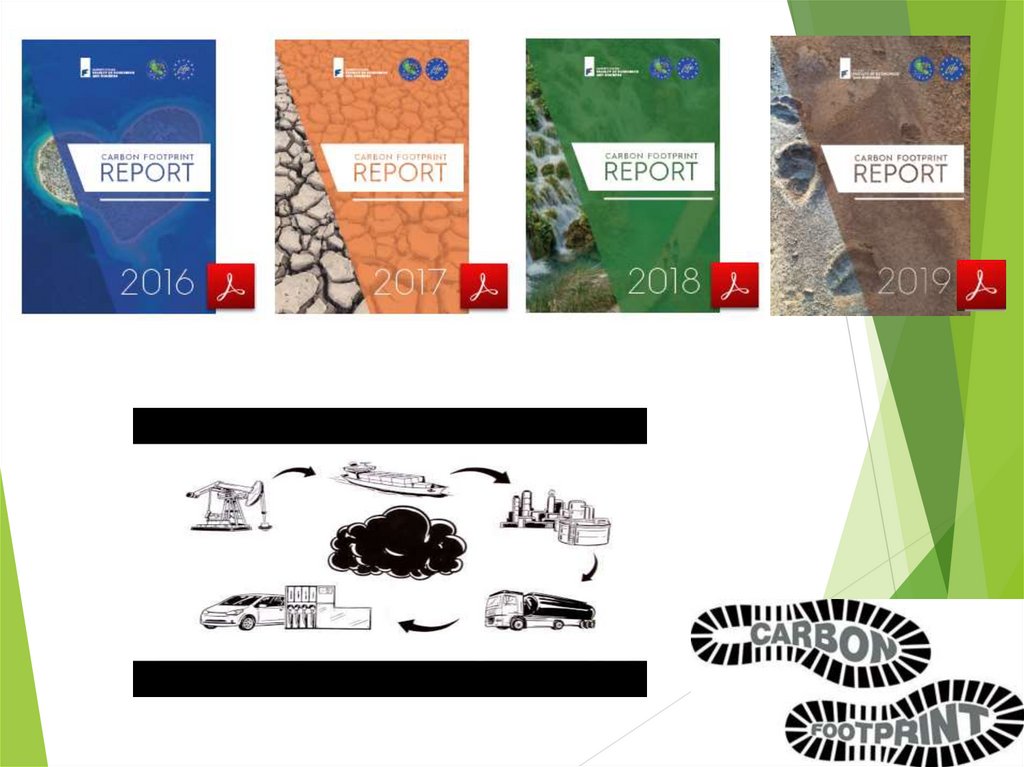
3. EFRI and LIFE Clim´Foot project: Climate Governance: Implementing public policies to calculate and reduce organisations'
EFRI and LIFE Clim´Foot project:Climate Governance:
Implementing public policies to calculate and
reduce organisations' carbon footprint
4.
EFRI in the Life Clim´Footproject
Initiative: To manage the organizational effects
related to CO2
Objectives: using the Bilan Carbon model to:
-
determine our CO2 emissions,
-
analyse them,
-
manage them in the long term!
5.
6.
7.
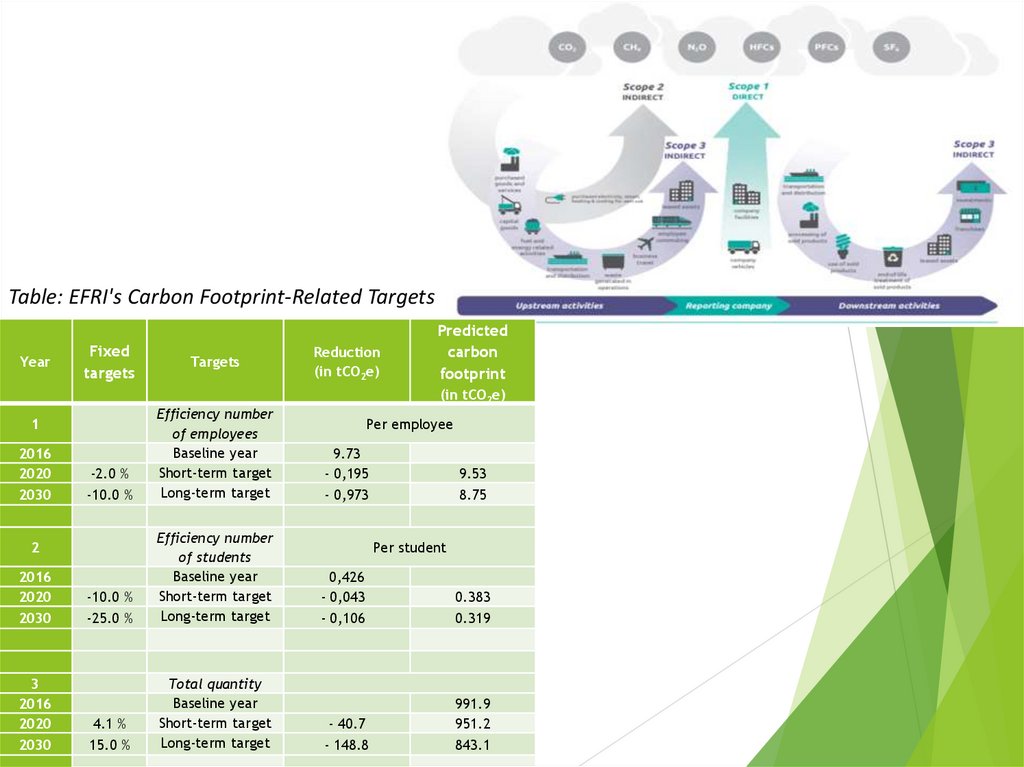
Table: EFRI's Carbon Footprint-Related TargetsYear
Fixed
targets
Targets
Reduction
(in tCO2e)
Predicted
carbon
footprint
(in tCO2e)
-2.0 %
-10.0 %
Efficiency number
of employees
Baseline year
Short-term target
Long-term target
-10.0 %
-25.0 %
Efficiency number
of students
Baseline year
Short-term target
Long-term target
0,426
- 0,043
- 0,106
0.383
0.319
4.1 %
15.0 %
Total quantity
Baseline year
Short-term target
Long-term target
- 40.7
- 148.8
991.9
951.2
843.1
1
2016
2020
2030
2
2016
2020
2030
3
2016
2020
2030
Per employee
9.73
- 0,195
- 0,973
9.53
8.75
Per student
8.
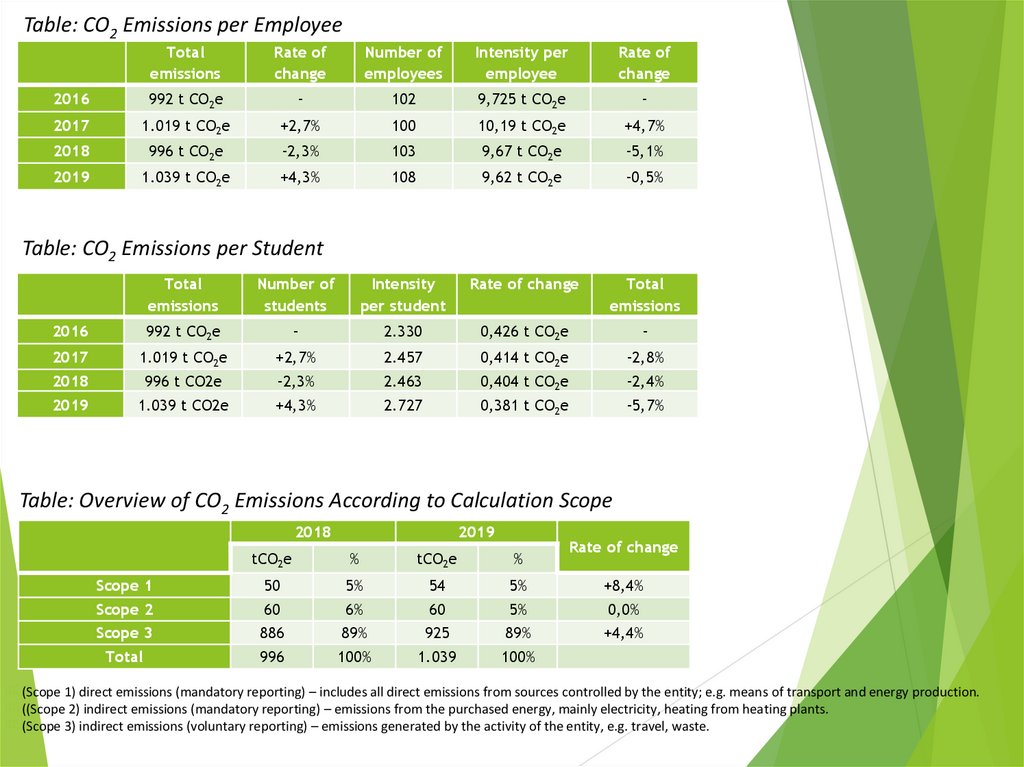
Table: CO2 Emissions per EmployeeTotal
emissions
Rate of
change
Number of
employees
Intensity per
employee
Rate of
change
2016
992 t CO2e
-
102
9,725 t CO2e
-
2017
1.019 t CO2e
+2,7%
100
10,19 t CO2e
+4,7%
2018
996 t CO2e
-2,3%
103
9,67 t CO2e
-5,1%
2019
1.039 t CO2e
+4,3%
108
9,62 t CO2e
-0,5%
Table: CO2 Emissions per Student
Total
emissions
Number of
students
Intensity
per student
Rate of change
Total
emissions
2016
992 t CO2e
-
2.330
0,426 t CO2e
-
2017
1.019 t CO2e
+2,7%
2.457
0,414 t CO2e
-2,8%
2018
996 t CO2e
-2,3%
2.463
0,404 t CO2e
-2,4%
2019
1.039 t CO2e
+4,3%
2.727
0,381 t CO2e
-5,7%
Table: Overview of CO2 Emissions According to Calculation Scope
2018
[1]
2019
Rate of change
tCO2e
%
tCO2e
%
Scope 1
50
5%
54
5%
+8,4%
Scope 2
Scope 3
60
886
6%
89%
60
925
5%
89%
0,0%
+4,4%
Total
996
100%
1.039
100%
(Scope 1) direct emissions (mandatory reporting) – includes all direct emissions from sources controlled by the entity; e.g. means of transport and energy production.
((Scope 2) indirect emissions (mandatory reporting) – emissions from the purchased energy, mainly electricity, heating from heating plants.
[3] (Scope 3) indirect emissions (voluntary reporting) – emissions generated by the activity of the entity, e.g. travel, waste.
[2]
9.
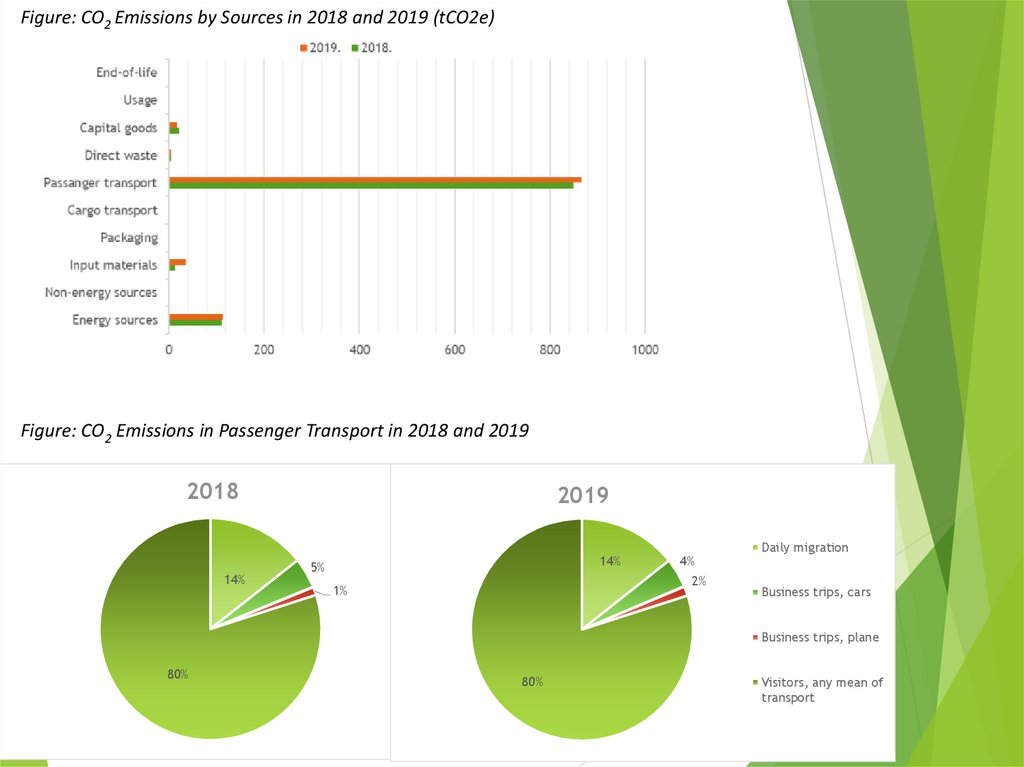
Figure: CO2 Emissions by Sources in 2018 and 2019 (tCO2e)Figure: CO2 Emissions in Passenger Transport in 2018 and 2019
2018
14%
2019
14%
5%
1%
4%
2%
Dnevna migracija
Daily migration
Business trips, cars
Poslovna putovanja, auto
Poslovna putovanja, zrakoplov
80%
Posjetitelji, bilo koji način
80%
Business trips, plane
Visitors, any mean of
transport
10.
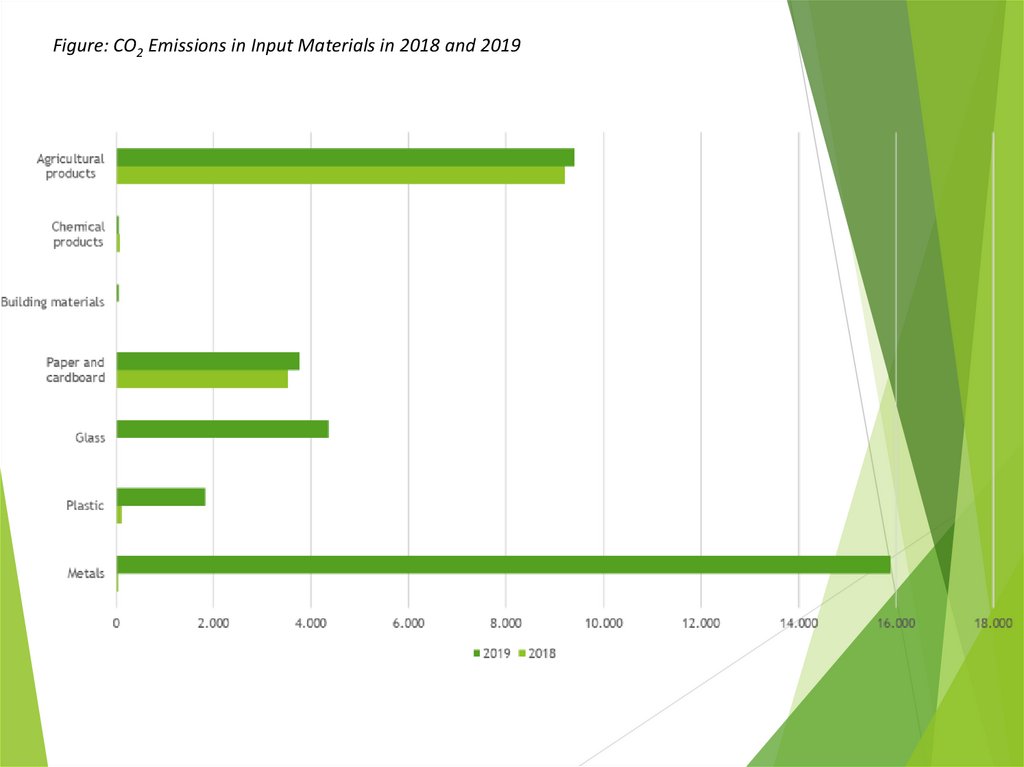
Figure: CO2 Emissions in Input Materials in 2018 and 201911.
Globally driven agenda towards reinventing the logic of globaleconomy and nature of capitalism in line with „sustainable” and
„green” economical concepts
A definite game changer BUT again G10 countries are well
positioned to reap the benefits of the new game rules, cement
the current state of division between them and the developing
Carbon tax is around the corner - dual purpose - a de facto
custom duty protecting the most developed countries
G10 still control the opinion through their institutions and soft
power - especially visible in academia
All of us look up to US/UK universities as our benchmarks and
crave to end up high on lists such as THE and QS
The path for the foreseeable future is set and clear - „green”
and „sustainable” revolution will continue
– huge opportunity for Universities to reestablish
themselves as key facilitators of this change – 1st movers
will brand themselves & reap the biggest rewards