


 Программирование
Похожие презентации:


")


Dimensionality Reduction
1.
• Dimensionality Reduction2.
Dimensionality ReductionOur data can have thousands or millions of features
Our model can have some problems with the data which has huge
number of features:
Training process can be very slow,
Harder to find a good solution (sometimes)
Unrelated features can exist in our data ( Lets look an example for this
on Mnist data)
3.
Dimensionality ReductionMnist data: small images of handwritten digits
4.
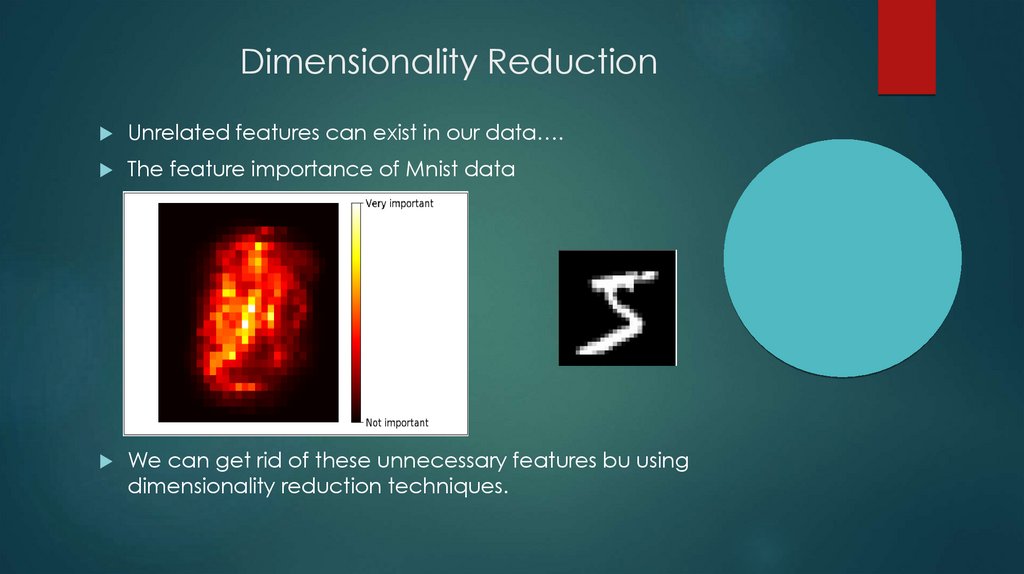
Dimensionality ReductionUnrelated features can exist in our data….
The feature importance of Mnist data
We can get rid of these unnecessary features bu using
dimensionality reduction techniques.
5.
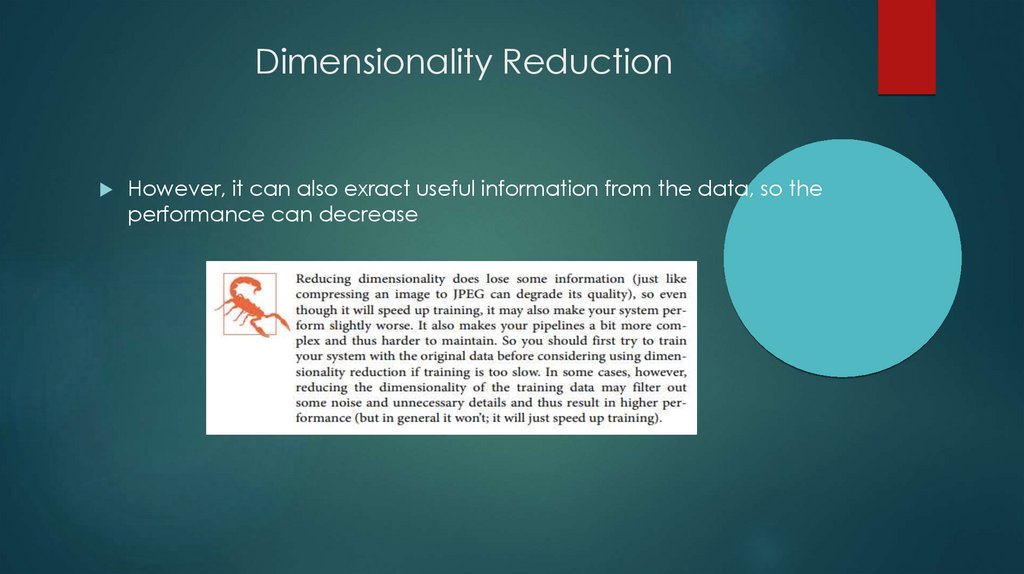
Dimensionality ReductionHowever, it can also exract useful information from the data, so the
performance can decrease
6.
Dimensionality ReductionThe most famous dimension reduction algorithm is Principal
Component Analysis (PCA).
We will look for PCA, but first introduce you the concept of
covariance (and correlation).
Because, we will use the covariance term many times in PCA.
7.
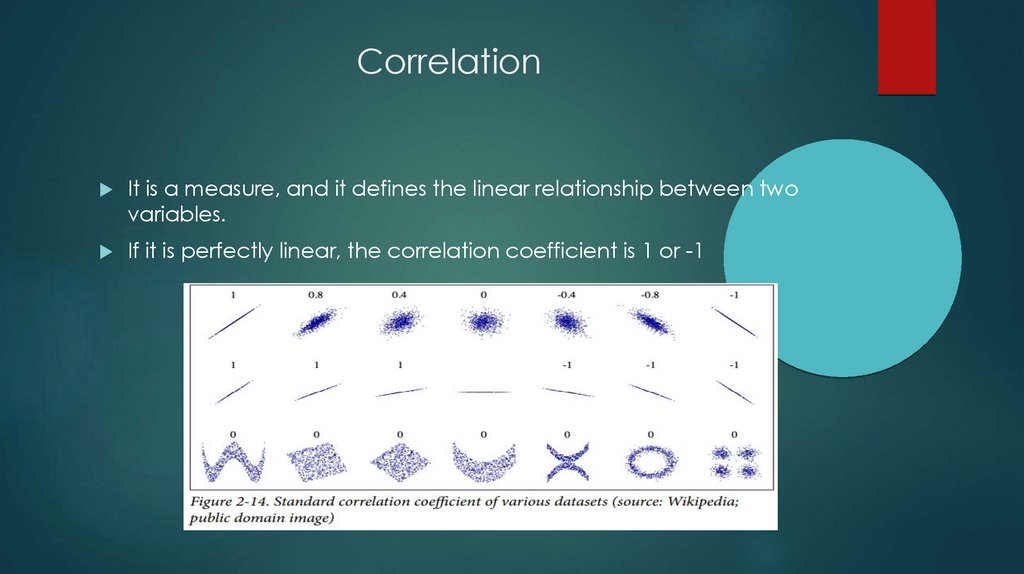
CorrelationIt is a measure, and it defines the linear relationship between two
variables.
If it is perfectly linear, the correlation coefficient is 1 or -1
8.
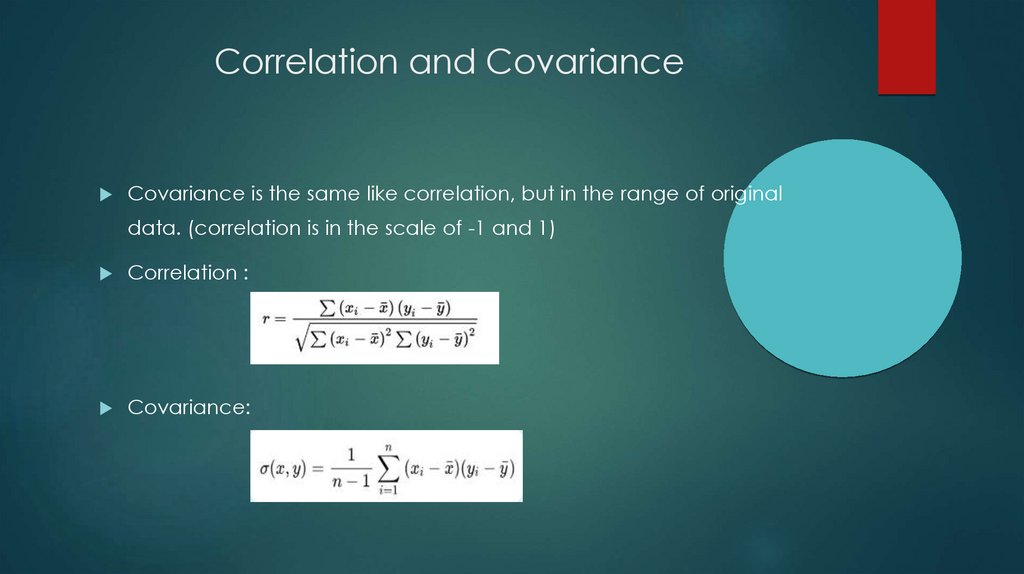
Correlation and CovarianceCovariance is the same like correlation, but in the range of original
data. (correlation is in the scale of -1 and 1)
Correlation :
Covariance:
9.
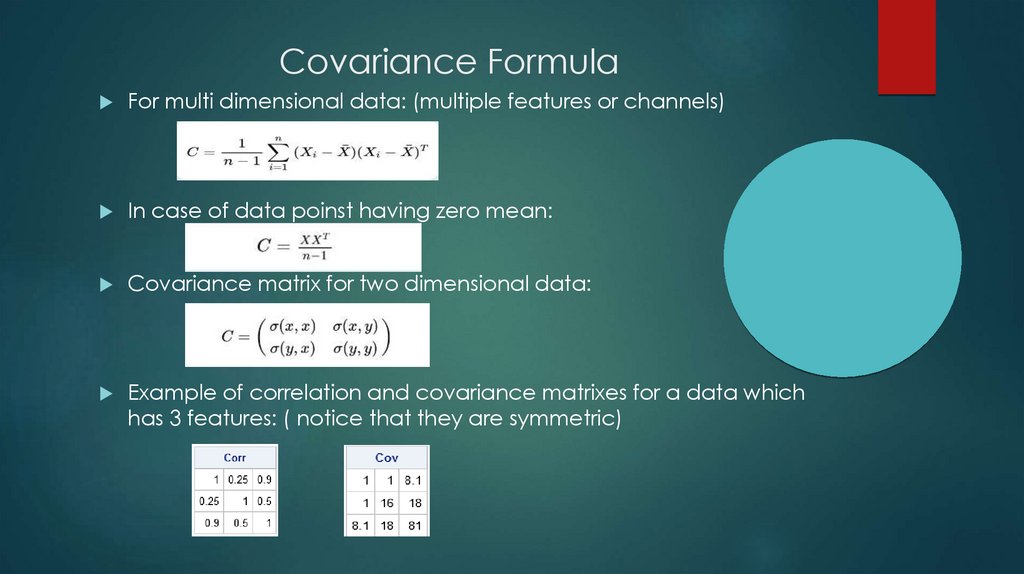
Covariance FormulaFor multi dimensional data: (multiple features or channels)
In case of data poinst having zero mean:
Covariance matrix for two dimensional data:
Example of correlation and covariance matrixes for a data which
has 3 features: ( notice that they are symmetric)
10.
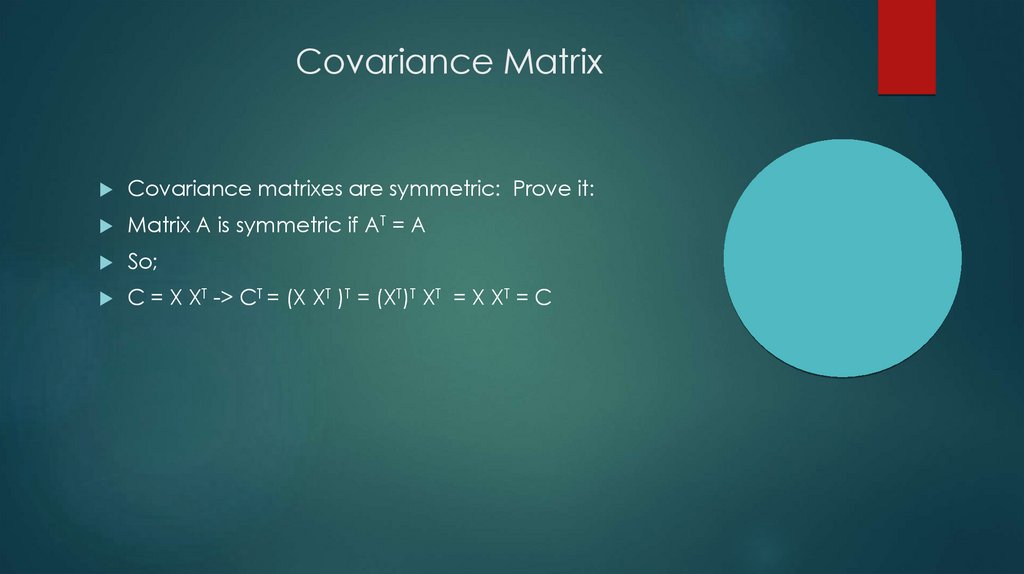
Covariance MatrixCovariance matrixes are symmetric: Prove it:
Matrix A is symmetric if AT = A
So;
C = X XT -> CT = (X XT )T = (XT)T XT = X XT = C
11.
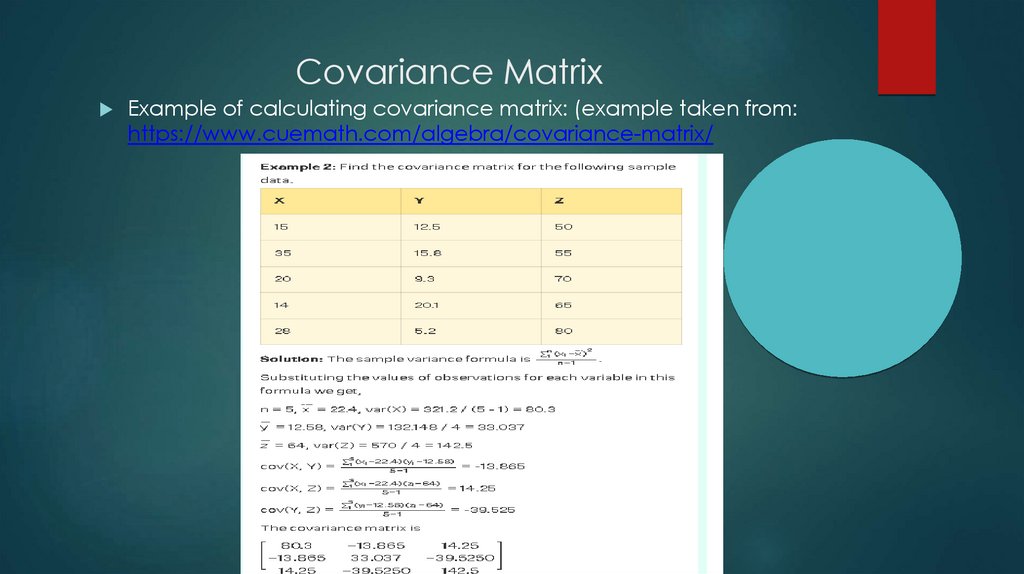
Covariance MatrixExample of calculating covariance matrix: (example taken from:
https://www.cuemath.com/algebra/covariance-matrix/
12.
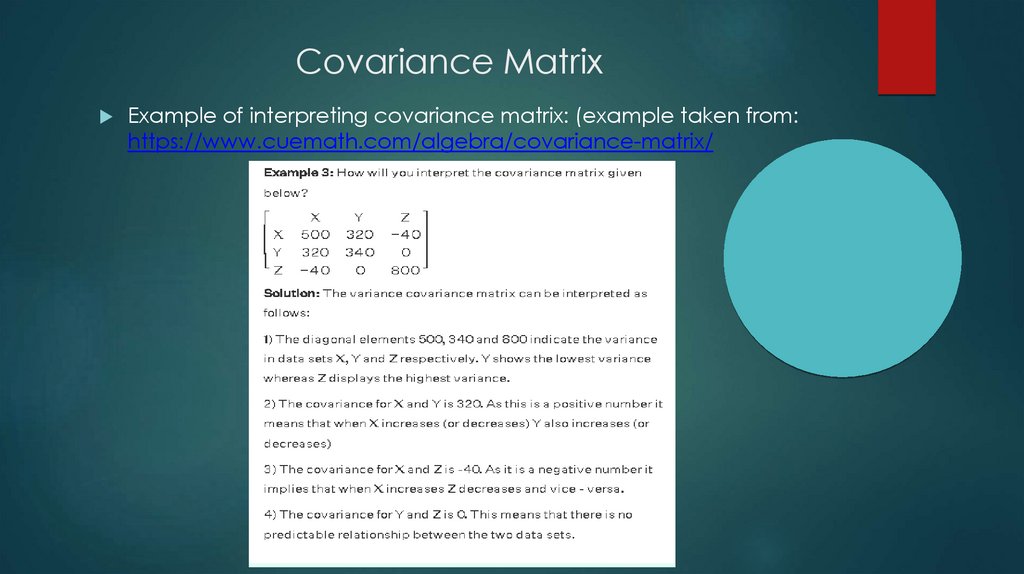
Covariance MatrixExample of interpreting covariance matrix: (example taken from:
https://www.cuemath.com/algebra/covariance-matrix/
13.
Covariance MatrixVisualization of covariance matrices
No problem with lower dimensional data:
But it is not feasible to look all numbers for high dimensional data. So
we can convert matrix values to colors, so that we can visualize and
interpret covariance matrix better.
14.
Python15.
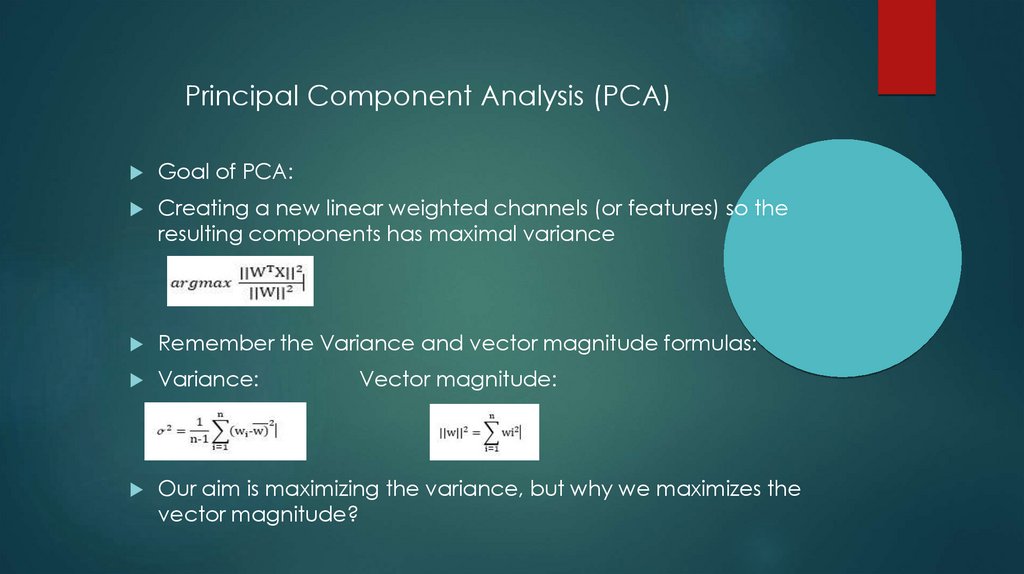
Principal Component Analysis (PCA)Goal of PCA:
Creating a new linear weighted channels (or features) so the
resulting components has maximal variance
Remember the Variance and vector magnitude formulas:
Variance:
Our aim is maximizing the variance, but why we maximizes the
vector magnitude?
Vector magnitude:
16.
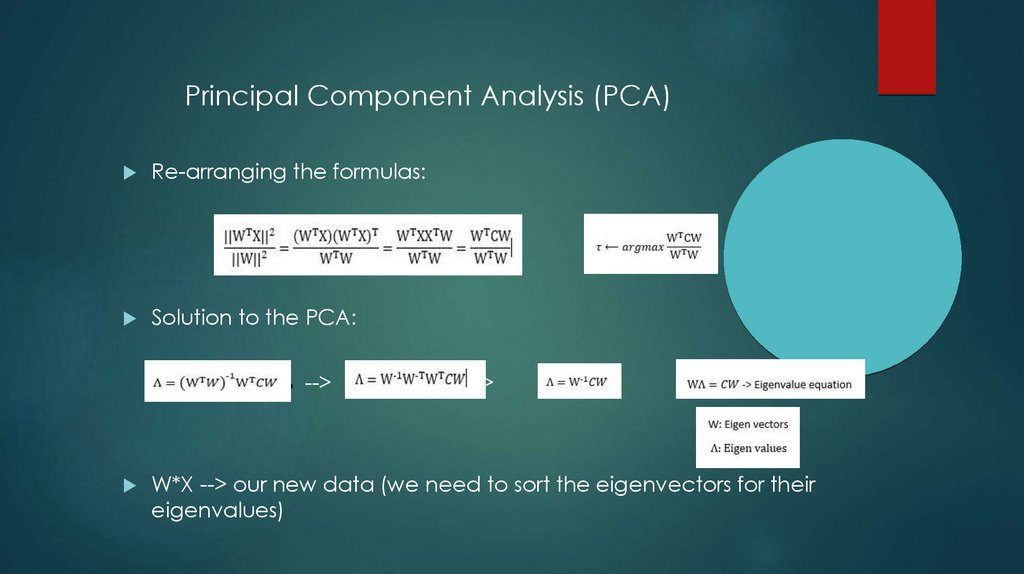
Principal Component Analysis (PCA)Re-arranging the formulas:
Solution to the PCA:
-->
-->
-->
W*X --> our new data (we need to sort the eigenvectors for their
eigenvalues)
17.
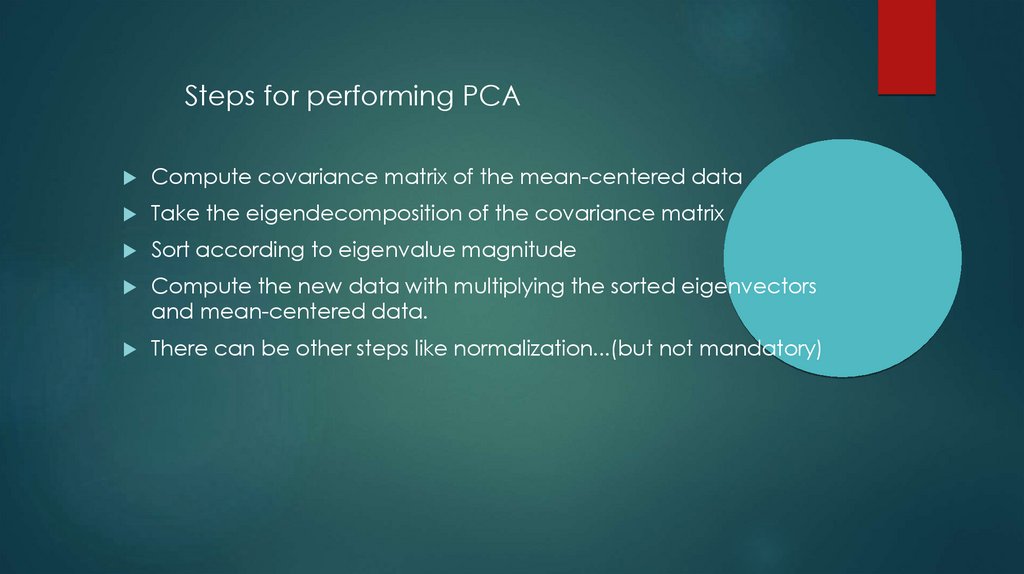
Steps for performing PCACompute covariance matrix of the mean-centered data
Take the eigendecomposition of the covariance matrix
Sort according to eigenvalue magnitude
Compute the new data with multiplying the sorted eigenvectors
and mean-centered data.
There can be other steps like normalization...(but not mandatory)
18.
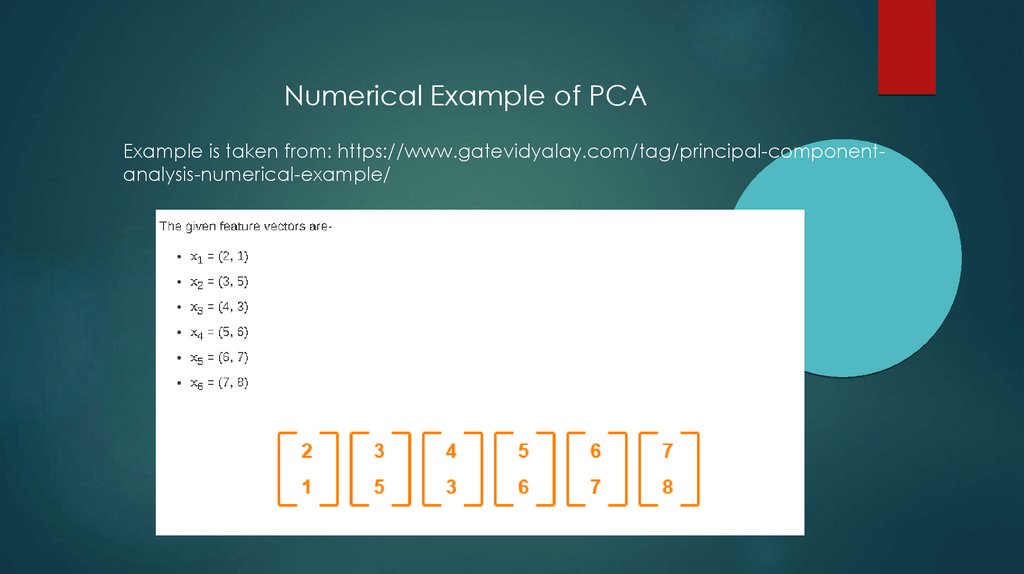
Numerical Example of PCAExample is taken from: https://www.gatevidyalay.com/tag/principal-componentanalysis-numerical-example/
19.
Numerical Example of PCAStep 1:
20.
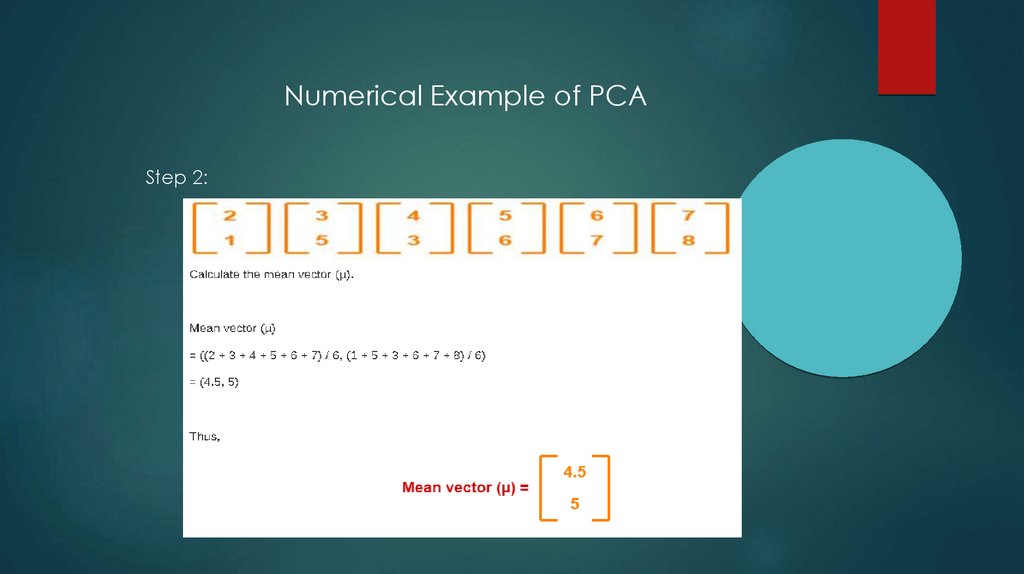
Numerical Example of PCAStep 2:
21.
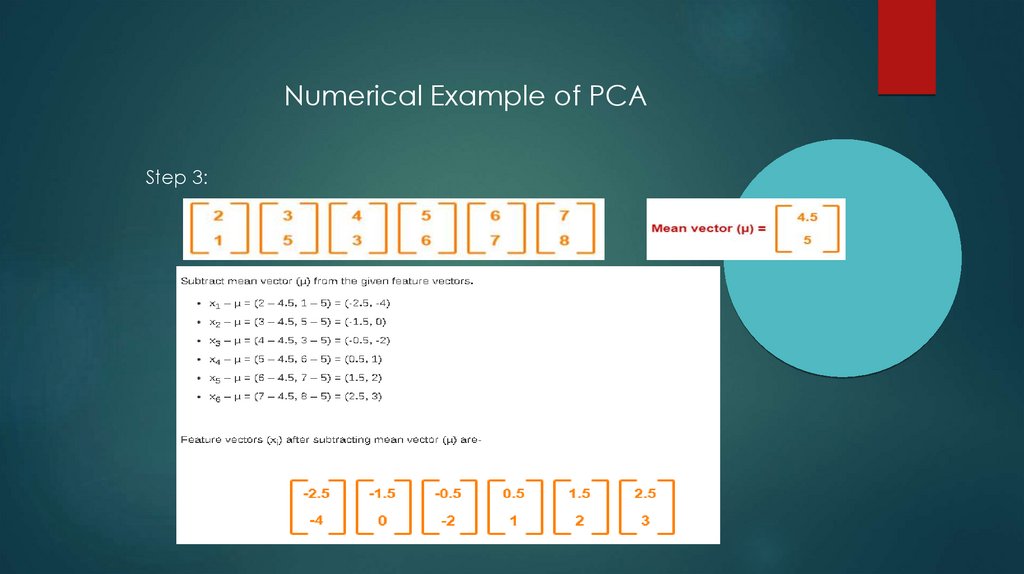
Numerical Example of PCAStep 3:
22.
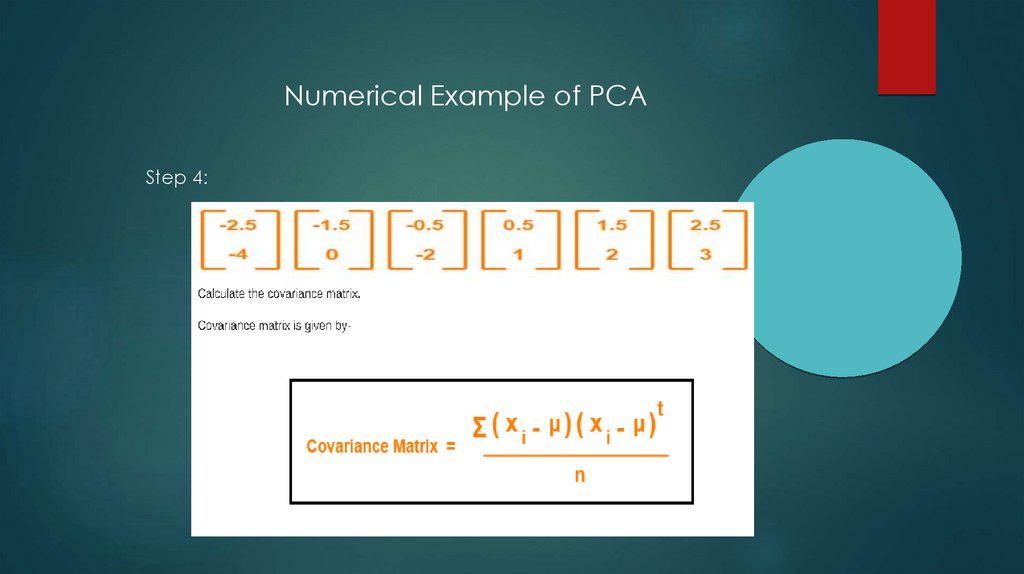
Numerical Example of PCAStep 4:
23.
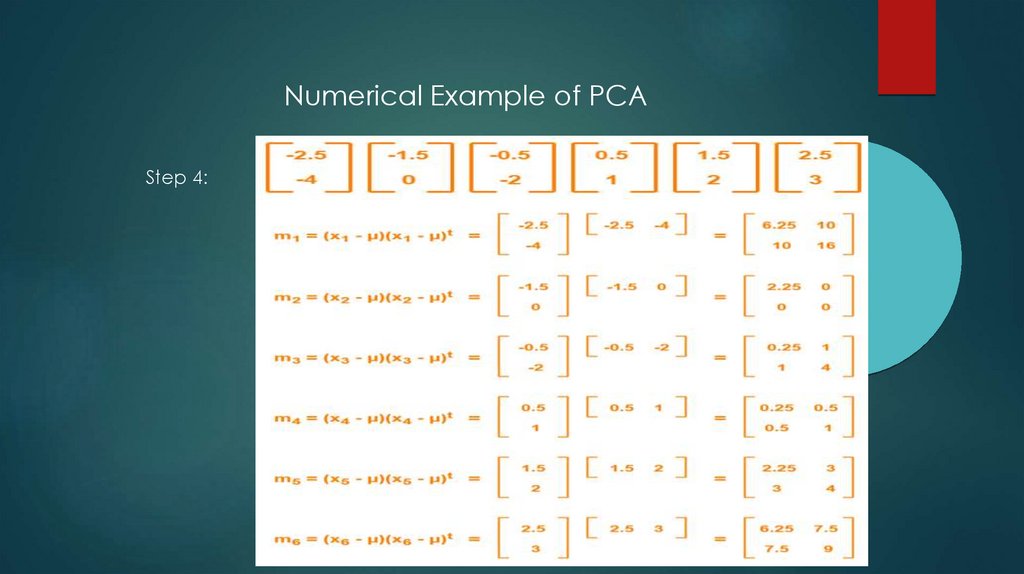
Numerical Example of PCAStep 4:
24.
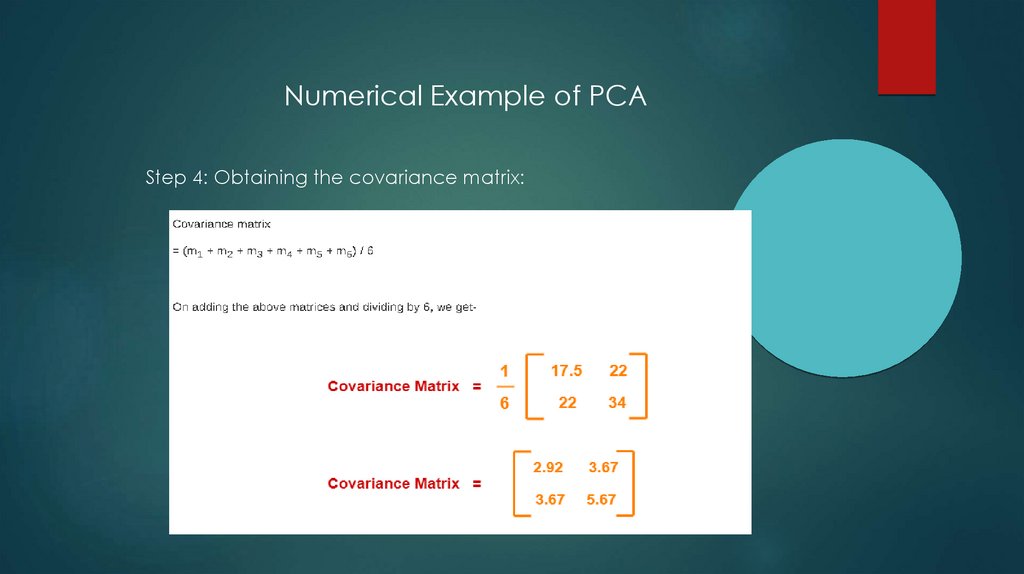
Numerical Example of PCAStep 4: Obtaining the covariance matrix:
25.
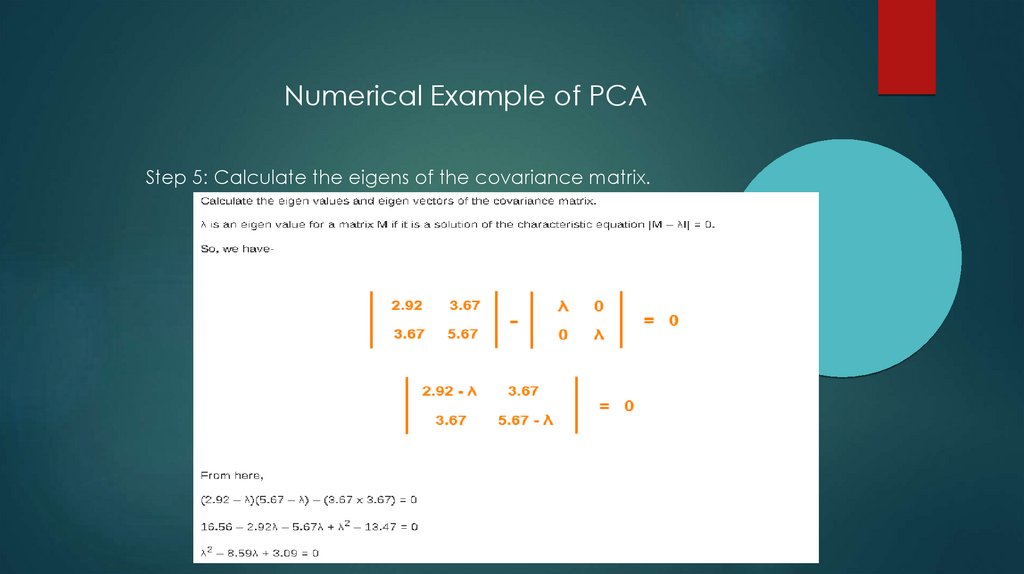
Numerical Example of PCAStep 5: Calculate the eigens of the covariance matrix.
26.
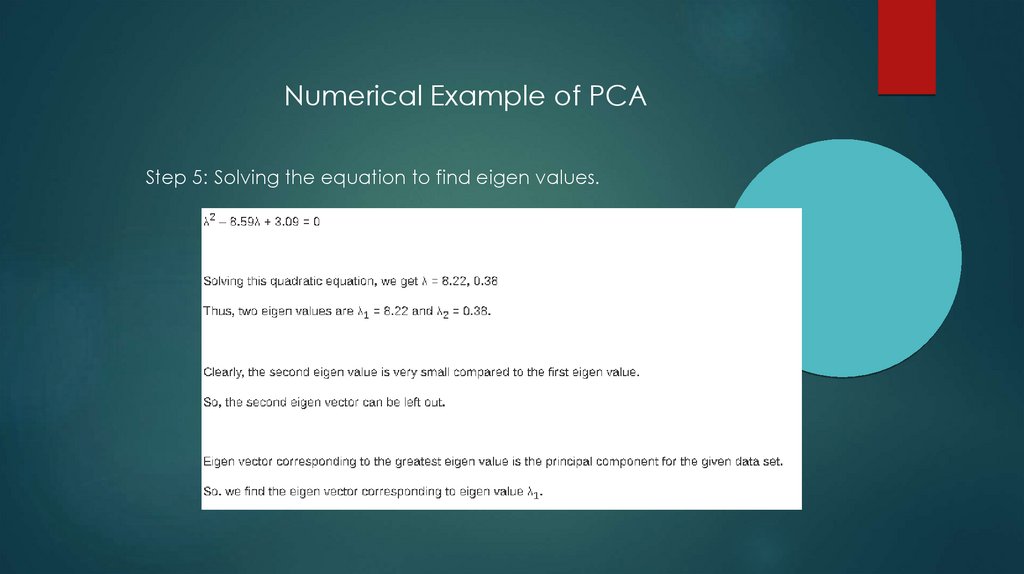
Numerical Example of PCAStep 5: Solving the equation to find eigen values.
27.
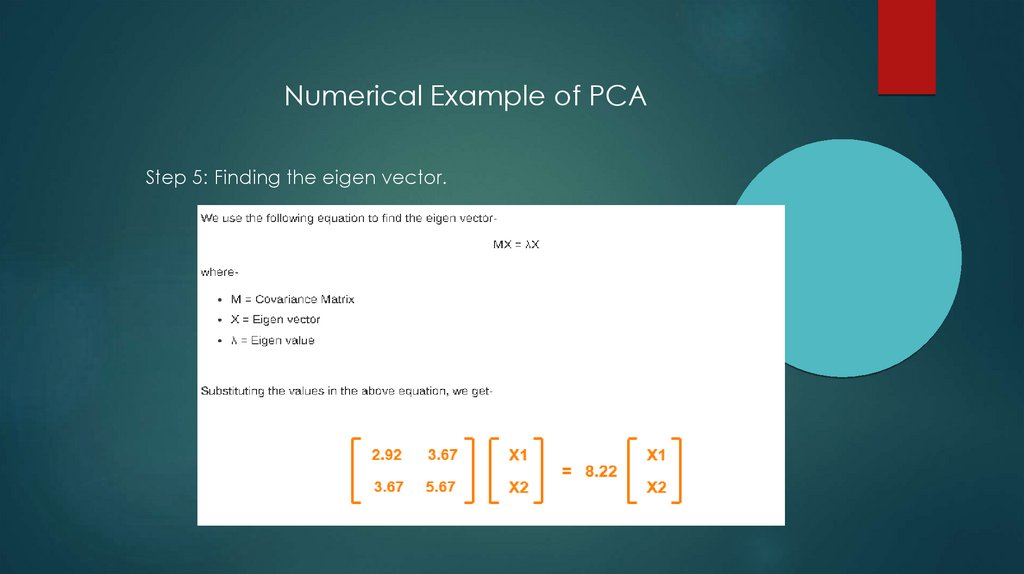
Numerical Example of PCAStep 5: Finding the eigen vector.
28.
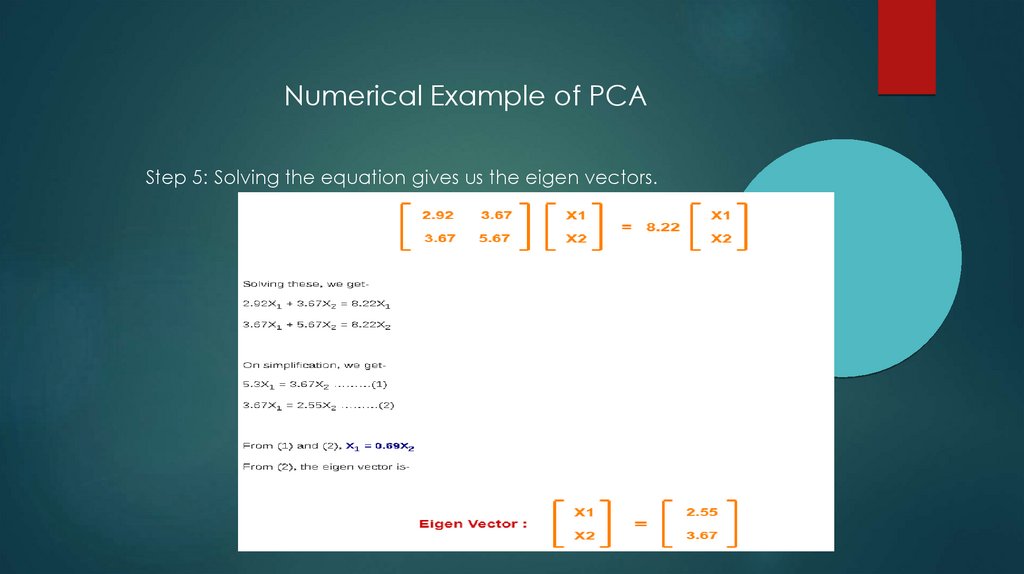
Numerical Example of PCAStep 5: Solving the equation gives us the eigen vectors.
29.
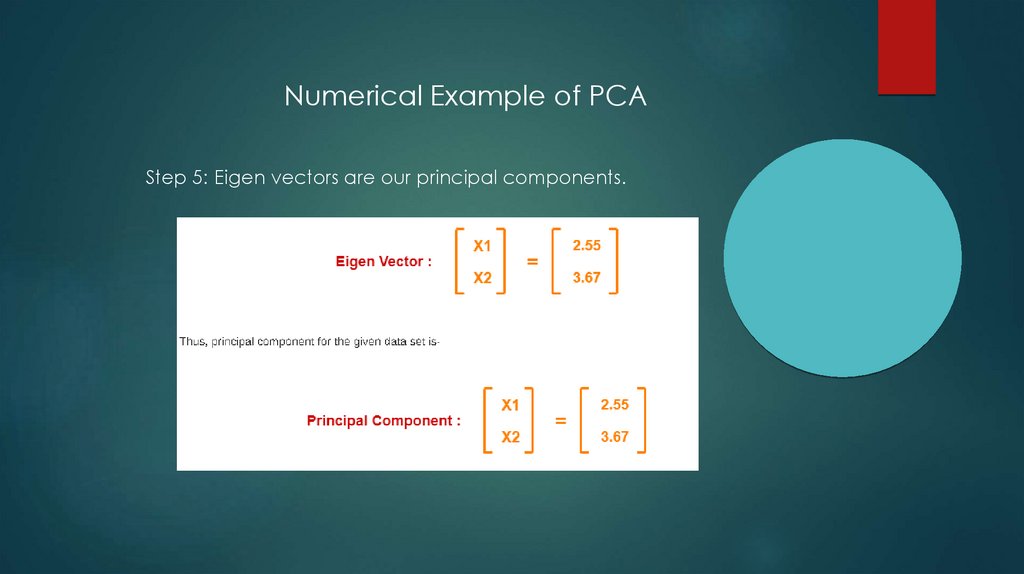
Numerical Example of PCAStep 5: Eigen vectors are our principal components.
30.
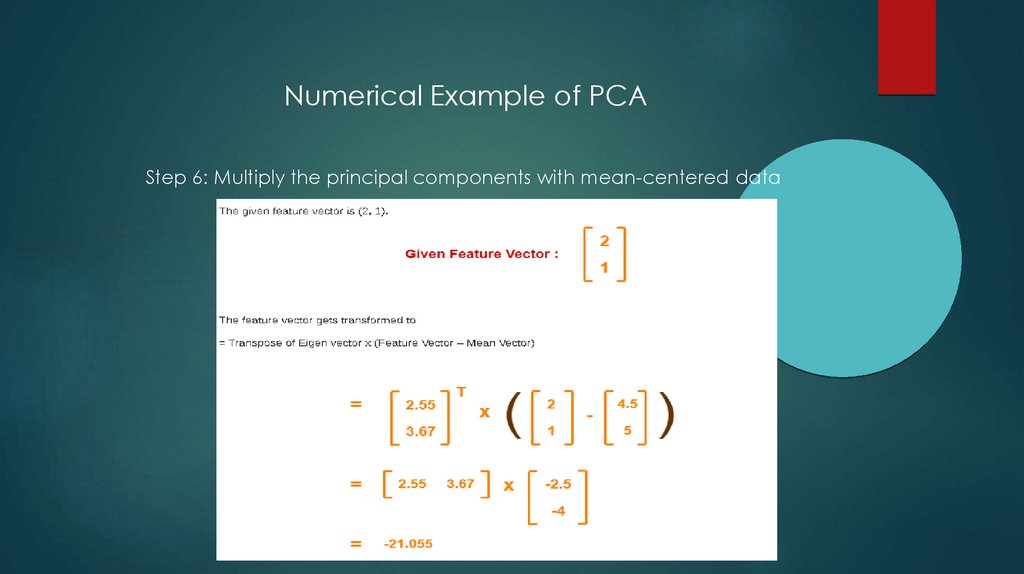
Numerical Example of PCAStep 6: Multiply the principal components with mean-centered data
31.
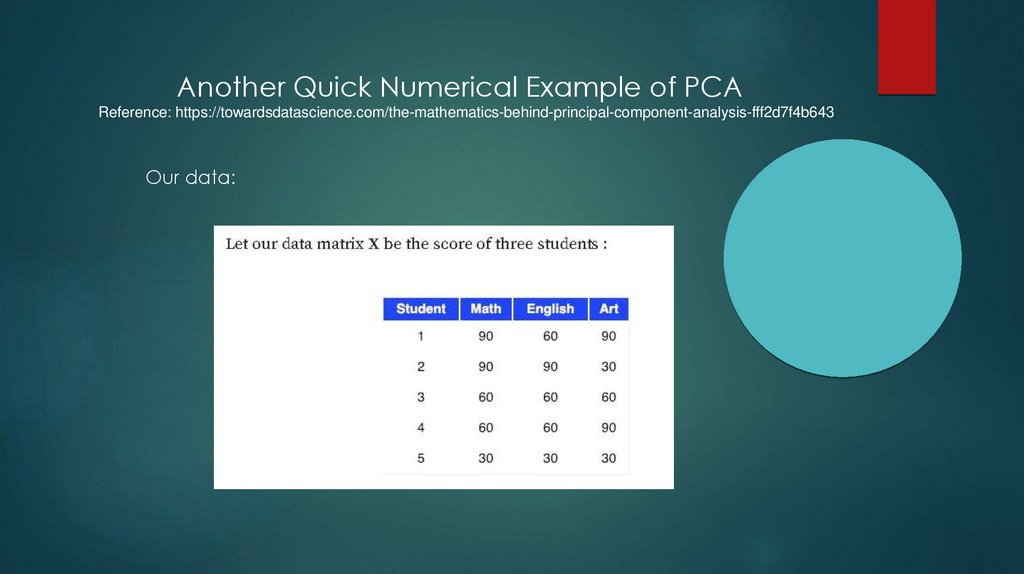
Another Quick Numerical Example of PCAReference: https://towardsdatascience.com/the-mathematics-behind-principal-component-analysis-fff2d7f4b643
Our data:
32.
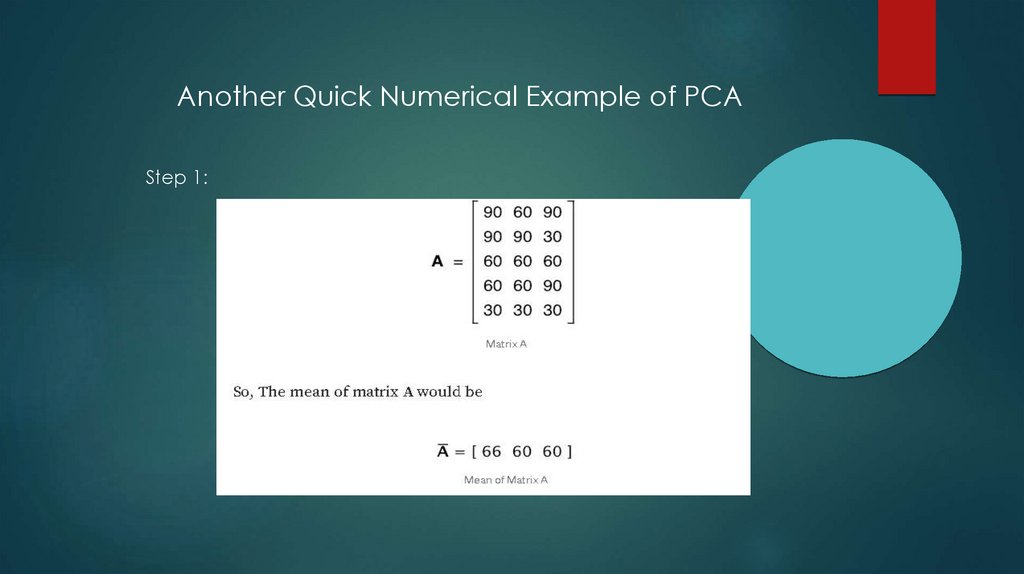
Another Quick Numerical Example of PCAStep 1:
33.
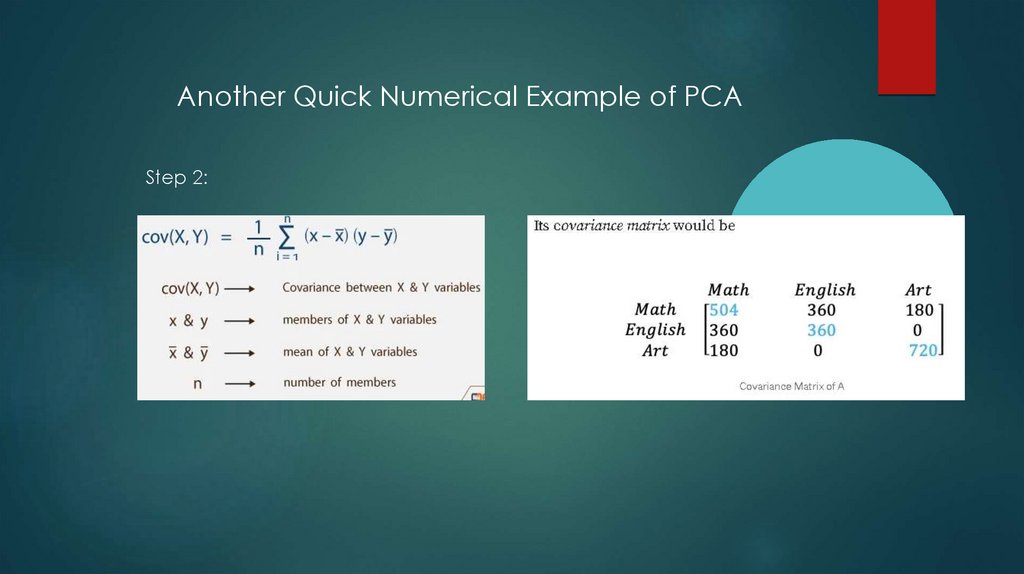
Another Quick Numerical Example of PCAStep 2:
34.
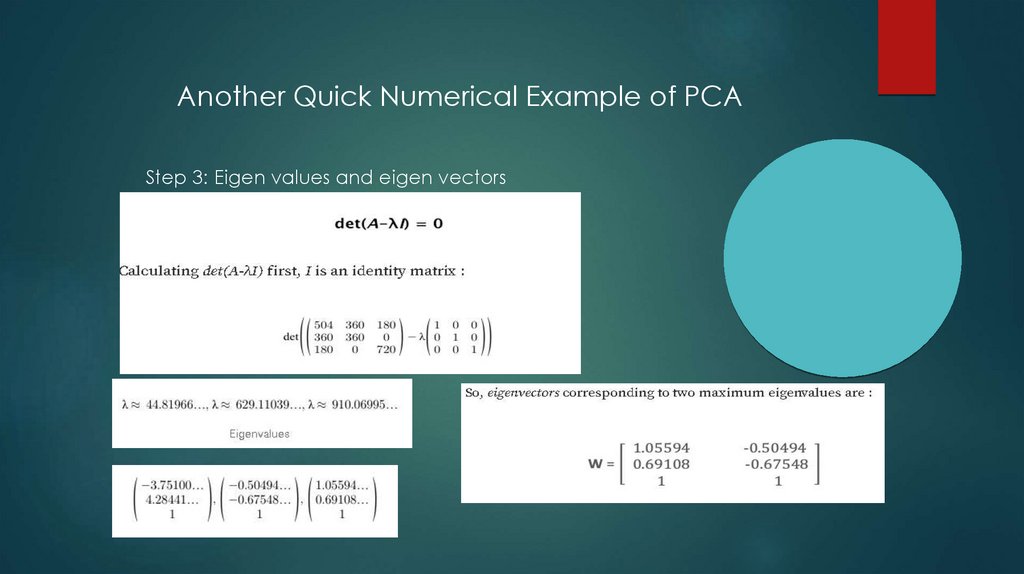
Another Quick Numerical Example of PCAStep 3: Eigen values and eigen vectors
35.
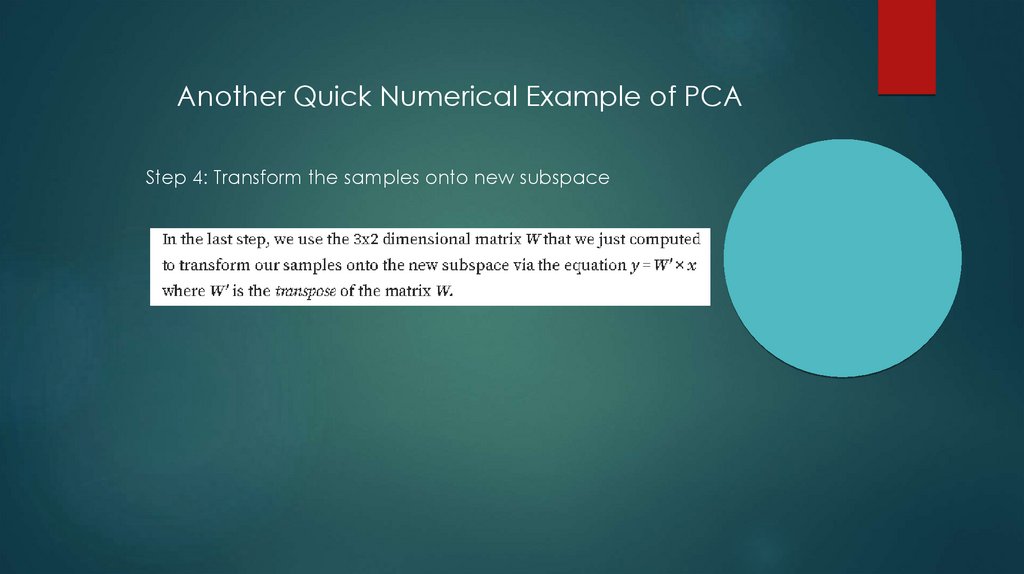
Another Quick Numerical Example of PCAStep 4: Transform the samples onto new subspace
36.
Other TechniquesPCA --> linear
Non-linear techniques: Kernel-PCA, Autoencoder
37.
ReferencesGeÌ
ron, A. (2019). Hands-on machine learning with ScikitLearn, Keras and TensorFlow: concepts, tools, and techniques to buil
d intelligent systems (2nd ed.). O’Reilly.
https://www.cuemath.com/algebra/covariance-matrix/
https://blogs.sas.com/content/iml/2012/02/17/convert-acovariance-matrix-to-a-correlation-matrix-in-sas.html
Cohen, Michael X.. “A tutorial on generalized eigendecomposition
for denoising, contrast enhancement, and dimension reduction in
multichannel electrophysiology.” NeuroImage 247(2022): n. pag.
Udemy course: PCA & multivariate signal processing, applied to
neural data by Michael X. Cohen