


 Образование
Похожие презентации:
")


Эссе на основе графиков на высший балл
1.
Эссена основе графиков
на высший балл
2024
2.
Part 2Абзацы 1-3:
- Необходимая лексика
- Примеры абзацев
- Варианты написания
3.
1 абзац4.
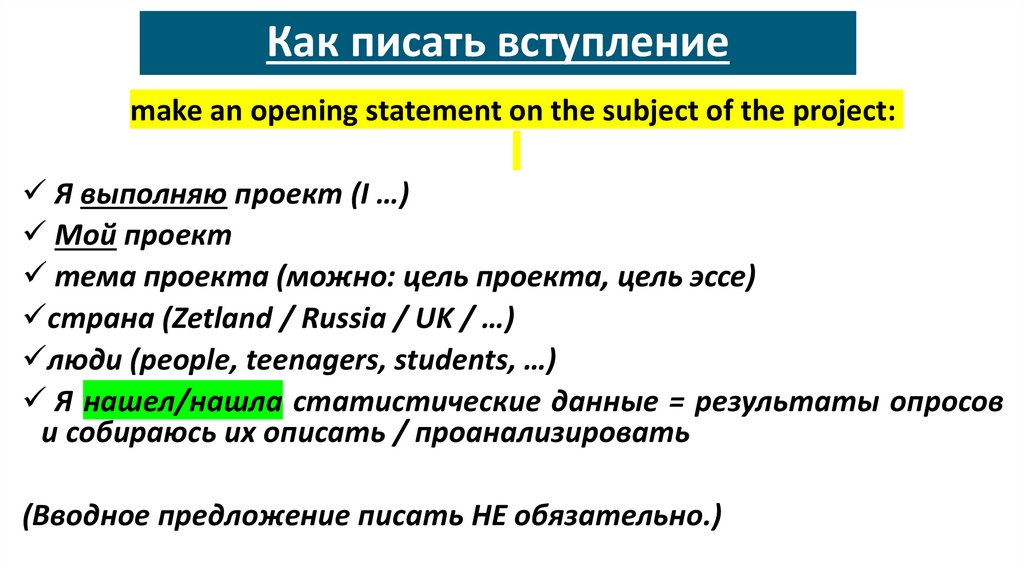
Как писать вступлениеmake an opening statement on the subject of the project:
Я выполняю проект (I …)
Мой проект
тема проекта (можно: цель проекта, цель эссе)
страна (Zetland / Russia / UK / …)
люди (people, teenagers, students, …)
Я нашел/нашла статистические данные = результаты опросов
и собираюсь их описать / проанализировать
(Вводное предложение писать НЕ обязательно.)
5.
Как писать вступление: 1 способСамый простой: начать с цели проекта
The aim of my project is to find out / examine … + тема проекта
из задания
My project aims to find out / examine … + тема проекта из
задания
My project is aimed at examining … + тема проекта из задания
6.
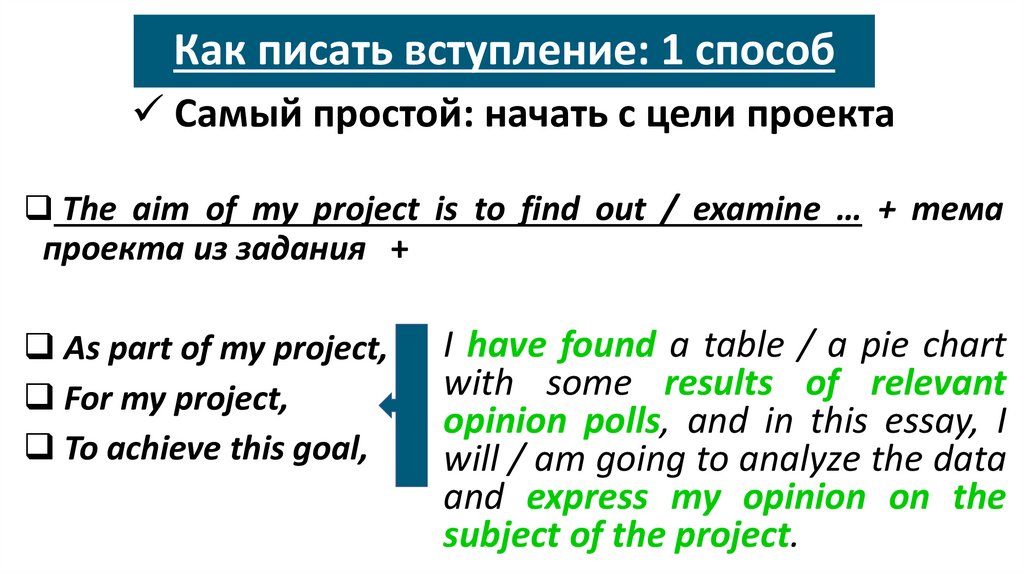
Как писать вступление: 1 способСамый простой: начать с цели проекта
The aim of my project is to find out / examine … + тема
проекта из задания +
As part of my project,
For my project,
To achieve this goal,
I have found a table / a pie chart
with some results of relevant
opinion polls, and in this essay, I
will / am going to analyze the data
and express my opinion on the
subject of the project.
7.
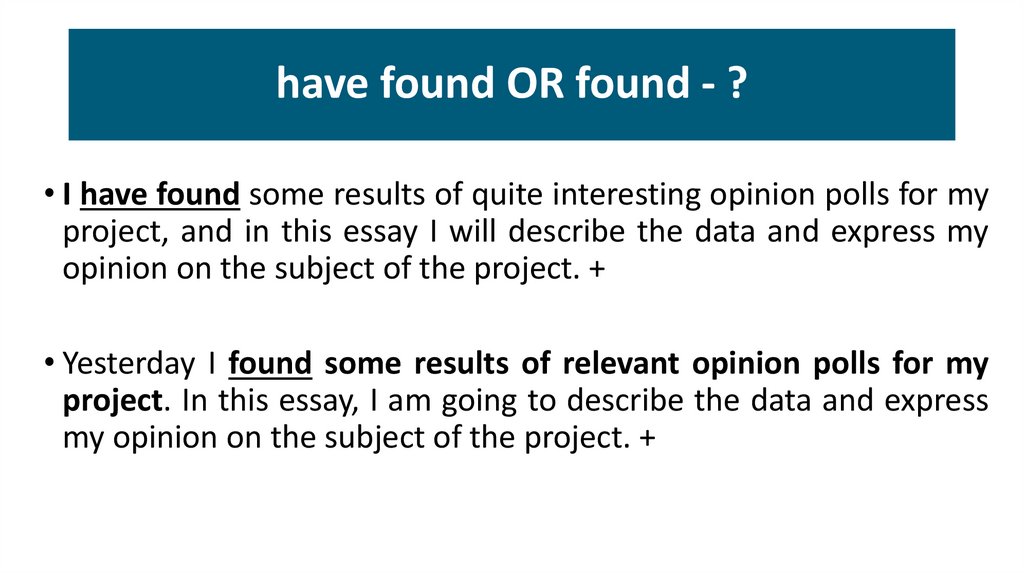
have found OR found - ?• I have found some results of quite interesting opinion polls for my
project, and in this essay I will describe the data and express my
opinion on the subject of the project. +
• Yesterday I found some results of relevant opinion polls for my
project. In this essay, I am going to describe the data and express
my opinion on the subject of the project. +
8.
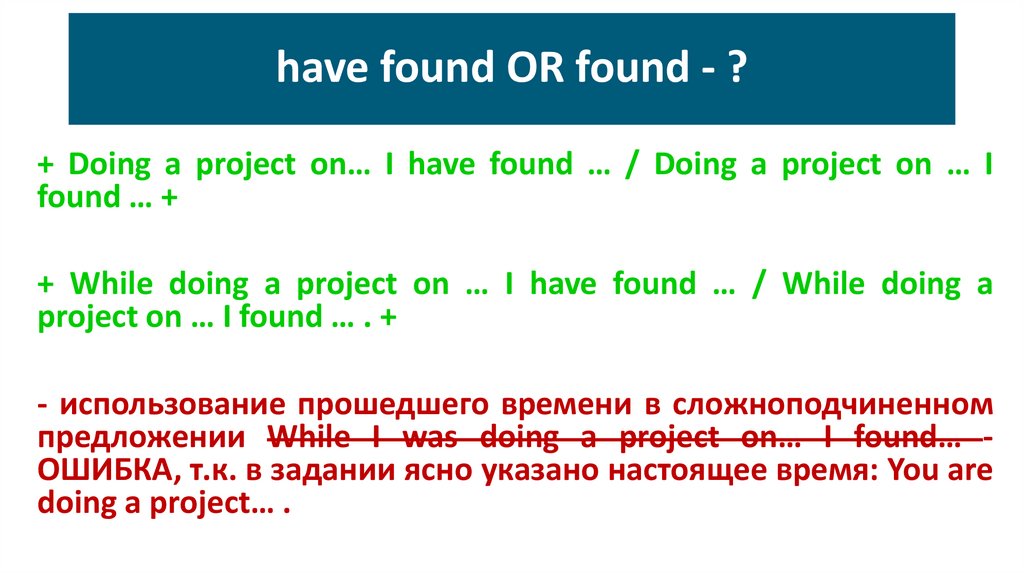
have found OR found - ?+ Doing a project on… I have found … / Doing a project on … I
found … +
+ While doing a project on … I have found … / While doing a
project on … I found … . +
- использование прошедшего времени в сложноподчиненном
предложении While I was doing a project on… I found… ОШИБКА, т.к. в задании ясно указано настоящее время: You are
doing a project… .
9.
• The aim of my project is to find out why a career in IT is very popularwith Zetland teenagers. As part of my project, I have found a table
with some results of relevant opinion polls, and in this essay, I will
analyze the data and express my opinion on the subject of the project.
10.
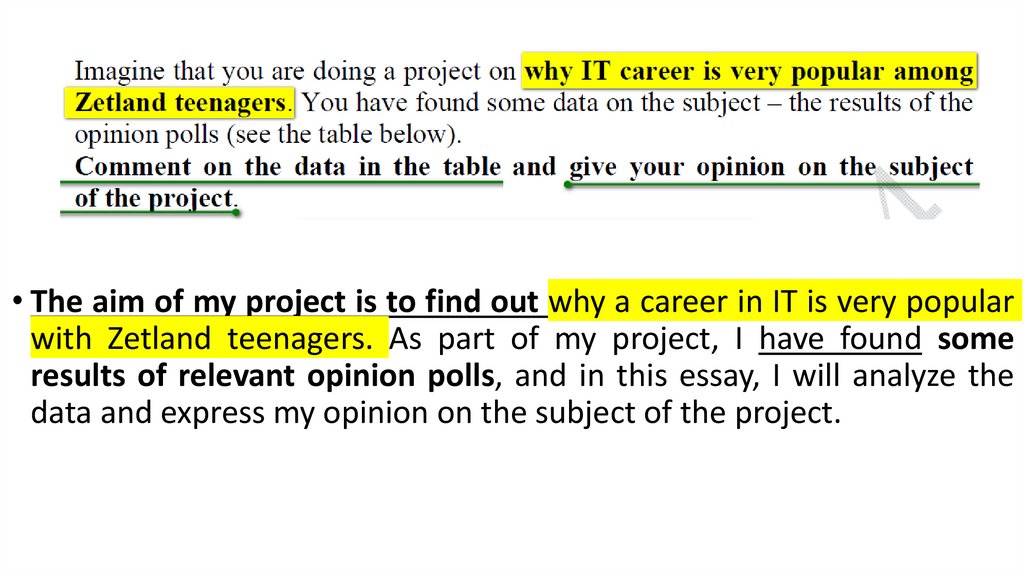
• The aim of my project is to find out why a career in IT is very popularwith Zetland teenagers. As part of my project, I have found some
results of relevant opinion polls, and in this essay, I will analyze the
data and express my opinion on the subject of the project.
11.
Формула 1-го абзаца (1):The aim of my project is to examine/find out … .
As part of my project, I have found (a table/a pie
chart with) some results of relevant opinion polls,
and
in this essay, I will analyze the data and express
my opinion on the subject of the project.
12.
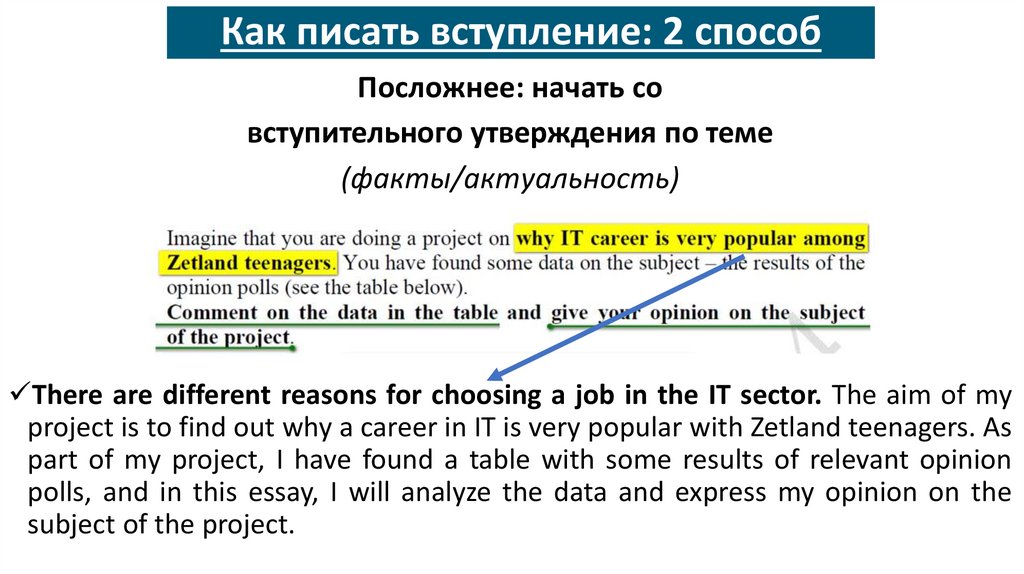
Как писать вступление: 2 способПосложнее: начать со
вступительного утверждения по теме
(факты/актуальность)
There are different reasons for choosing a job in the IT sector. The aim of my
project is to find out why a career in IT is very popular with Zetland teenagers. As
part of my project, I have found a table with some results of relevant opinion
polls, and in this essay, I will analyze the data and express my opinion on the
subject of the project.
13.
Как писать вступление: 2 способПосложнее: начать со
вступительного утверждения по теме
(факты/актуальность)
38.1 Imagine that you are doing a project on why Zetlanders consider city life very stressful. You
have found some data on the subject – the results of the opinion polls (see the table below).
There is a wide-spread belief that living in big cities causes a lot of stress. The aim of my project
is to find out why people in Zetland consider city life very stressful. For my project, I have found
some results of relevant opinion polls, and in this essay I will describe the data and express my
opinion on the subject of the project.
14.
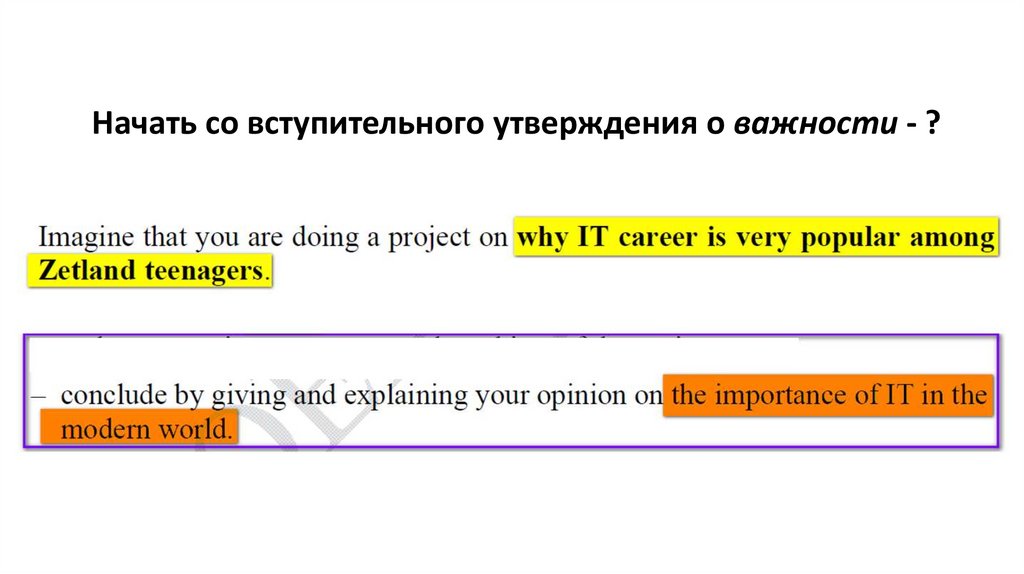
Начать со вступительного утверждения о важности - ?15.
Формула 1-го абзаца (2):Вступительное
утверждение
(факты/актуальность)
по
теме
The aim of my project is to examine/find out … .
As part of my project, I have found (a table/a pie chart
with) some results of relevant opinion polls, and
in this essay, I will analyze the data and express my
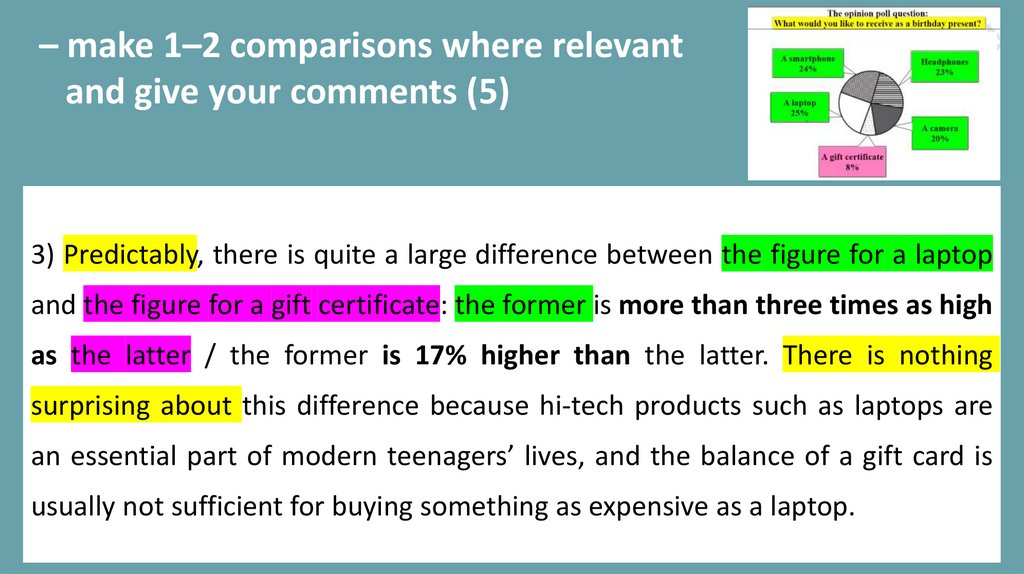
opinion on the subject of the project.
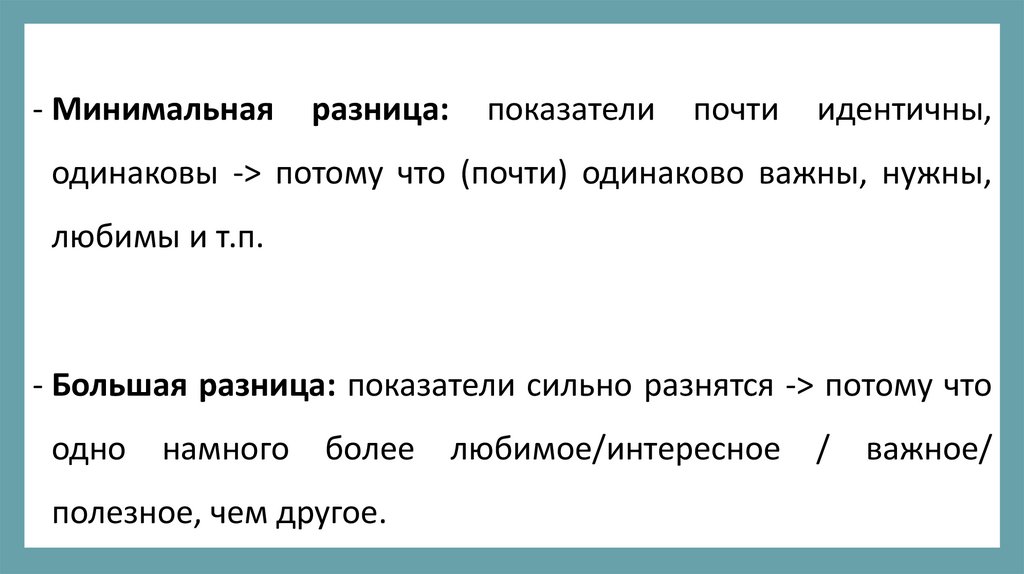
16.
Вступление (1)Why - > REASONS (for sth/-ing, why - =)
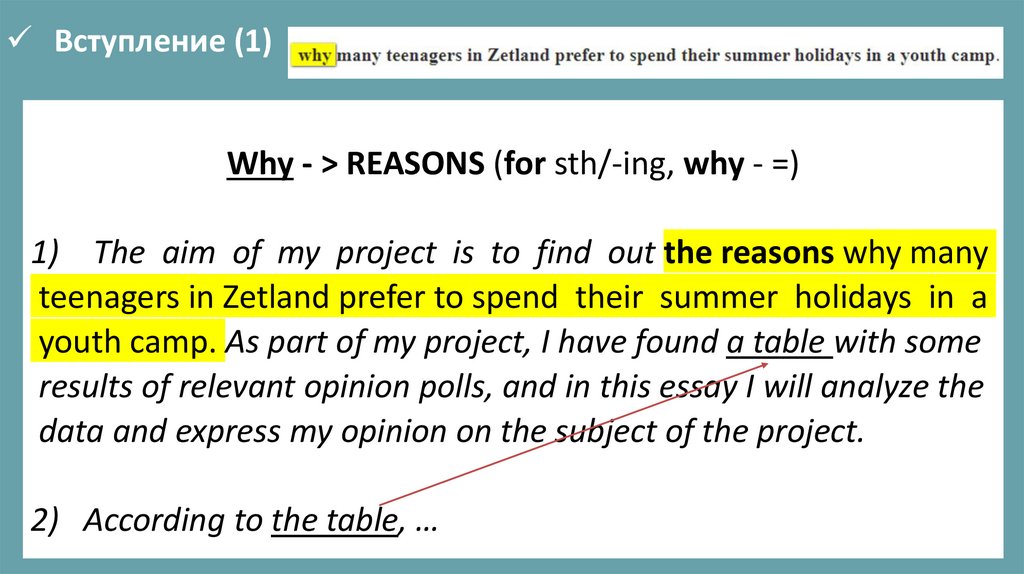
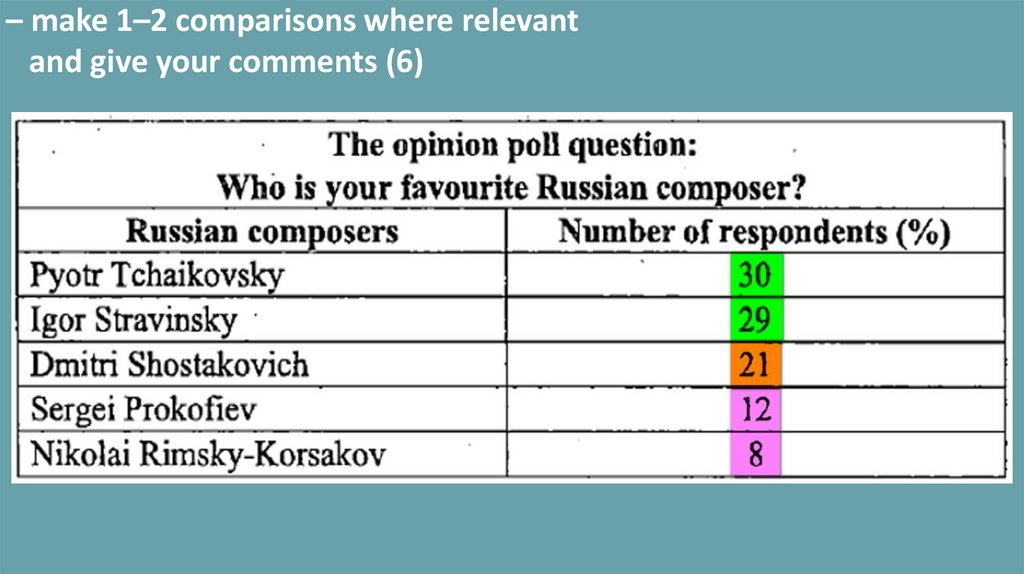
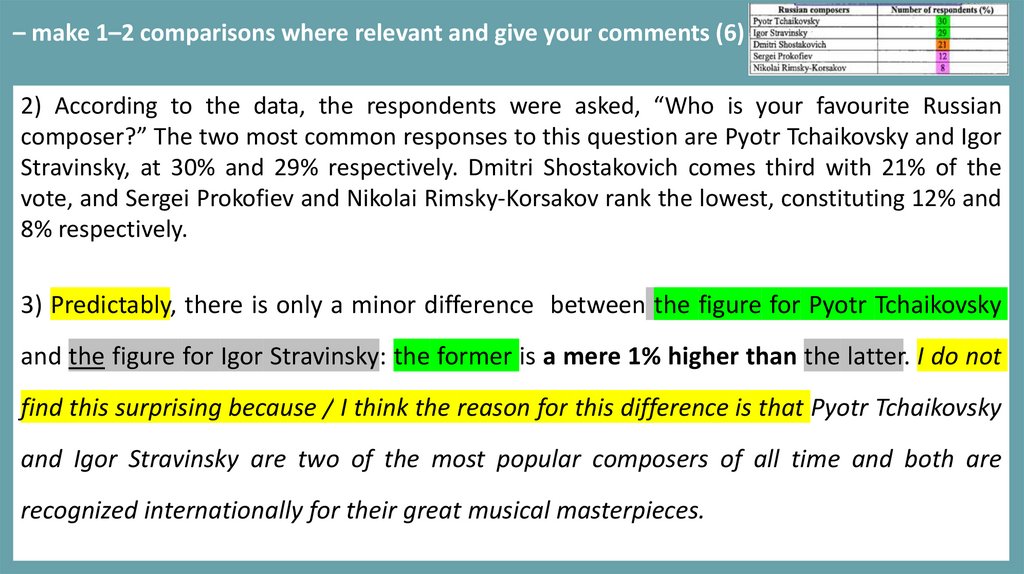
1) The aim of my project is to find out the reasons why many
teenagers in Zetland prefer to spend their summer holidays in a
youth camp. As part of my project, I have found a table with some
results of relevant opinion polls, and in this essay I will analyze the
data and express my opinion on the subject of the project.
2) According to the table, …
17.
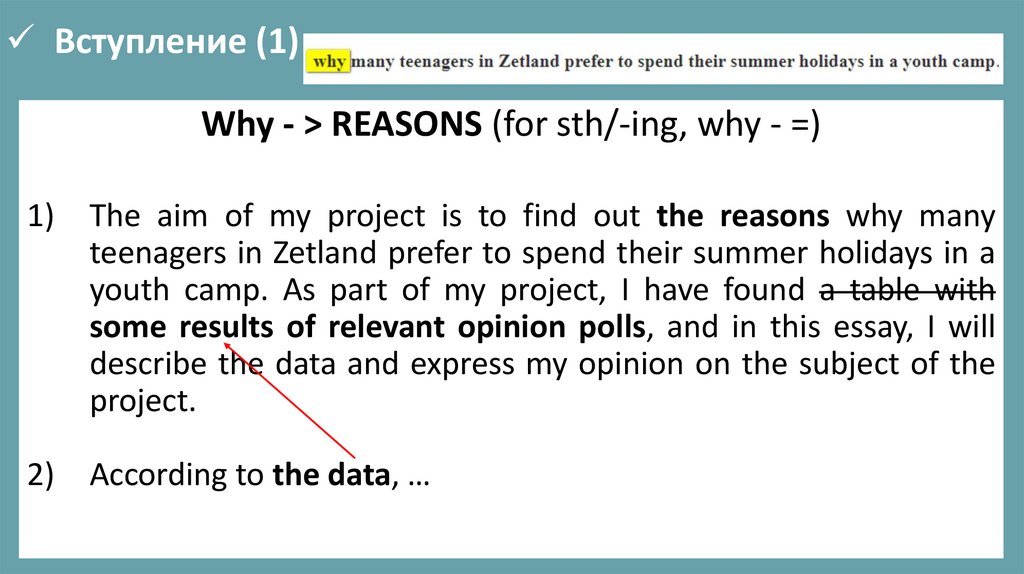
Вступление (1)Why - > REASONS (for sth/-ing, why - =)
1)
The aim of my project is to find out the reasons why many
teenagers in Zetland prefer to spend their summer holidays in a
youth camp. As part of my project, I have found a table with
some results of relevant opinion polls, and in this essay, I will
describe the data and express my opinion on the subject of the
project.
2)
According to the data, …
18.
Вступление (2)Why - > REASONS (for sth/-ing, why - =)
1)
There are many/different reasons why teenagers like to go to
summer camps. The aim of my project is to find out why many
teenagers in Zetland prefer to spend their summer holidays in a
youth camp. As part of my project, I have found some results of
relevant opinion polls, and in this essay I will describe the data
and express my opinion on the subject of the project.
2)
According to the data, …
19.
2 абзац20.
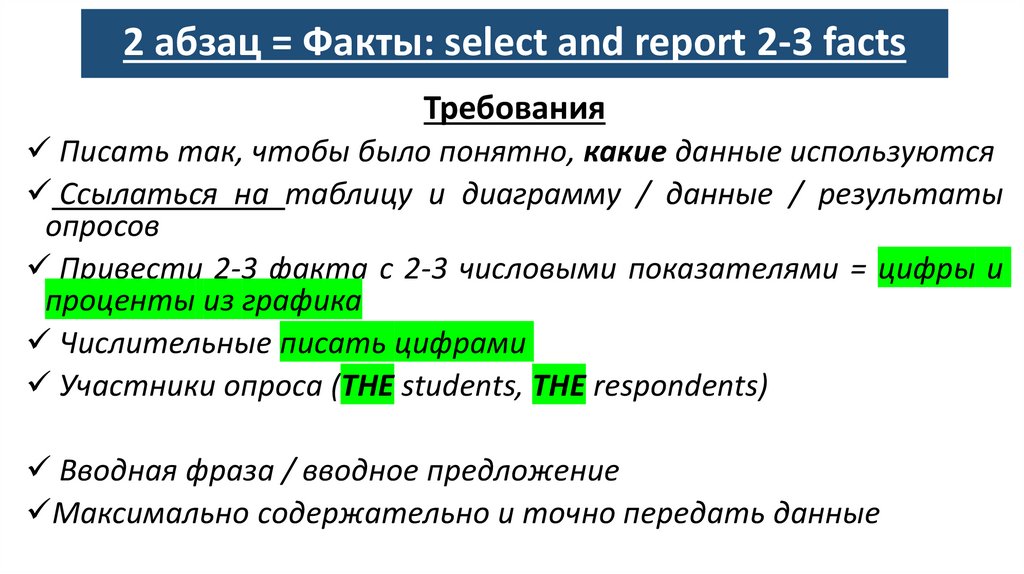
2 абзац = Факты: select and report 2-3 factsТребования
Писать так, чтобы было понятно, какие данные используются
Ссылаться на таблицу и диаграмму / данные / результаты
опросов
Привести 2-3 факта c 2-3 числовыми показателями = цифры и
проценты из графика
Числительные писать цифрами
Участники опроса (THE students, THE respondents)
Вводная фраза / вводное предложение
Максимально содержательно и точно передать данные
21.
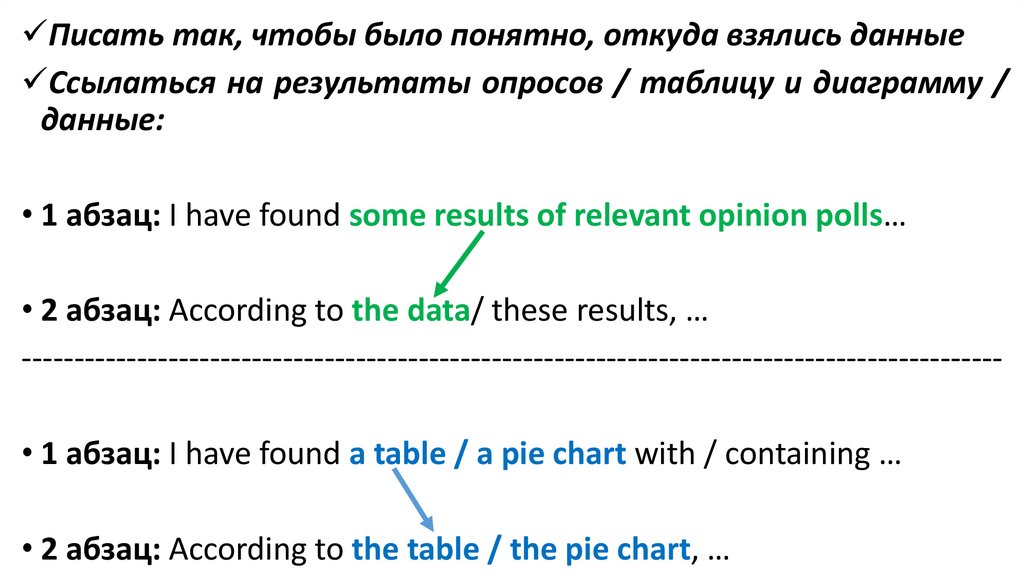
Писать так, чтобы было понятно, откуда взялись данныеСсылаться на результаты опросов / таблицу и диаграмму /
данные:
• 1 абзац: I have found some results of relevant opinion polls…
• 2 абзац: According to the data/ these results, …
---------------------------------------------------------------------------------------------• 1 абзац: I have found a table / a pie chart with / containing …
• 2 абзац: According to the table / the pie chart, …
22.
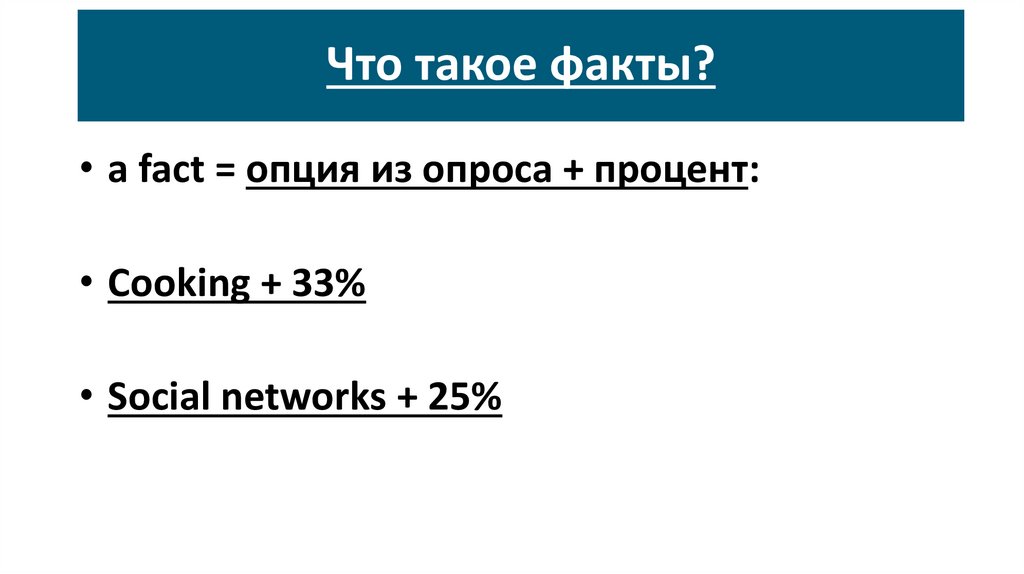
Что такое факты?• a fact = опция из опроса + процент:
• Cooking + 33%
• Social networks + 25%
23.
Что такое факты?• a fact = 2-3-4 опции из опроса + проценты:
• Cooking, 33% + Reading, 31%
24.
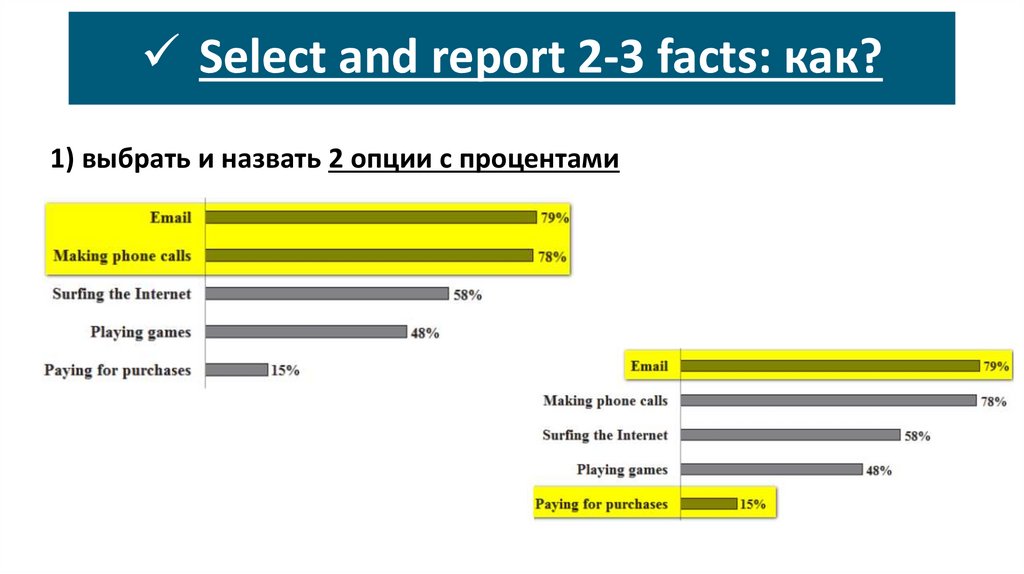
Select and report 2-3 facts: как?1) выбрать и назвать 2 опции с процентами
25.
Select and report 2-3 facts: как?2) выбрать и назвать 3 опции с процентами
26.
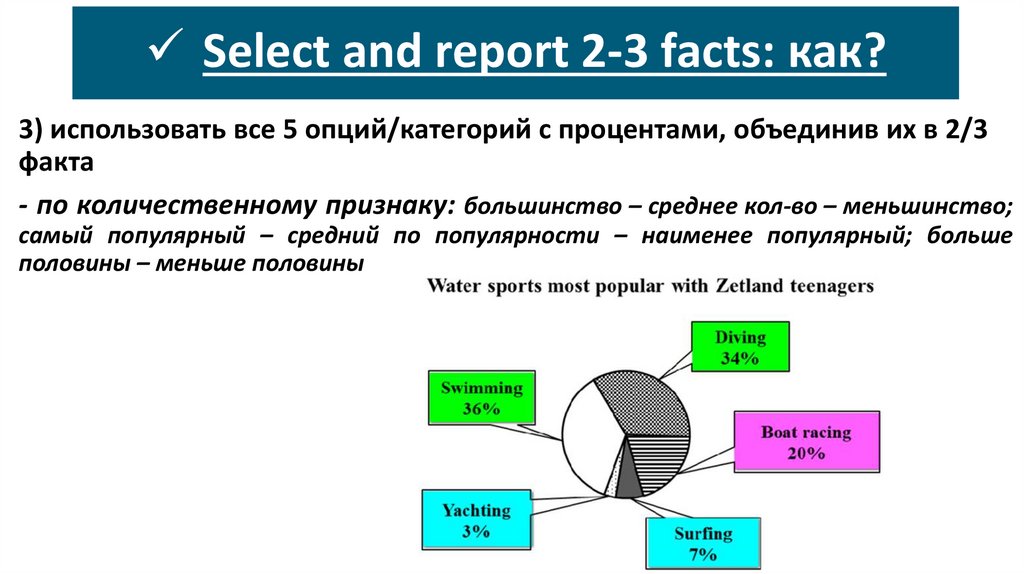
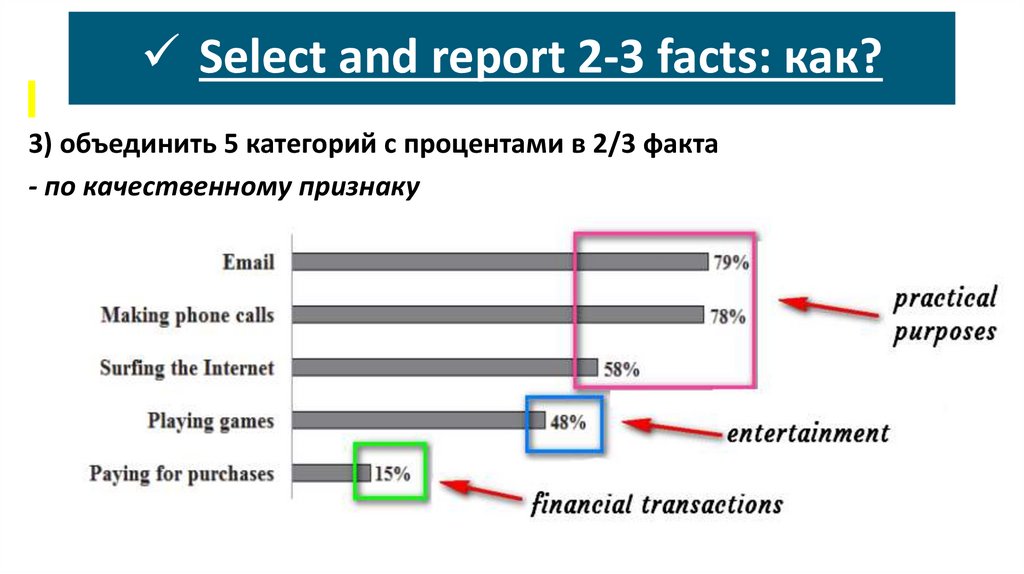
Select and report 2-3 facts: как?3) использовать все 5 опций/категорий с процентами, объединив их в 2/3
факта
- по количественному признаку: большинство – среднее кол-во – меньшинство;
самый популярный – средний по популярности – наименее популярный; больше
половины – меньше половины
27.
Select and report 2-3 facts: как?3) объединить 5 категорий с процентами в 2/3 факта
- по качественному признаку
28.
2 абзацнеобходимая лексика
29.
Опрошенные:• THE teenagers / the students / the users
• The respondents
• Those (who were) polled / surveyed / questioned
• Those who participated / took part in the survey
• The participants of the survey
• 30% of the sample
30.
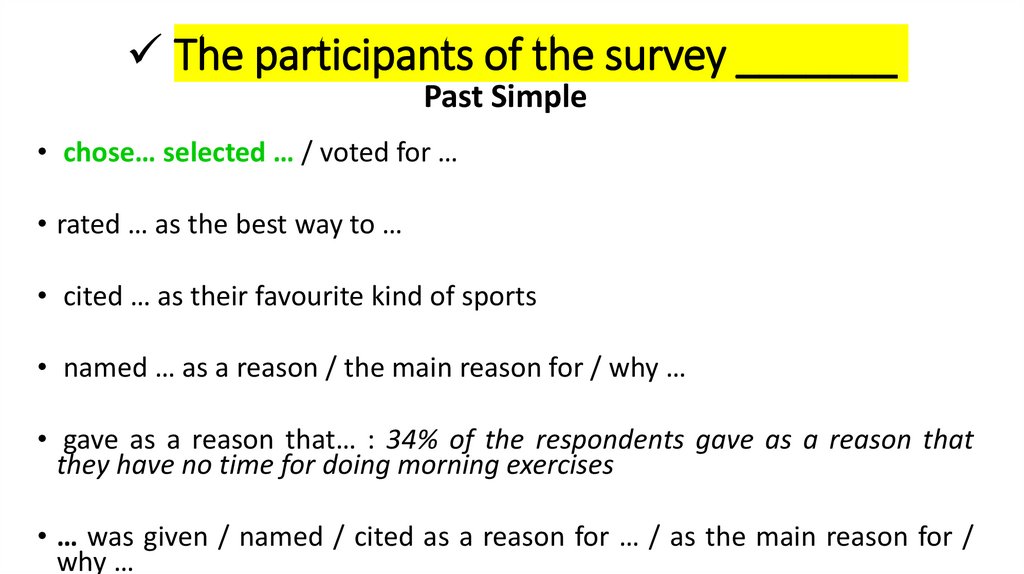
The participants of the survey _______Past Simple
• chose… selected … / voted for …
• rated … as the best way to …
• cited … as their favourite kind of sports
• named … as a reason / the main reason for / why …
• gave as a reason that… : 34% of the respondents gave as a reason that
they have no time for doing morning exercises
• … was given / named / cited as a reason for … / as the main reason for /
why …
31.
The participants of the survey…Present Simple
• choose / select …
• name … as a reason for / as the main reason why …
• cite … as their favourite kind of sports
• rate … as the best way to …
• report doing sth: According to the data, 92% of the adolescents report going online
daily.
• like / enjoy / prefer doing
32.
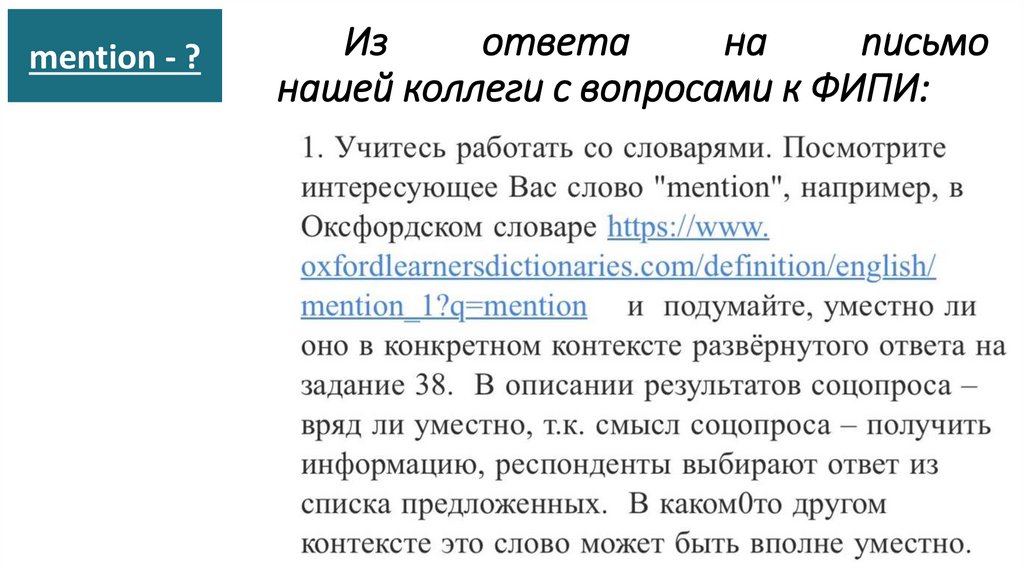
mention - ?Из
ответа
на
письмо
нашей коллеги с вопросами к ФИПИ:
33.
Кавычки: опция, цитирование• 38% of the respondents chose/selected the option “Health
care”.
• Only 8% of the respondents selected the “Other” option.
34.
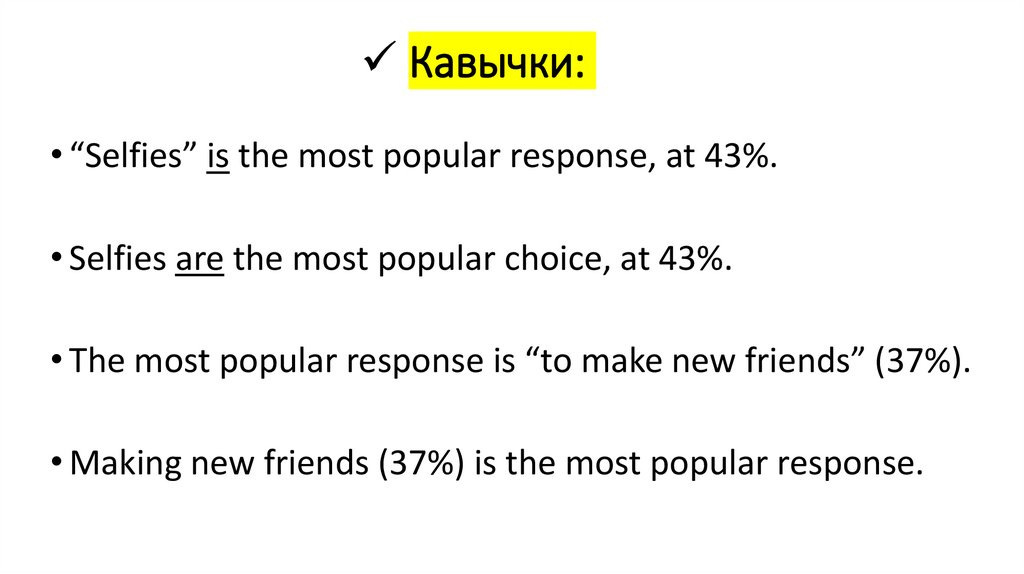
Кавычки:• “Selfies” is the most popular response, at 43%.
• Selfies are the most popular choice, at 43%.
• The most popular response is “to make new friends” (37%).
• Making new friends (37%) is the most popular response.
35.
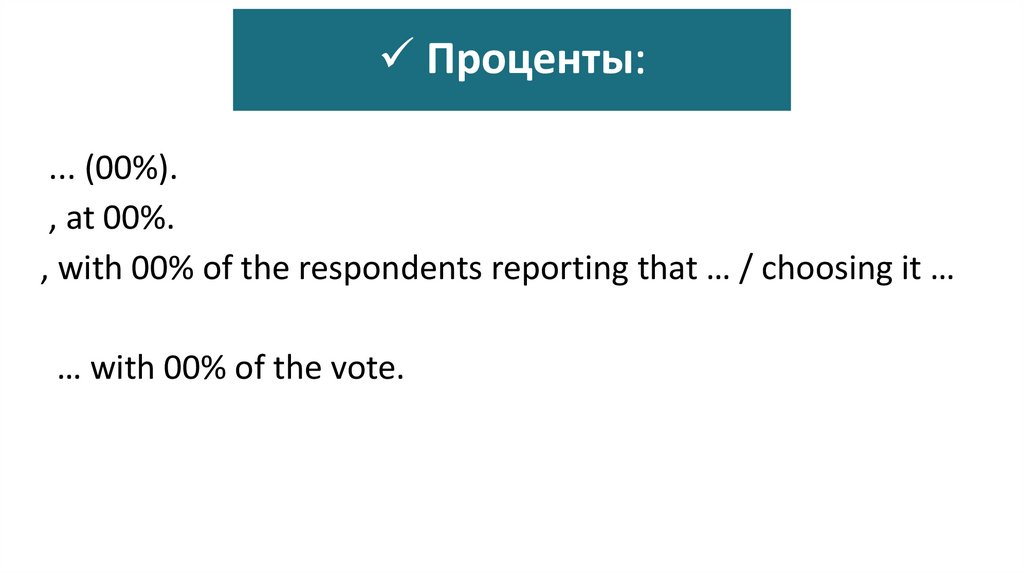
Проценты:... (00%).
, at 00%.
, with 00% of the respondents reporting that … / choosing it …
… with 00% of the vote.
36.
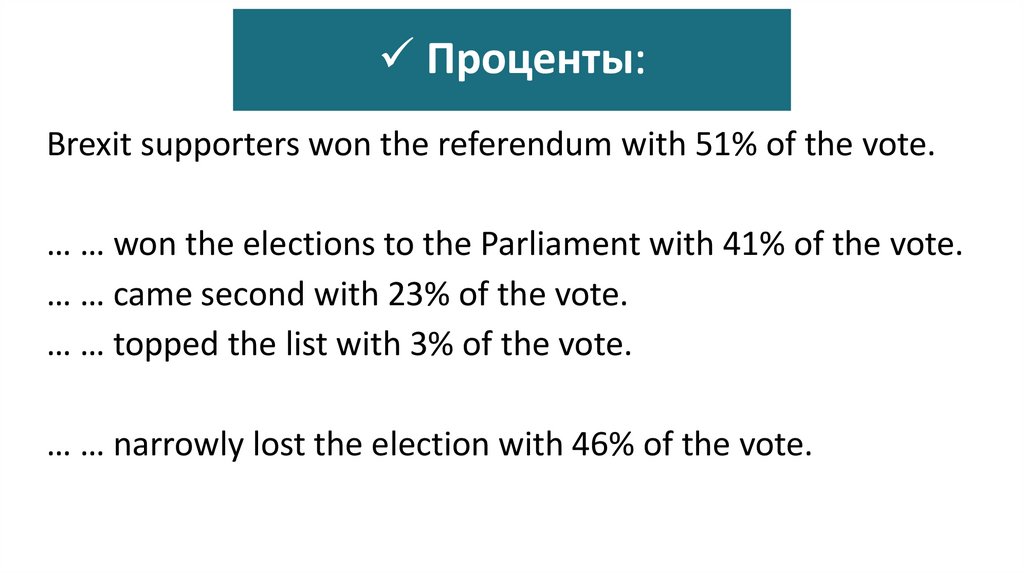
Проценты:Brexit supporters won the referendum with 51% of the vote.
… … won the elections to the Parliament with 41% of the vote.
… … came second with 23% of the vote.
… … topped the list with 3% of the vote.
… … narrowly lost the election with 46% of the vote.
37.
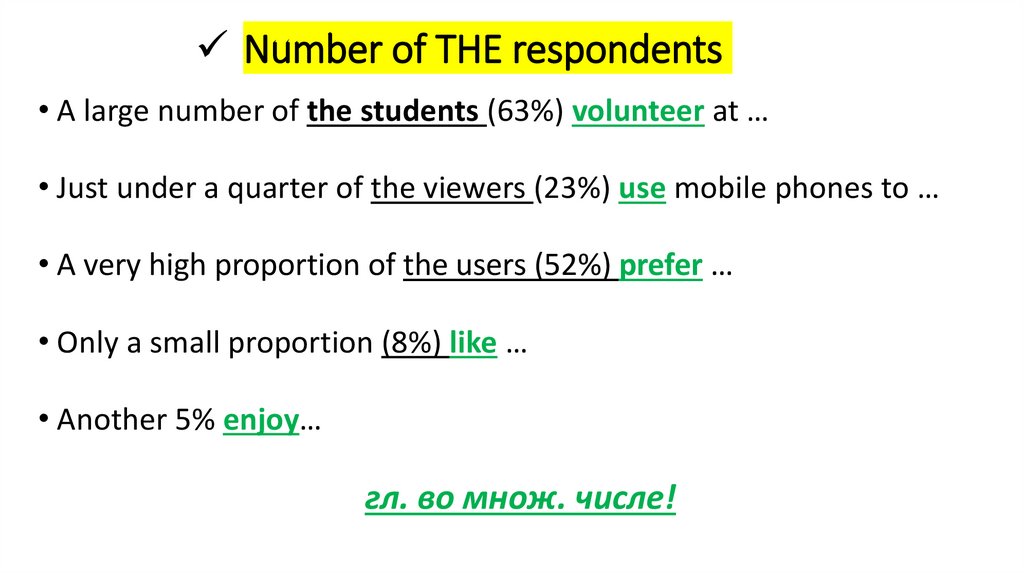
Number of THE respondents• A large number of the students (63%) volunteer at …
• Just under a quarter of the viewers (23%) use mobile phones to …
• A very high proportion of the users (52%) prefer …
• Only a small proportion (8%) like …
• Another 5% enjoy…
гл. во множ. числе!
38.
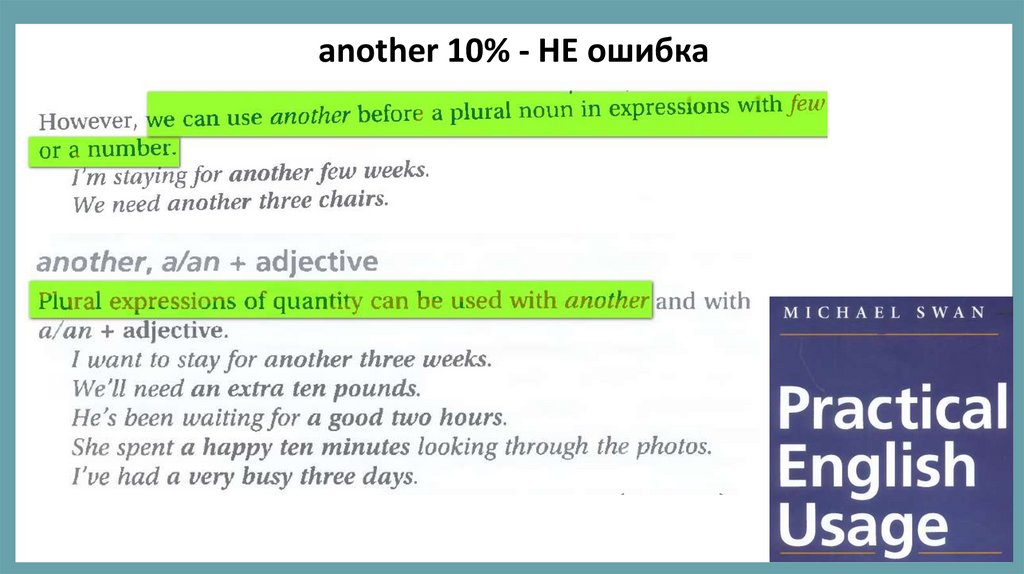
another 10% - НЕ ошибка39.
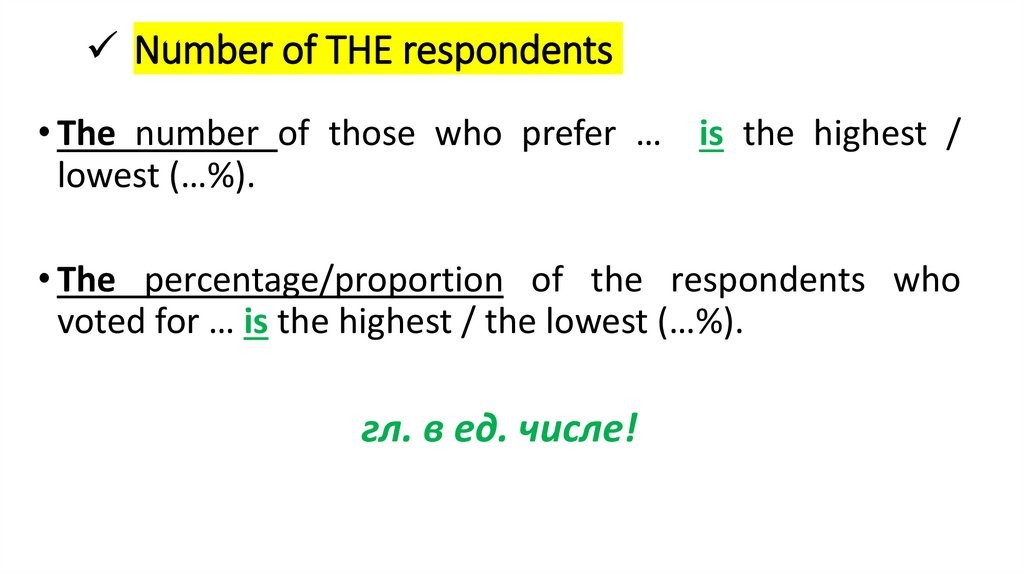
Number of THE respondents• The number of those who prefer … is the highest /
lowest (…%).
• The percentage/proportion of the respondents who
voted for … is the highest / the lowest (…%).
гл. в ед. числе!
40.
41.
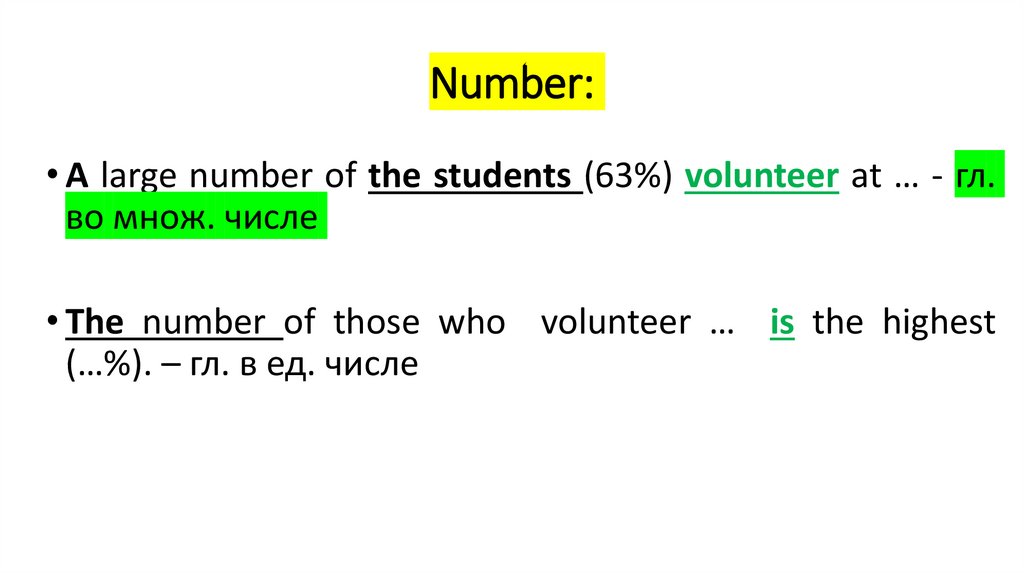
Number:• A large number of the students (63%) volunteer at … - гл.
во множ. числе
• The number of those who volunteer … is the highest
(…%). – гл. в ед. числе
42.
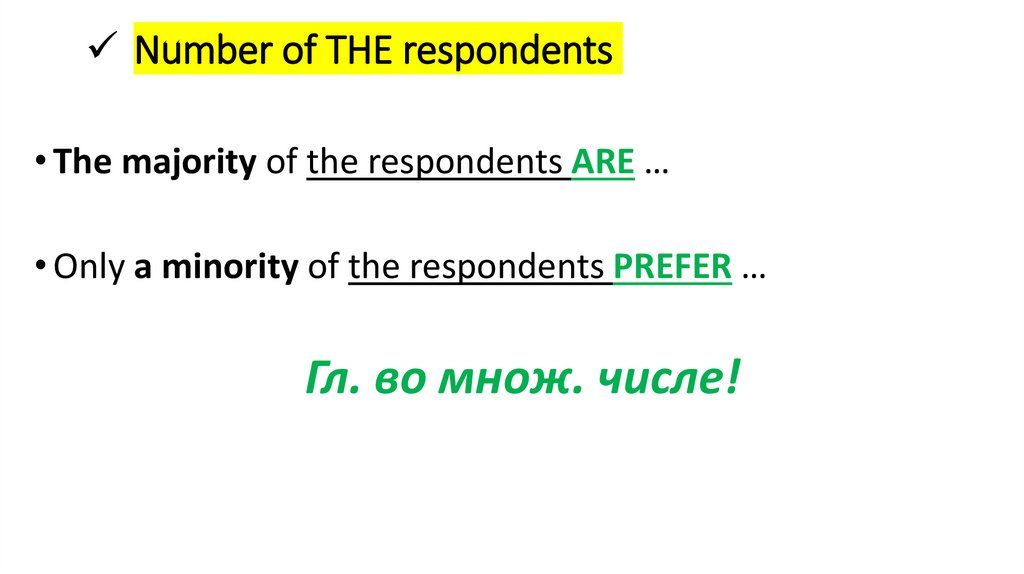
Number of THE respondents• The majority of the respondents ARE …
• Only a minority of the respondents PREFER …
Гл. во множ. числе!
43.
Проценты пишем цифрами!• 23% (без пробелов)
• The figure for … is … %.
44.
DATA: (ед. / множ. ч.)STATISTICS (мн. ч.):
• The data is/are…
• The data was/were…
• The statistics are…
Information (ед. ч.):
• The information is…
45.
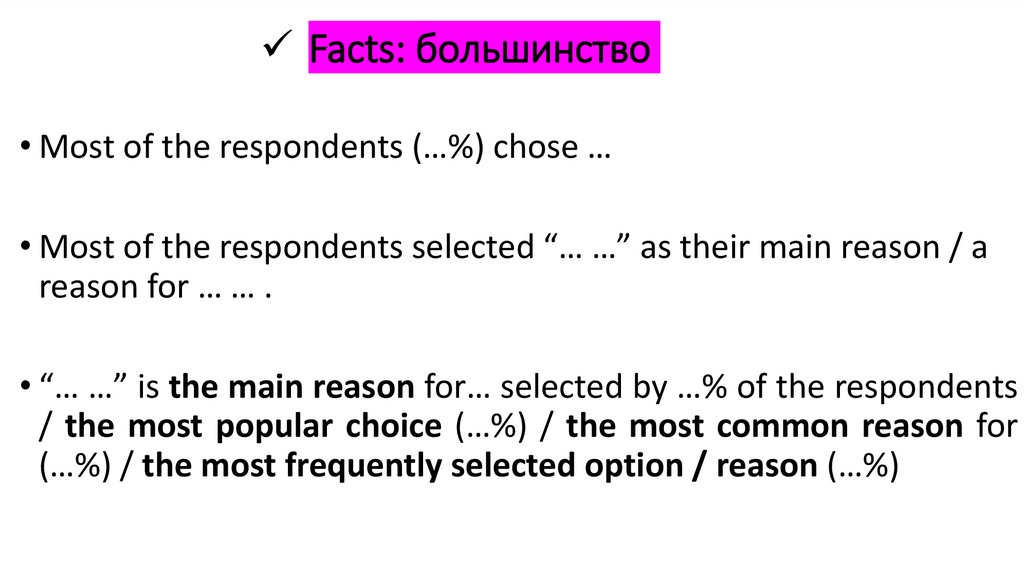
Facts: большинство• Most of the respondents (…%) chose …
• Most of the respondents selected “… …” as their main reason / a
reason for … … .
• “… …” is the main reason for… selected by …% of the respondents
/ the most popular choice (…%) / the most common reason for
(…%) / the most frequently selected option / reason (…%)
46.
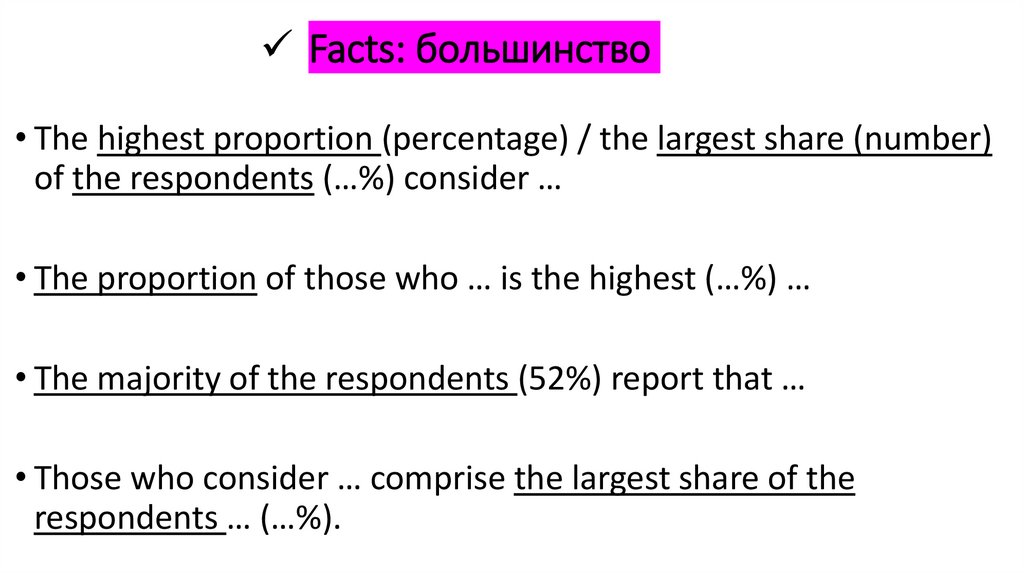
Facts: большинство• The highest proportion (percentage) / the largest share (number)
of the respondents (…%) consider …
• The proportion of those who … is the highest (…%) …
• The majority of the respondents (52%) report that …
• Those who consider … comprise the largest share of the
respondents … (…%).
47.
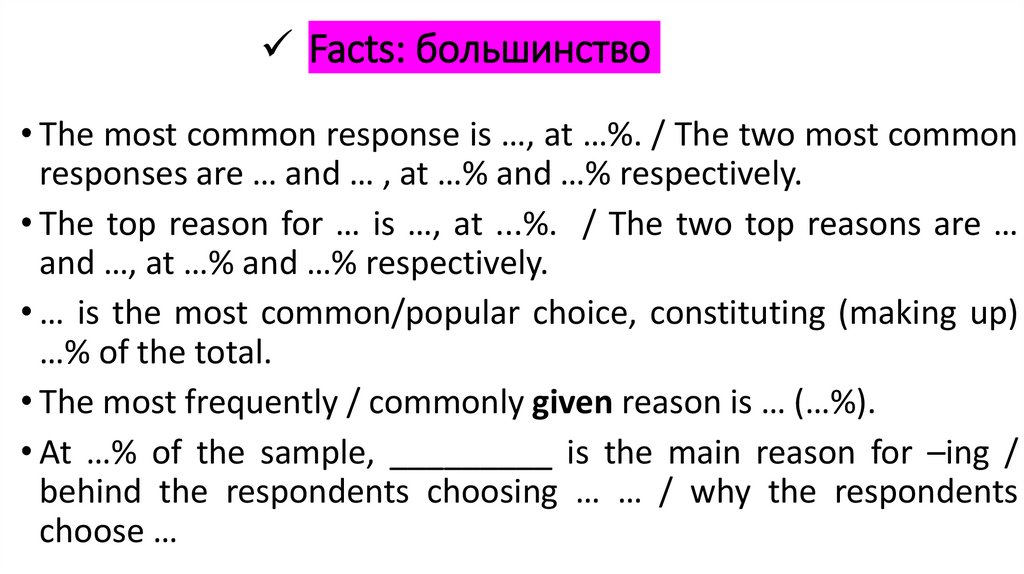
Facts: большинство• The most common response is …, at …%. / The two most common
responses are … and … , at …% and …% respectively.
• The top reason for … is …, at ...%. / The two top reasons are …
and …, at …% and …% respectively.
• … is the most common/popular choice, constituting (making up)
…% of the total.
• The most frequently / commonly given reason is … (…%).
• At …% of the sample, _________ is the main reason for –ing /
behind the respondents choosing … … / why the respondents
choose …
48.
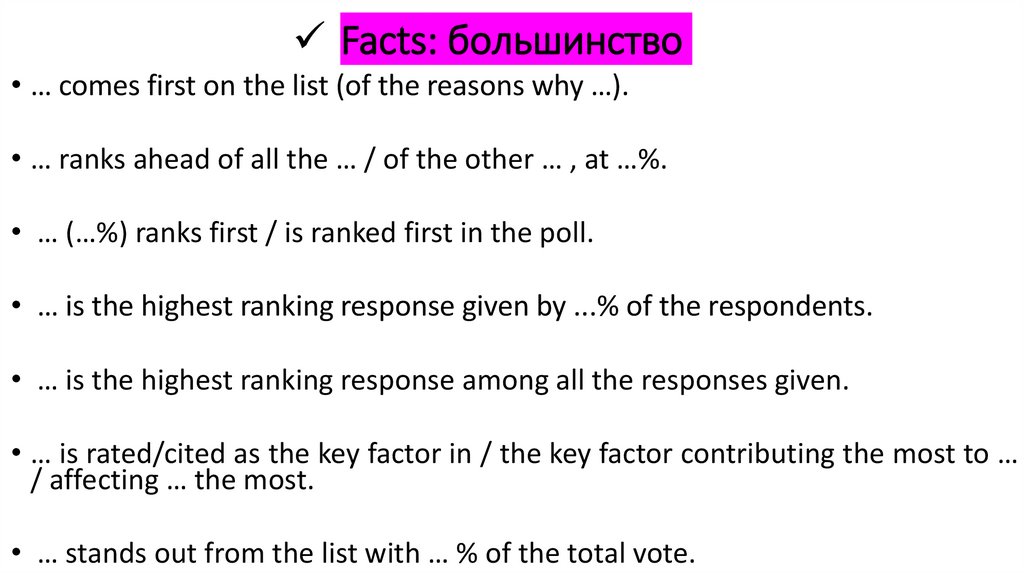
Facts: большинство• … comes first on the list (of the reasons why …).
• … ranks ahead of all the … / of the other … , at …%.
• … (…%) ranks first / is ranked first in the poll.
• … is the highest ranking response given by ...% of the respondents.
• … is the highest ranking response among all the responses given.
• … is rated/cited as the key factor in / the key factor contributing the most to …
/ affecting … the most.
• … stands out from the list with … % of the total vote.
49.
Facts: среднее количество• … is/are also popular / common, at 28%.
• … is relatively popular / common too, at 26%
• … comes second / third in popularity, making up …% of the total.
• … ranks/comes second/third on the list / in the table/ in the pie chart.
• … (…%) occupies the second / third position on the list / in the table.
• The second /third position of the table is occupied by … / those who
… (…%).
50.
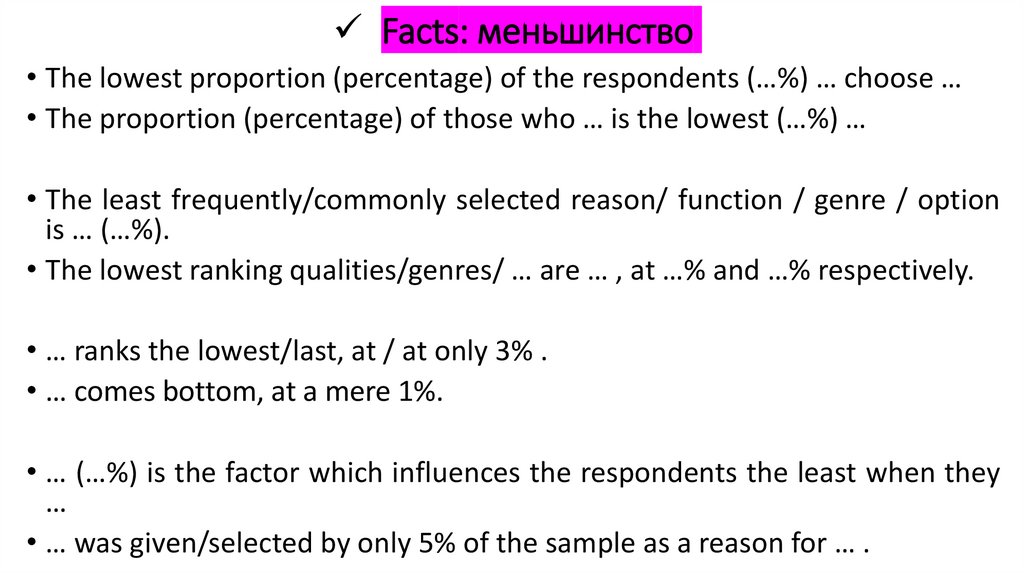
Facts: меньшинство• The lowest proportion (percentage) of the respondents (…%) … choose …
• The proportion (percentage) of those who … is the lowest (…%) …
• The least frequently/commonly selected reason/ function / genre / option
is … (…%).
• The lowest ranking qualities/genres/ … are … , at …% and …% respectively.
• … ranks the lowest/last, at / at only 3% .
• … comes bottom, at a mere 1%.
• … (…%) is the factor which influences the respondents the least when they
…
• … was given/selected by only 5% of the sample as a reason for … .
51.
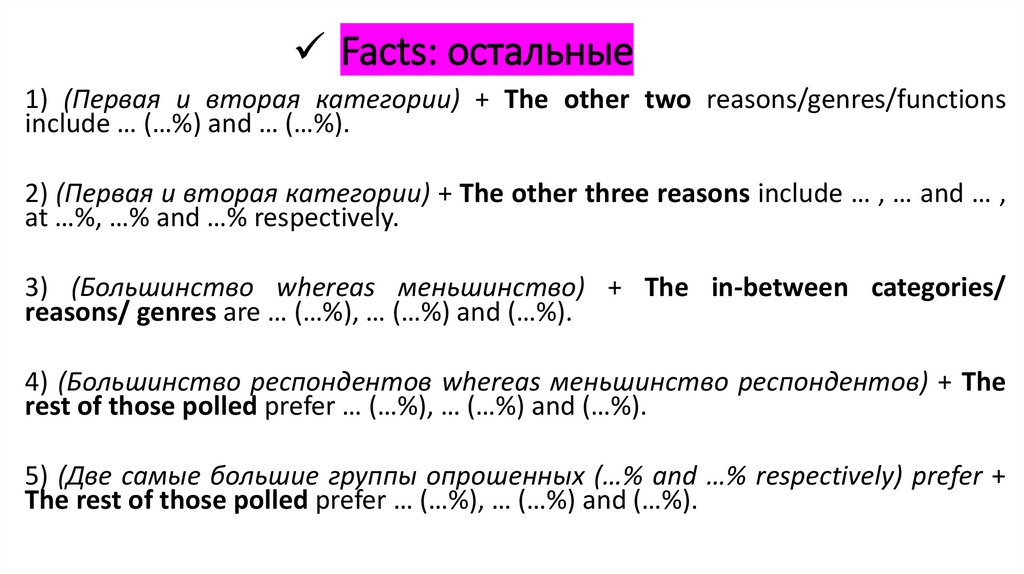
Facts: остальные1) (Первая и вторая категории) + The other two reasons/genres/functions
include … (…%) and … (…%).
2) (Первая и вторая категории) + The other three reasons include … , … and … ,
at …%, …% and …% respectively.
3) (Большинство whereas меньшинство) + The in-between categories/
reasons/ genres are … (…%), … (…%) and (…%).
4) (Большинство респондентов whereas меньшинство респондентов) + The
rest of those polled prefer … (…%), … (…%) and (…%).
5) (Две самые большие группы опрошенных (…% and …% respectively) prefer +
The rest of those polled prefer … (…%), … (…%) and (…%).
52.
Составлять …%make up …% (of the total)
account for …% (of the total)
constitute …% (of the total)
are/is equal to … …% (of the total)
53.
2 абзац, Примеры написания:54.
- select and report 2-3 facts (1)55.
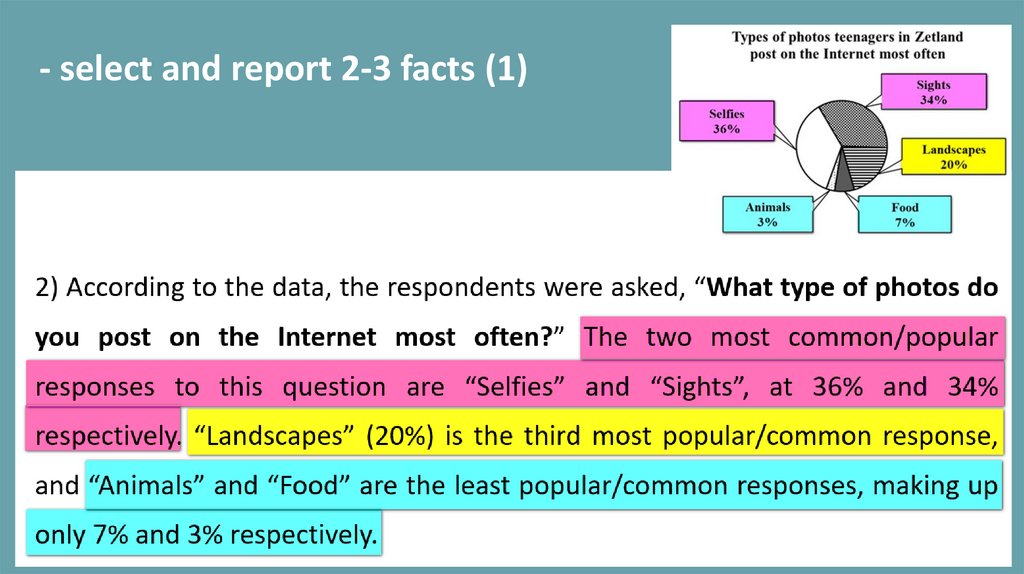
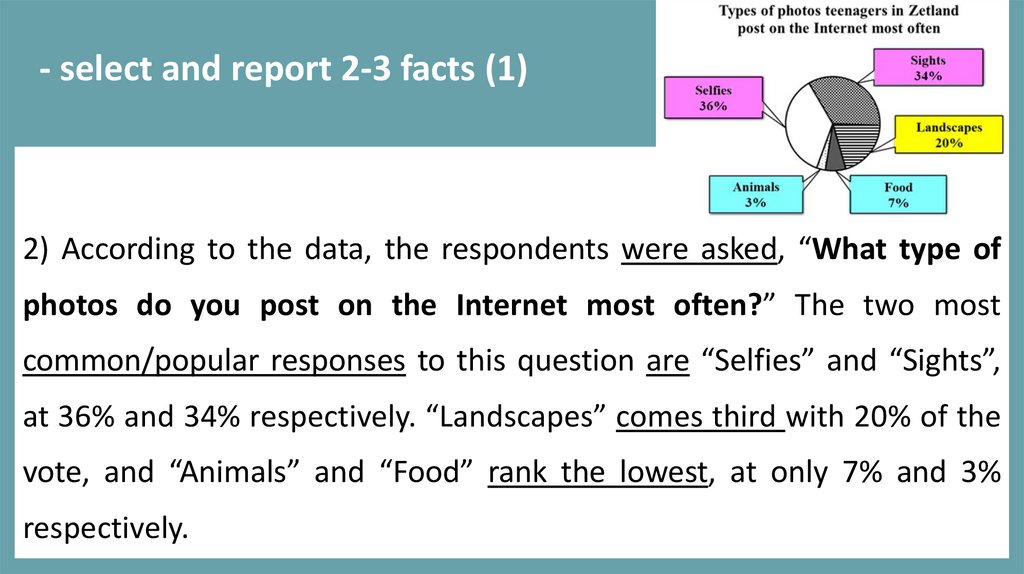
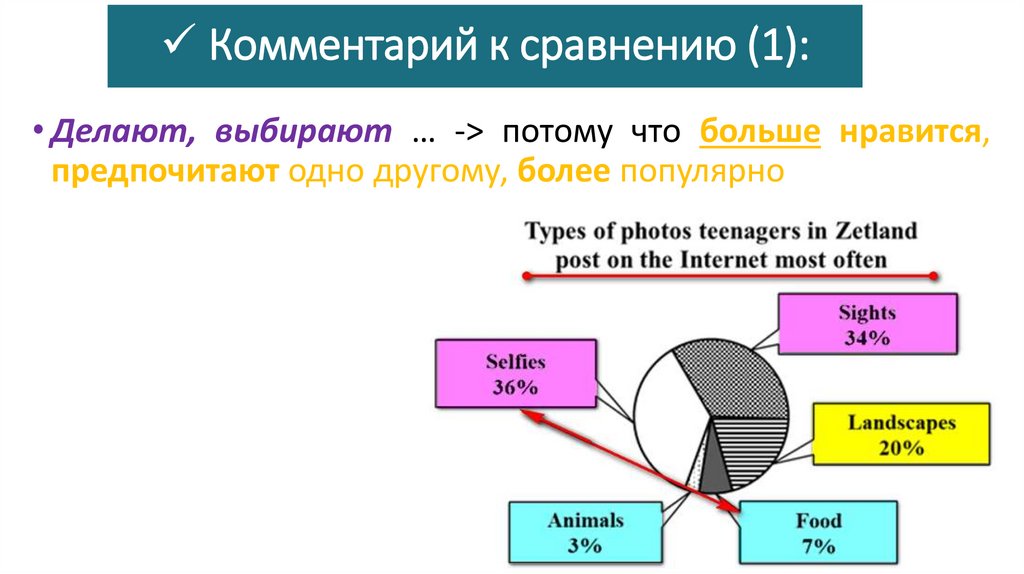
- select and report 2-3 facts (1)2) According to the data, the respondents were asked, “What type of photos do
you post on the Internet most often?” The two most common/popular
responses to this question are “Selfies” and “Sights”, at 36% and 34%
respectively. “Landscapes” (20%) is the third most popular/common response,
and “Animals” and “Food” are the least popular/common responses, making up
only 7% and 3% respectively.
56.
- select and report 2-3 facts (1)57.
- select and report 2-3 facts (1)2) According to the data, the respondents were asked, “What type of
photos do you post on the Internet most often?” The two most
common/popular responses to this question are “Selfies” and “Sights”,
at 36% and 34% respectively. “Landscapes” comes third with 20% of the
vote, and “Animals” and “Food” rank the lowest, at only 7% and 3%
respectively.
58.
59.
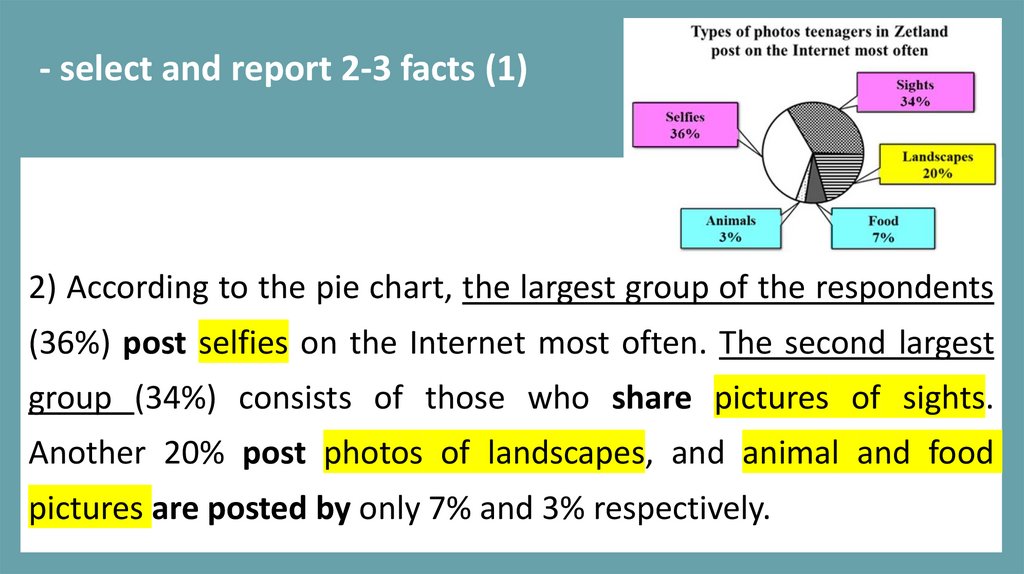
- select and report 2-3 facts (1)2) According to the pie chart, the largest group of the respondents
(36%) post selfies on the Internet most often. The second largest
group (34%) consists of those who share pictures of sights.
Another 20% post photos of landscapes, and animal and food
pictures are posted by only 7% and 3% respectively.
60.
- select and report 2-3 facts (2)61.
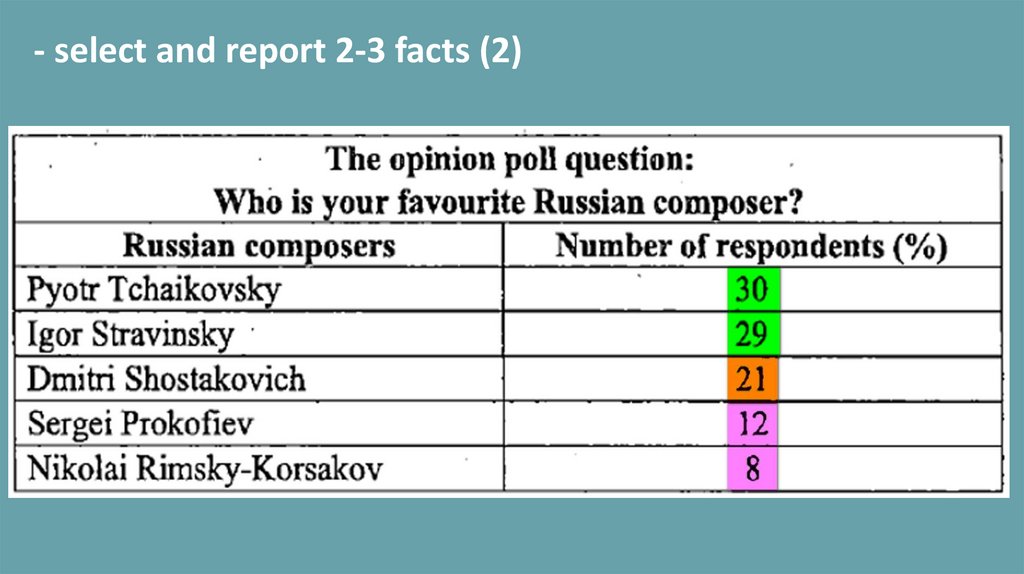
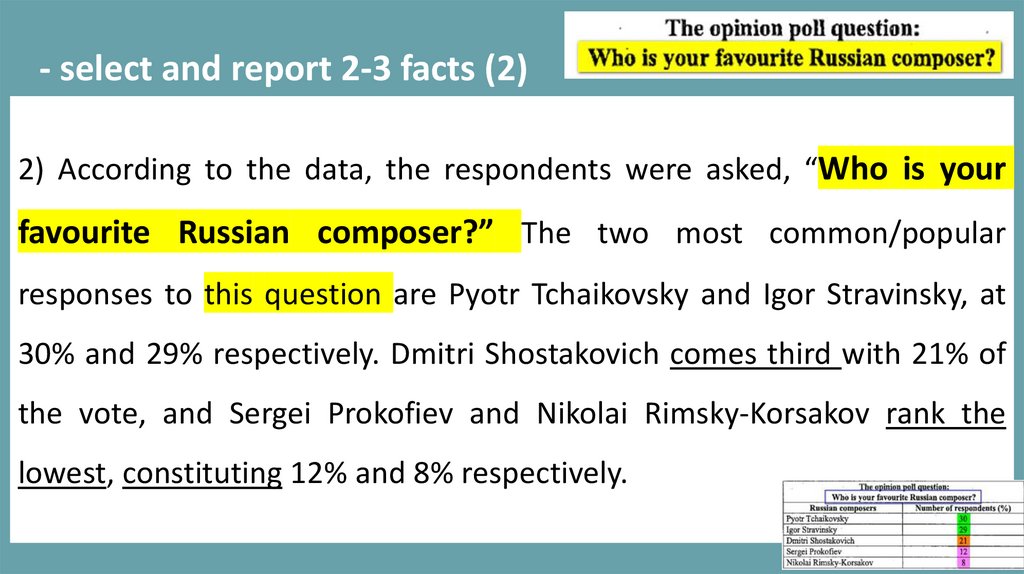
- select and report 2-3 facts (2)2) According to the data, the respondents were asked, “Who is your
favourite Russian composer?” The two most common/popular
responses to this question are Pyotr Tchaikovsky and Igor Stravinsky, at
30% and 29% respectively. Dmitri Shostakovich comes third with 21% of
the vote, and Sergei Prokofiev and Nikolai Rimsky-Korsakov rank the
lowest, constituting 12% and 8% respectively.
62.
- select and report 2-3 facts (2)2) According to the data, Pyotr Tchaikovsky and Igor Stravinsky are
the two composers most frequently selected by the respondents, at
30% and 29% respectively. Dmitri Shostakovich comes third with
21% of the vote, and Sergei Prokofiev and Nikolai Rimsky-Korsakov
rank the lowest, constituting 12% and 8% respectively.
63.
- select and report 2-3 facts (3)64.
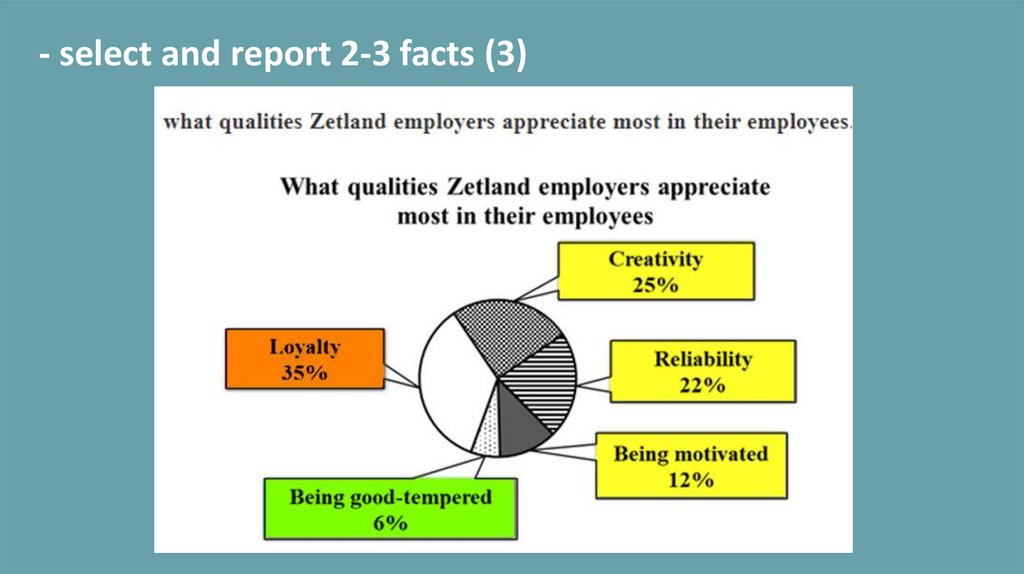
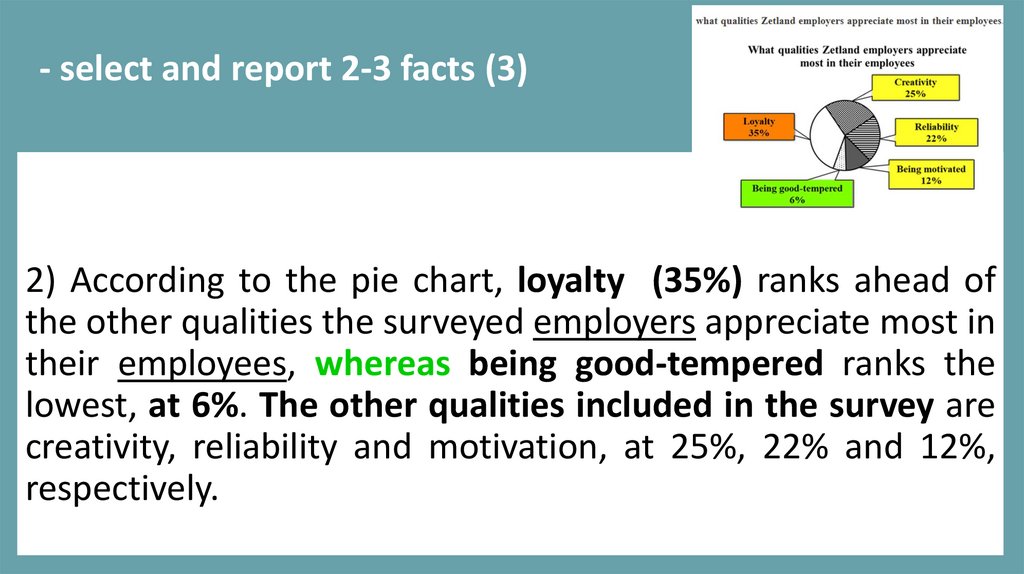
- select and report 2-3 facts (3)2) According to the pie chart, loyalty (35%) ranks ahead of
the other qualities the surveyed employers appreciate most in
their employees, whereas being good-tempered ranks the
lowest, at 6%. The other qualities included in the survey are
creativity, reliability and motivation, at 25%, 22% and 12%,
respectively.
65.
- select and report 2-3 facts (4)66.
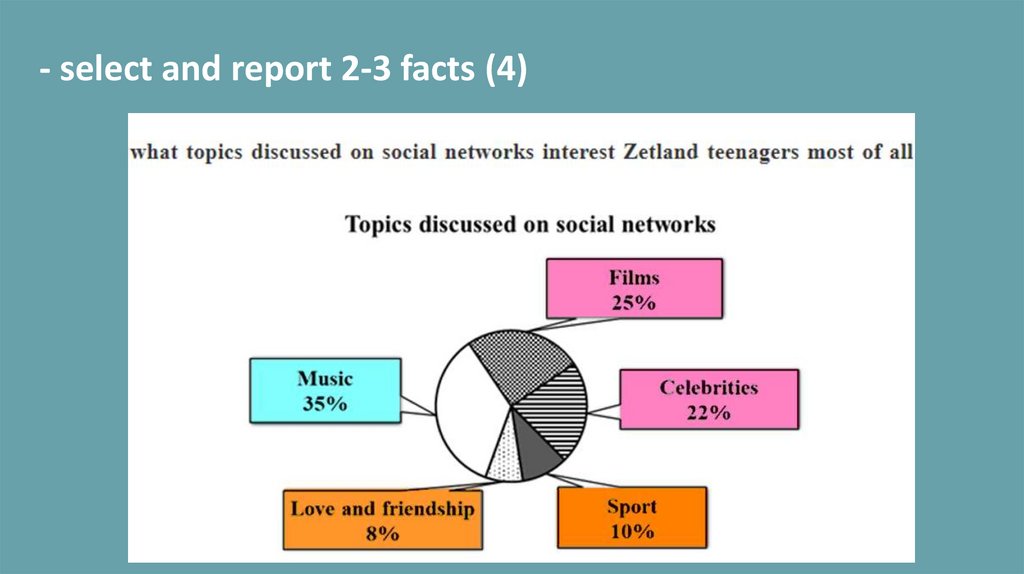
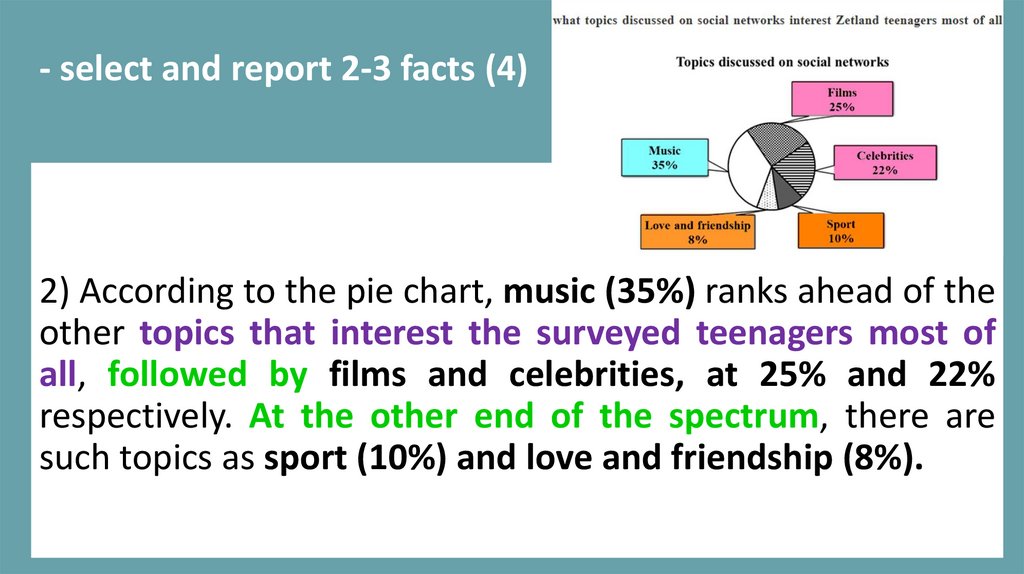
- select and report 2-3 facts (4)2) According to the pie chart, music (35%) ranks ahead of the
other topics that interest the surveyed teenagers most of
all, followed by films and celebrities, at 25% and 22%
respectively. At the other end of the spectrum, there are
such topics as sport (10%) and love and friendship (8%).
67.
- select and report 2-3 facts (5)68.
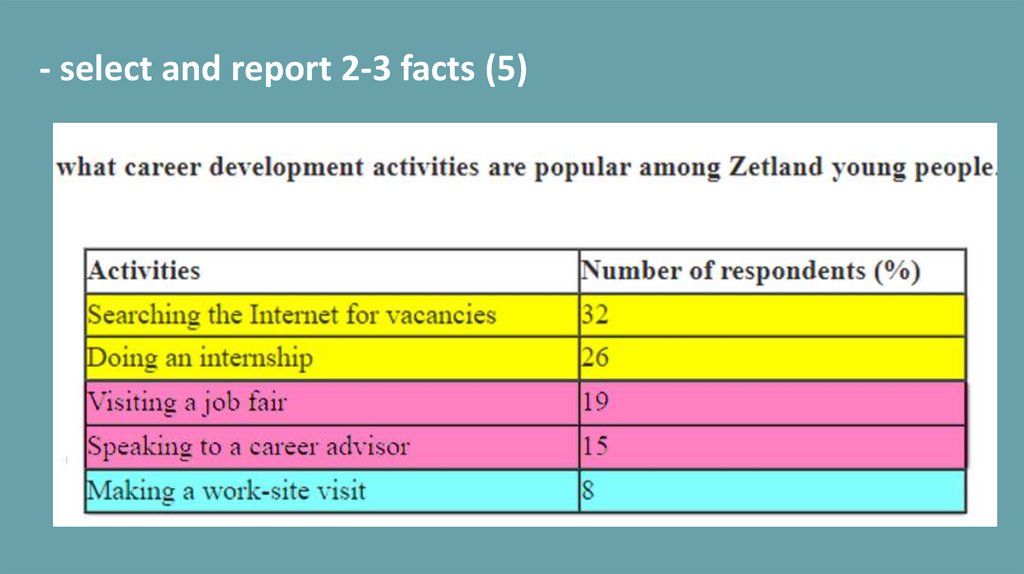
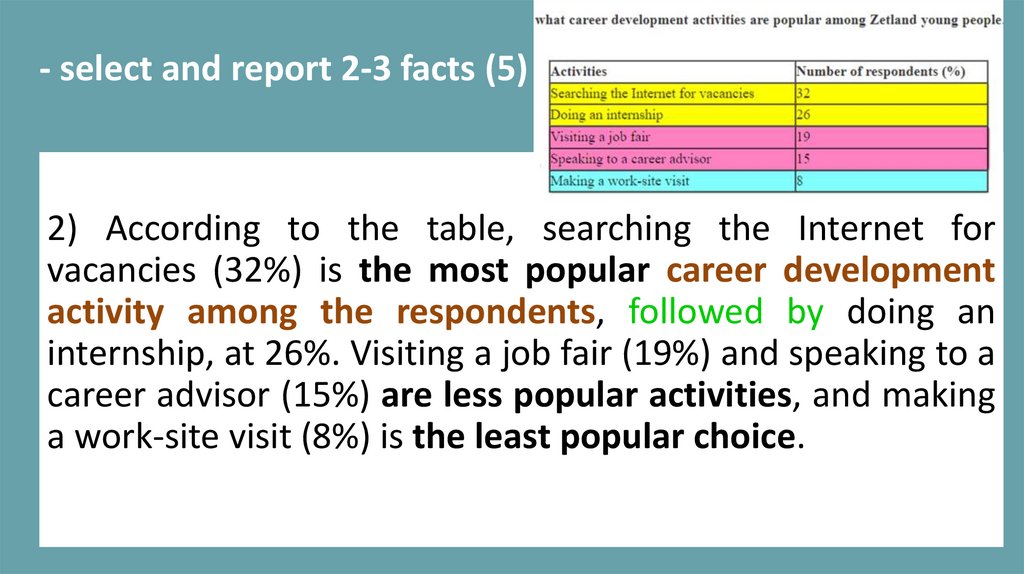
- select and report 2-3 facts (5)2) According to the table, searching the Internet for
vacancies (32%) is the most popular career development
activity among the respondents, followed by doing an
internship, at 26%. Visiting a job fair (19%) and speaking to a
career advisor (15%) are less popular activities, and making
a work-site visit (8%) is the least popular choice.
69.
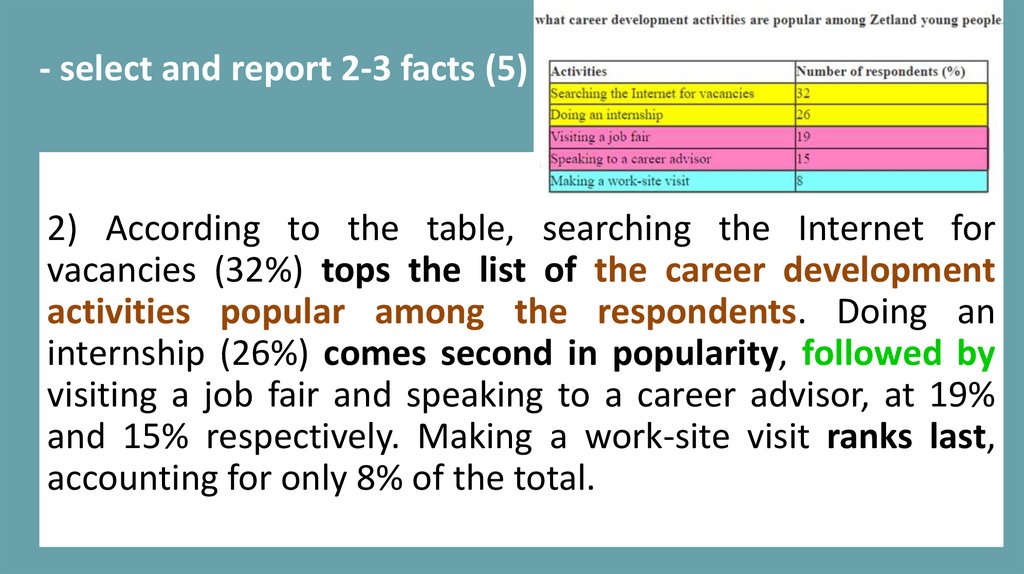
- select and report 2-3 facts (5)2) According to the table, searching the Internet for
vacancies (32%) tops the list of the career development
activities popular among the respondents. Doing an
internship (26%) comes second in popularity, followed by
visiting a job fair and speaking to a career advisor, at 19%
and 15% respectively. Making a work-site visit ranks last,
accounting for only 8% of the total.
70.
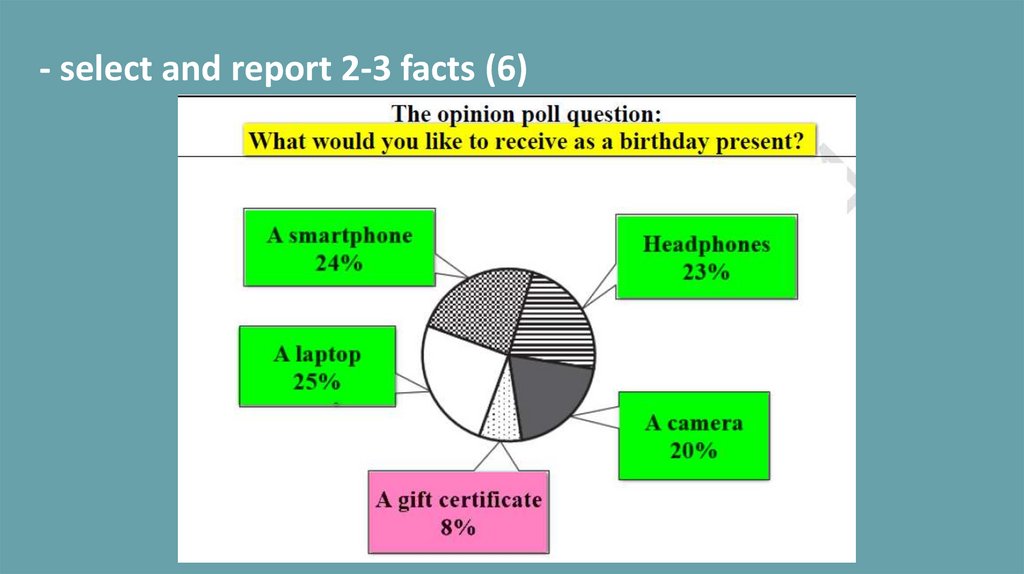
- select and report 2-3 facts (6)71.
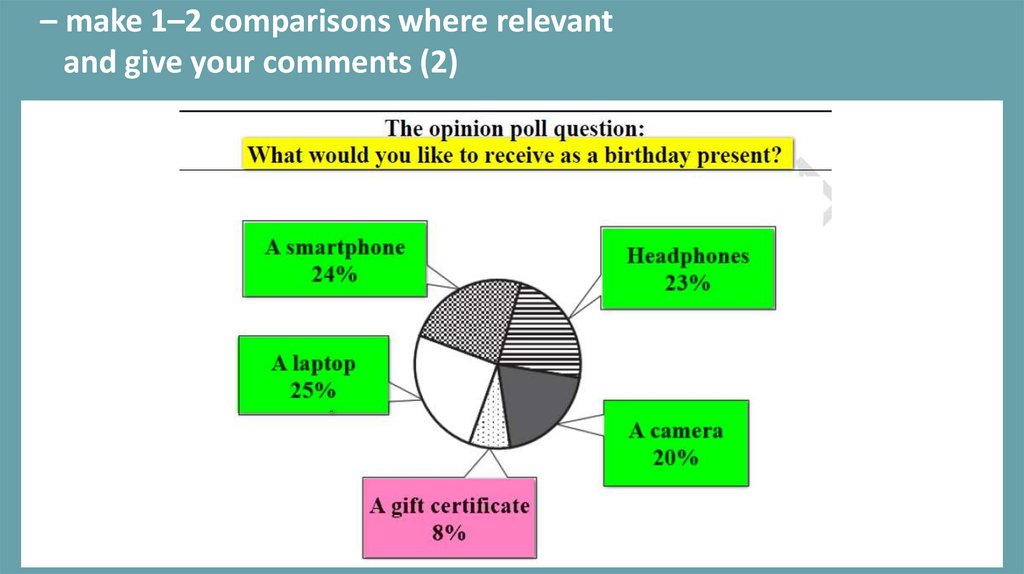
- select and report 2-3 facts (6)2) According to the pie chart, a laptop (25%) is the gift most
favoured by the respondents. It is followed closely by a
smartphone, headphones and a camera, at 24%, 23% and
20% respectively. At the other end of the spectrum, there
is a gift certificate that constitutes only 8% of the total.
72.
- select and report 2-3 facts (7)73.
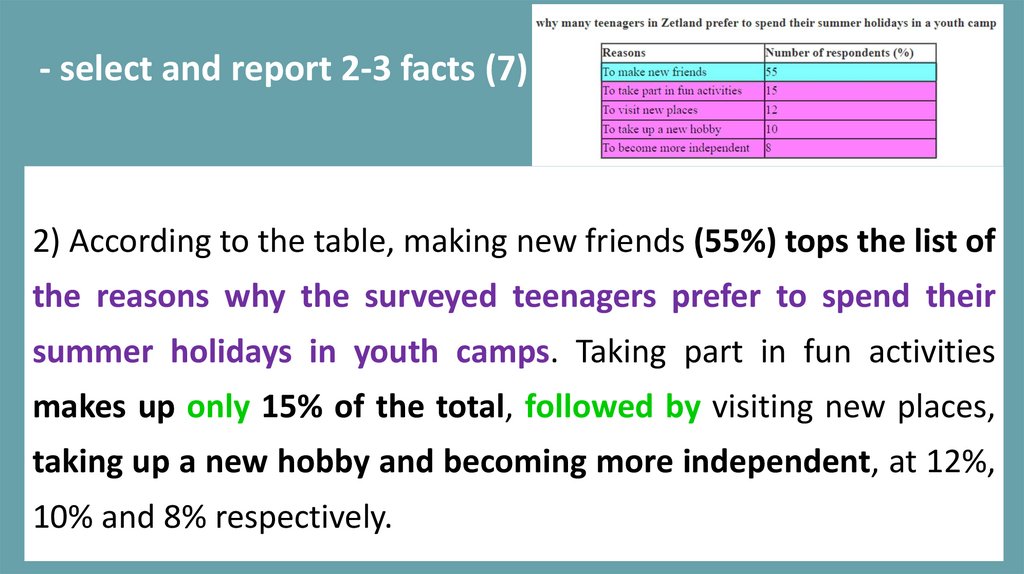
- select and report 2-3 facts (7)2) According to the table, making new friends (55%) tops the list of
the reasons why the surveyed teenagers prefer to spend their
summer holidays in youth camps. Taking part in fun activities
makes up only 15% of the total, followed by visiting new places,
taking up a new hobby and becoming more independent, at 12%,
10% and 8% respectively.
74.
3 абзац75.
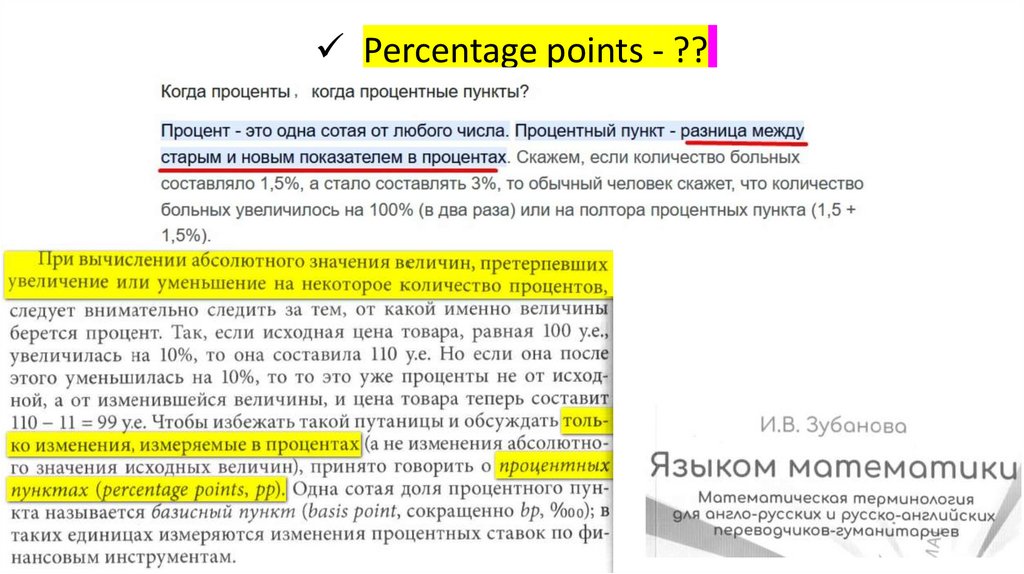
Percentage points - ??76.
Percentage points - ??77.
78.
3 абзацнеобходимая лексика
79.
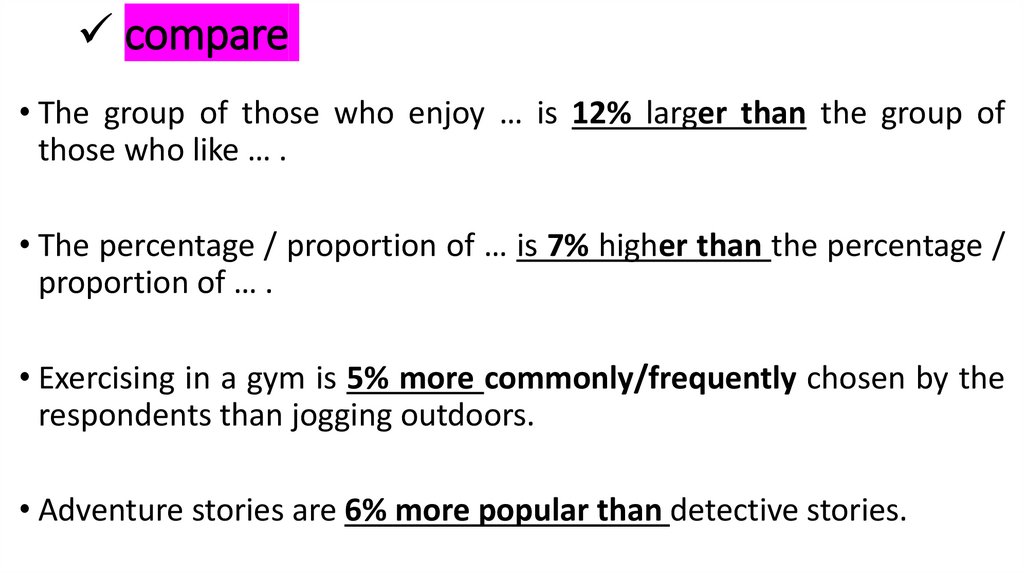
compare• The group of those who enjoy … is 12% larger than the group of
those who like … .
• The percentage / proportion of … is 7% higher than the percentage /
proportion of … .
• Exercising in a gym is 5% more commonly/frequently chosen by the
respondents than jogging outdoors.
• Adventure stories are 6% more popular than detective stories.
80.
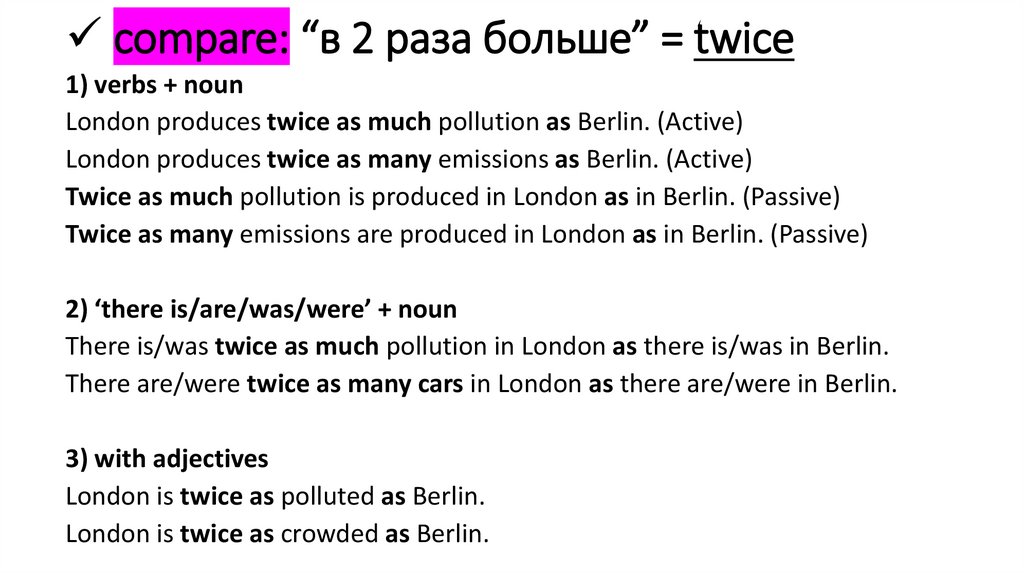
compare: “в 2 раза больше” = twice1) verbs + noun
London produces twice as much pollution as Berlin. (Active)
London produces twice as many emissions as Berlin. (Active)
Twice as much pollution is produced in London as in Berlin. (Passive)
Twice as many emissions are produced in London as in Berlin. (Passive)
2) ‘there is/are/was/were’ + noun
There is/was twice as much pollution in London as there is/was in Berlin.
There are/were twice as many cars in London as there are/were in Berlin.
3) with adjectives
London is twice as polluted as Berlin.
London is twice as crowded as Berlin.
81.
compare: “в 2 раза больше” = twice as adj. as• Stories about animals are twice as popular as romance.
• Keeping pets for company is twice as common as adopting a pet
in order to look after someone.
• The first reason is twice as commonly/frequently selected by the
respondents as the second reason.
• The proportion of those who use … is twice as high as the
proportion of those who choose … .
82.
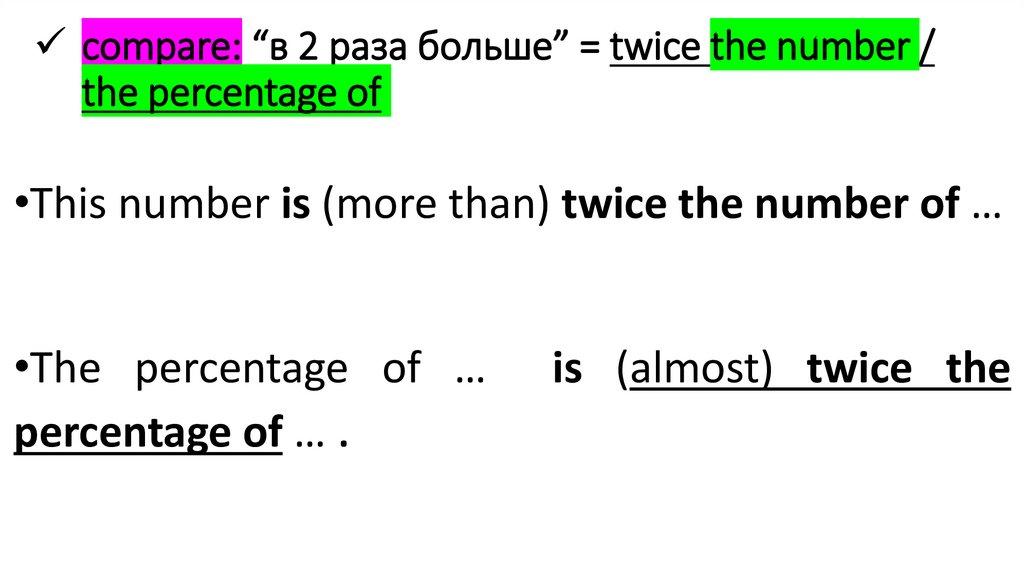
compare: “в 2 раза больше” = twice the number /the percentage of
•This number is (more than) twice the number of …
•The percentage of …
percentage of … .
is (almost) twice the
83.
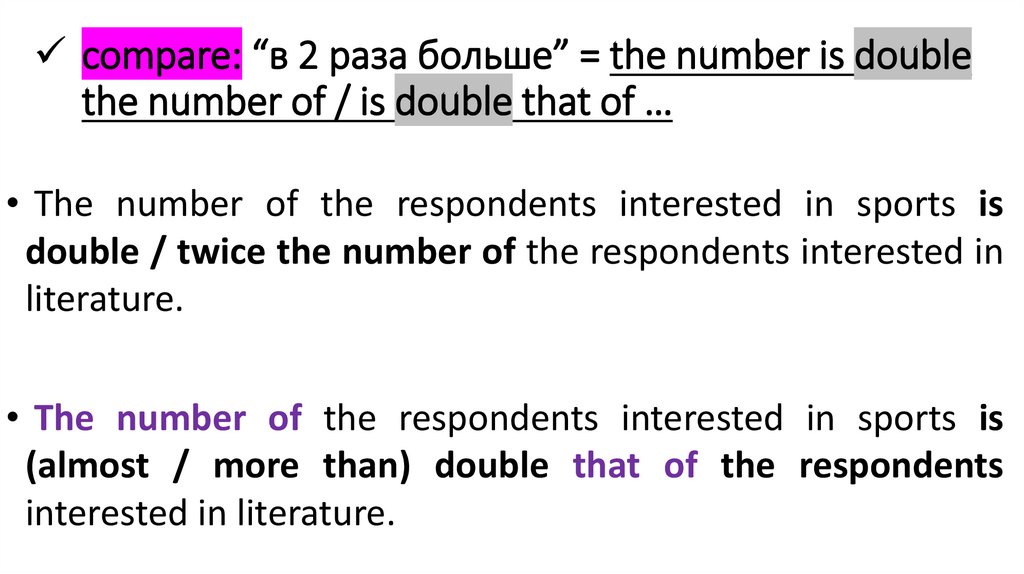
compare: “в 2 раза больше” = the number is doublethe number of / is double that of …
• The number of the respondents interested in sports is
double / twice the number of the respondents interested in
literature.
• The number of the respondents interested in sports is
(almost / more than) double that of the respondents
interested in literature.
84.
compare: “в 3 (4, … ) раза больше”:three / four times as adj. as
• Adventure stories are three times as popular as romance.
• Using smartphones for communication is four times as
common as using them for sending and receiving emails.
• Language of tuition is given as a reason by nearly five times as
many students as good language support, at 95% and 20%
respectively.
85.
compare: “в 3 (4,5 … ) раза больше”:three / four / five times as many teenagers as
• Language of tuition is given as the key reason by nearly five
times as many students as good language support, at 95% and
20% respectively.
86.
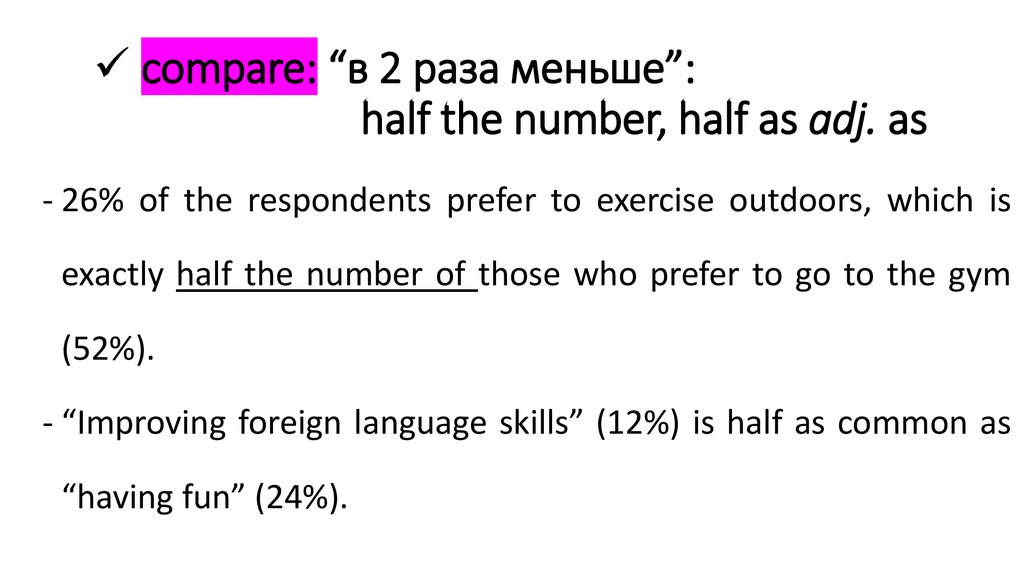
compare: “в 2 раза меньше”:half the number, half as adj. as
- 26% of the respondents prefer to exercise outdoors, which is
exactly half the number of those who prefer to go to the gym
(52%).
- “Improving foreign language skills” (12%) is half as common as
“having fun” (24%).
87.
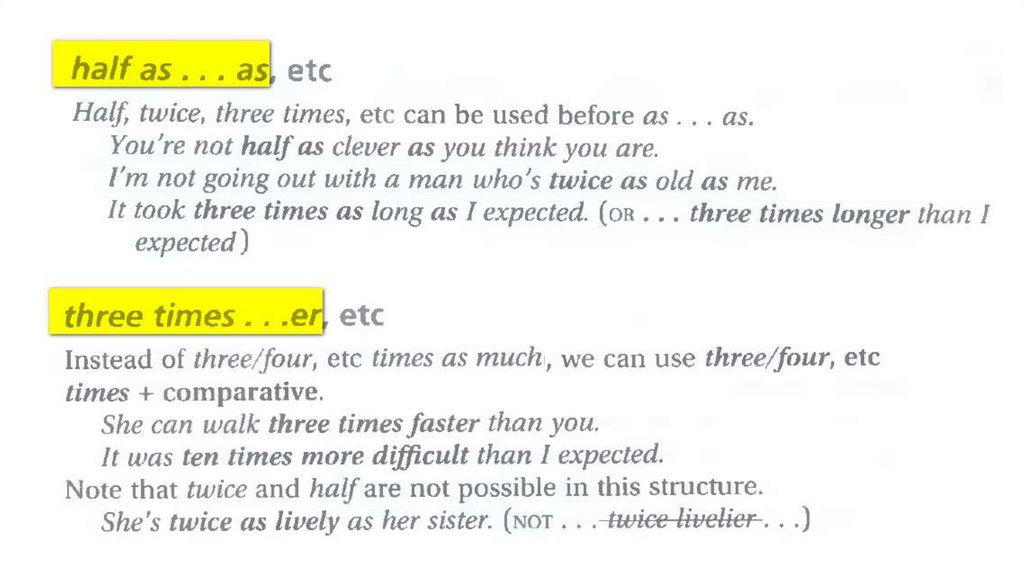
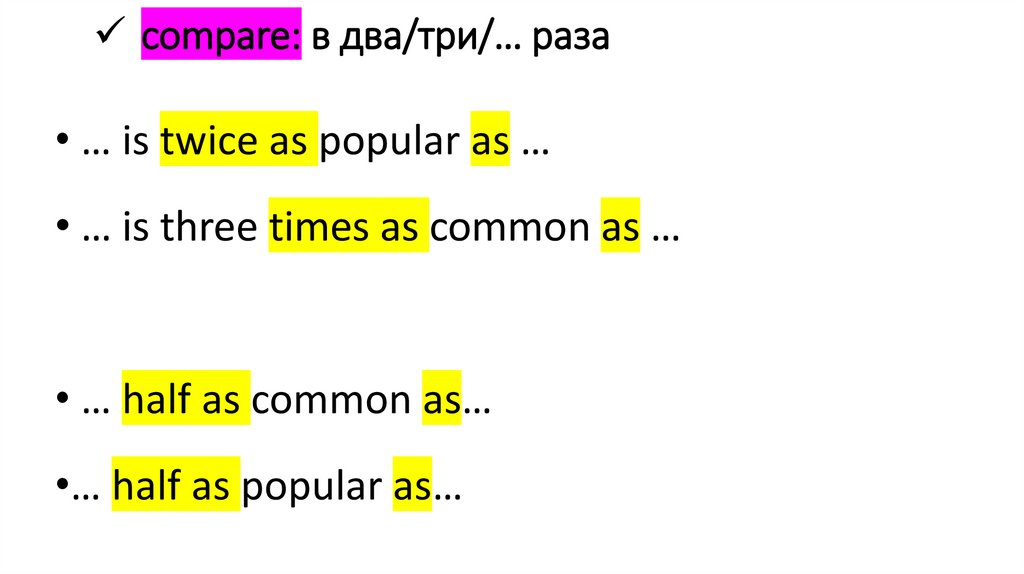
88.
compare: в два/три/… раза• … is twice as popular as …
• … is three times as common as …
• … half as common as…
•… half as popular as…
89.
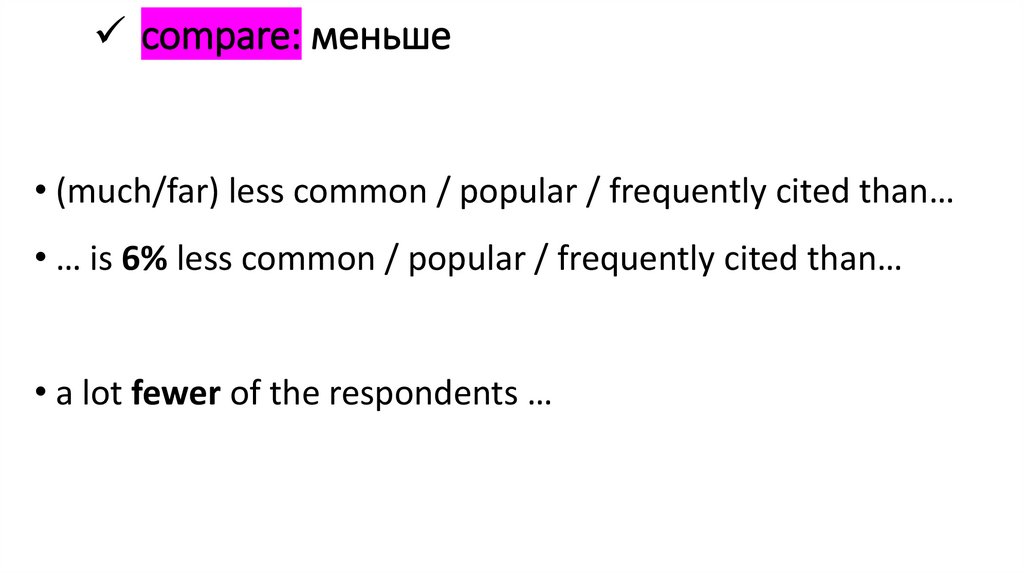
compare: меньше• (much/far) less common / popular / frequently cited than…
• … is 6% less common / popular / frequently cited than…
• a lot fewer of the respondents …
90.
как прокомментировать сравнение:• Эмоциональный отклик:
- Unfortunately, … Regrettably, … Sadly, …
- It is encouraging to note that …
• Личная оценка
- Surprisingly, … / Predictably, … / Interestingly, … It is interesting to
note…
- The results confirm that … / The results are in solid agreement with
the information I have found in other sources and indicate that …
91.
как прокомментировать сравнение:• Объяснение как вывод (умозаключение):
- I think this is explained by the fact that…
- I think this is due to the fact that …
- I think the reason is that …
- This suggests / means that …
• Объяснение как предположение:
- This is probably because … / This might be because …
- This is likely to result in … / This can lead to …
92.
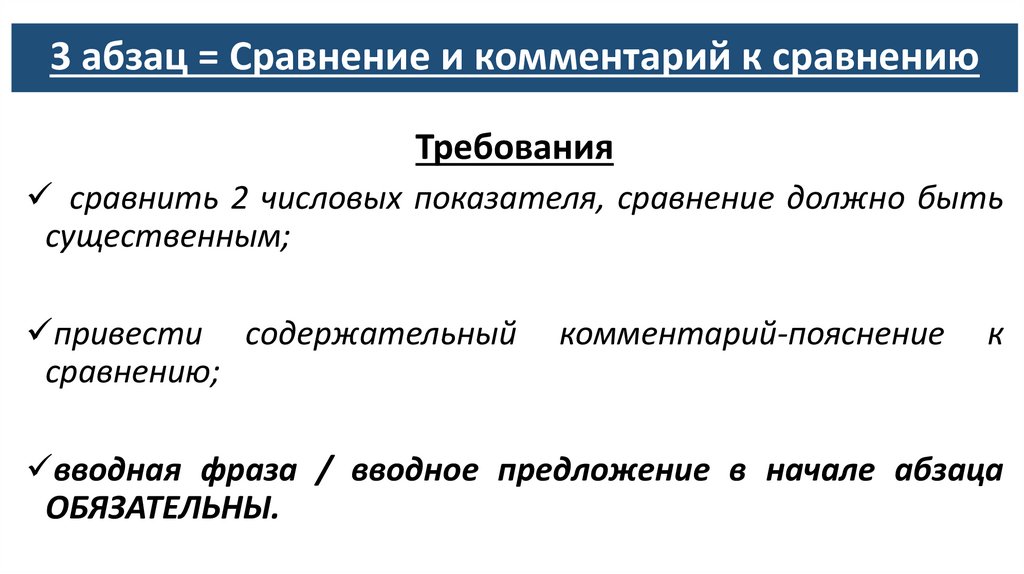
3 абзац = Сравнение и комментарий к сравнениюТребования
сравнить 2 числовых показателя, сравнение должно быть
существенным;
привести содержательный
сравнению;
комментарий-пояснение
к
вводная фраза / вводное предложение в начале абзаца
ОБЯЗАТЕЛЬНЫ.
93.
3 абзацПримеры:
94.
Комментарий к сравнению (1):• Делают, выбирают … -> потому что больше нравится,
предпочитают одно другому, более популярно
95.
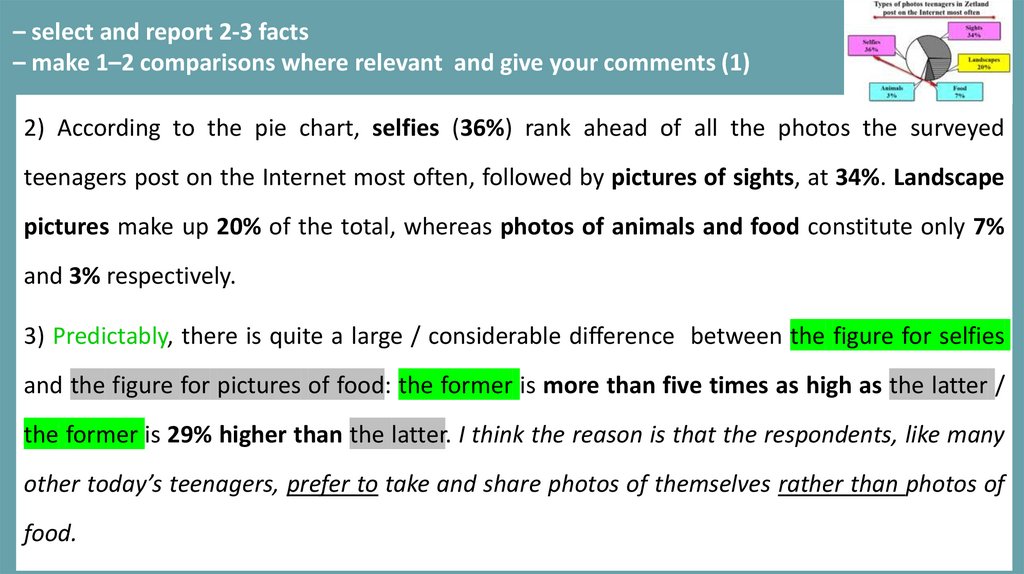
– select and report 2-3 facts– make 1–2 comparisons where relevant and give your comments (1)
2) According to the pie chart, selfies (36%) rank ahead of all the photos the surveyed
teenagers post on the Internet most often, followed by pictures of sights, at 34%. Landscape
pictures make up 20% of the total, whereas photos of animals and food constitute only 7%
and 3% respectively.
3) Predictably, there is quite a large / considerable difference between the figure for selfies
and the figure for pictures of food: the former is more than five times as high as the latter /
the former is 29% higher than the latter. I think the reason is that the respondents, like many
other today’s teenagers, prefer to take and share photos of themselves rather than photos of
food.
96.
– make 1–2 comparisons where relevantand give your comments (2)
97.
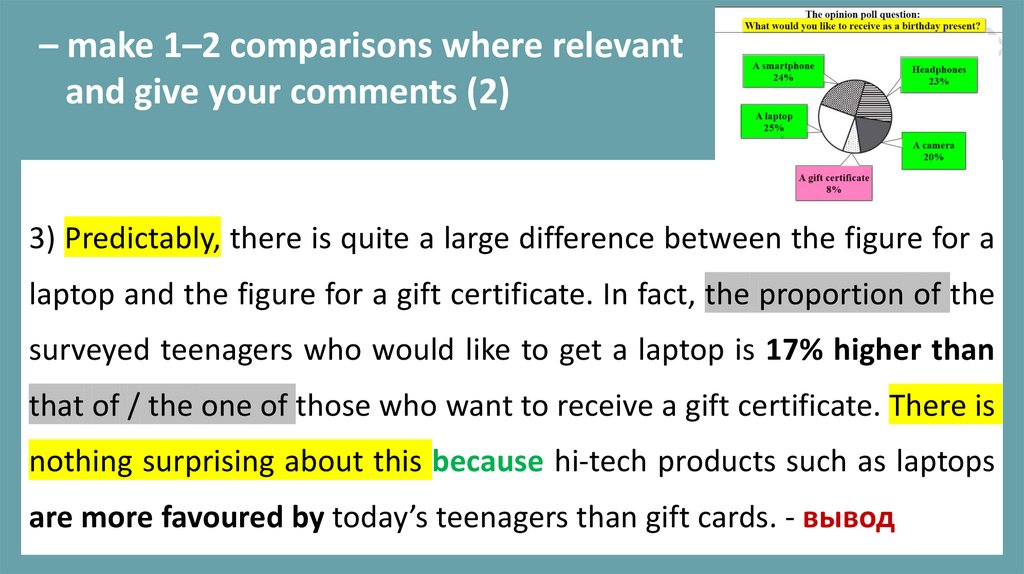
– make 1–2 comparisons where relevantand give your comments (2)
3) Predictably, there is quite a large difference between the figure for a
laptop and the figure for a gift certificate. In fact, the proportion of the
surveyed teenagers who would like to get a laptop is 17% higher than
that of / the one of those who want to receive a gift certificate. There is
nothing surprising about this because hi-tech products such as laptops
are more favoured by today’s teenagers than gift cards. - вывод
98.
– make 1–2 comparisons where relevantand give your comments (2)
3) Predictably, there is quite a large difference between the figure
for a laptop and the figure for a gift certificate: the former is 17%
higher than the latter. There is nothing surprising about this
because hi-tech products such as laptops are more favoured by
today’s teenagers than gift cards. - вывод
99.
– make 1–2 comparisons where relevantand give your comments (3)
100.
– make 1–2 comparisons where relevantand give your comments (3)
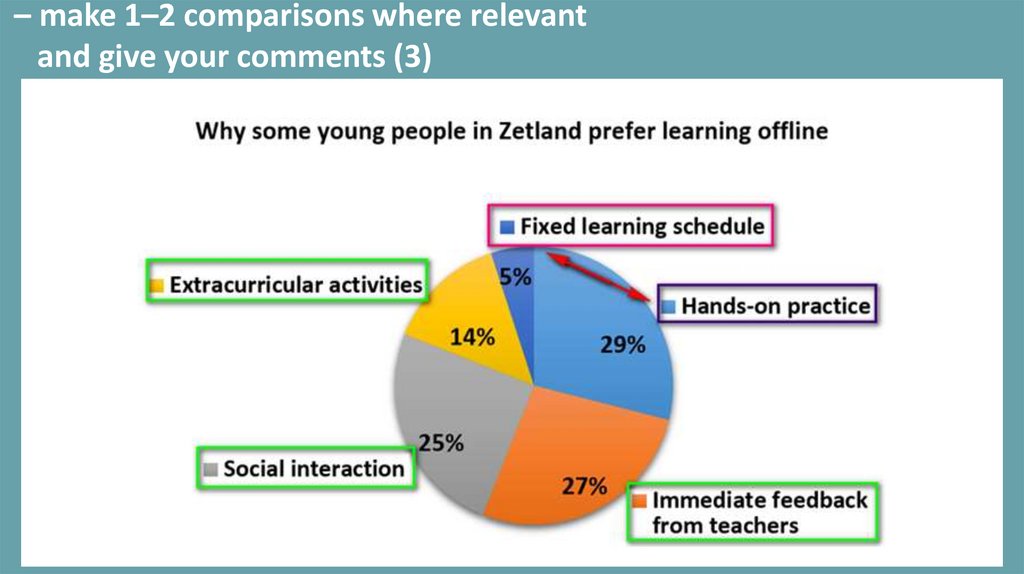
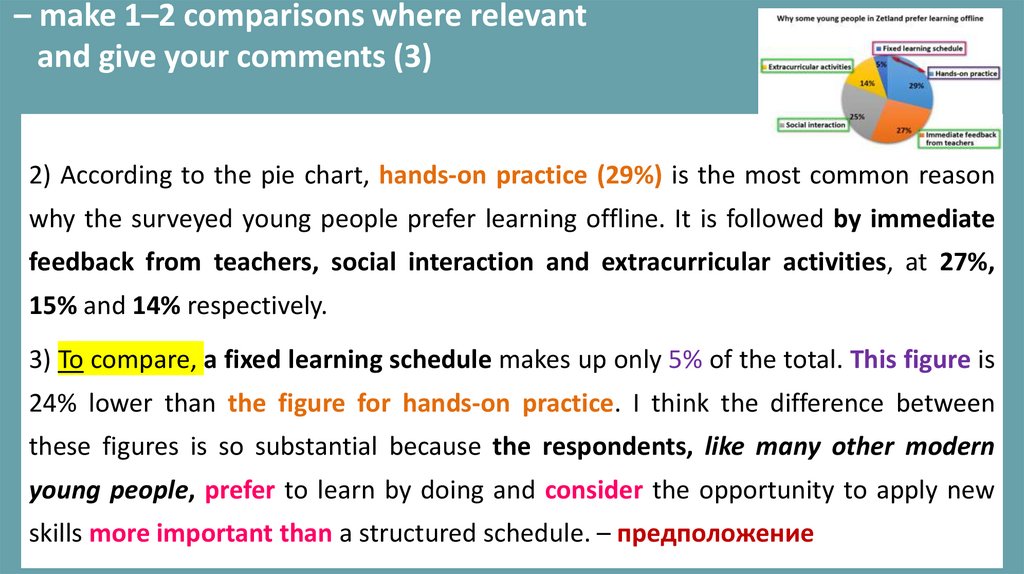
2) According to the pie chart, hands-on practice (29%) is the most common reason
why the surveyed young people prefer learning offline. It is followed by immediate
feedback from teachers, social interaction and extracurricular activities, at 27%,
15% and 14% respectively.
3) To compare, a fixed learning schedule makes up only 5% of the total. This figure is
24% lower than the figure for hands-on practice. I think the difference between
these figures is so substantial because the respondents, like many other modern
young people, prefer to learn by doing and consider the opportunity to apply new
skills more important than a structured schedule. – предположение
101.
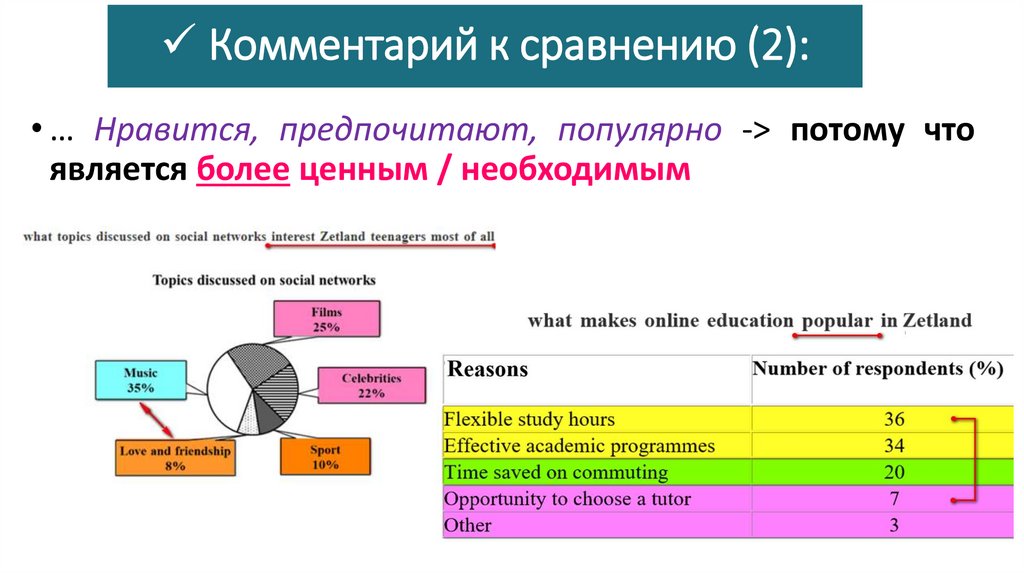
Комментарий к сравнению (2):• … Нравится, предпочитают, популярно -> потому что
является более ценным / необходимым
102.
– select and report 2-3 facts– make 1–2 comparisons where relevant
and give your comments (3)
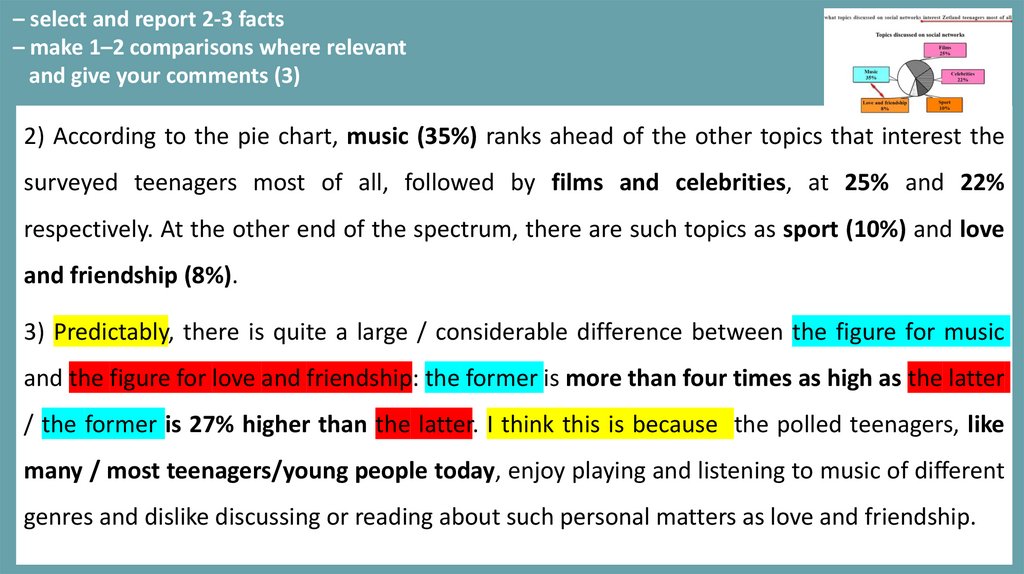
2) According to the pie chart, music (35%) ranks ahead of the other topics that interest the
surveyed teenagers most of all, followed by films and celebrities, at 25% and 22%
respectively. At the other end of the spectrum, there are such topics as sport (10%) and love
and friendship (8%).
3) Predictably, there is quite a large / considerable difference between the figure for music
and the figure for love and friendship: the former is more than four times as high as the latter
/ the former is 27% higher than the latter. I think this is because the polled teenagers, like
many / most teenagers/young people today, enjoy playing and listening to music of different
genres and dislike discussing or reading about such personal matters as love and friendship.
103.
– make 1–2 comparisons where relevantand give your comments (4)
3) Predictably, the figure for a laptop and the figure (the one for / that
for) for a smartphone are almost identical: the former is only 1% higher /
a mere 1% higher than the latter. There is nothing surprising about this
because hi-tech products such as laptops and smartphones play an
essential part in a modern teenager’s life and are equally important for
today’s teenagers.
104.
– make 1–2 comparisons where relevantand give your comments (5)
3) Predictably, there is quite a large difference between the figure for a laptop
and the figure for a gift certificate: the former is more than three times as high
as the latter / the former is 17% higher than the latter. There is nothing
surprising about this difference because hi-tech products such as laptops are
an essential part of modern teenagers’ lives, and the balance of a gift card is
usually not sufficient for buying something as expensive as a laptop.
105.
- Минимальнаяразница:
показатели
почти
идентичны,
одинаковы -> потому что (почти) одинаково важны, нужны,
любимы и т.п.
- Большая разница: показатели сильно разнятся -> потому что
одно
намного
более
полезное, чем другое.
любимое/интересное /
важное/
106.
– make 1–2 comparisons where relevantand give your comments (6)
107.
– make 1–2 comparisons where relevant and give your comments (6)2) According to the data, the respondents were asked, “Who is your favourite Russian
composer?” The two most common responses to this question are Pyotr Tchaikovsky and Igor
Stravinsky, at 30% and 29% respectively. Dmitri Shostakovich comes third with 21% of the
vote, and Sergei Prokofiev and Nikolai Rimsky-Korsakov rank the lowest, constituting 12% and
8% respectively.
3) Predictably, there is only a minor difference between the figure for Pyotr Tchaikovsky
and the figure for Igor Stravinsky: the former is a mere 1% higher than the latter. I do not
find this surprising because / I think the reason for this difference is that Pyotr Tchaikovsky
and Igor Stravinsky are two of the most popular composers of all time and both are
recognized internationally for their great musical masterpieces.
108.
– make 1–2 comparisons where relevant and give your comments (6)2) According to the data I have found for my project, the respondents were asked, “Who is your
favourite Russian composer?” The two most common responses to this question are Pyotr
Tchaikovsky and Igor Stravinsky, at 30% and 29% respectively. Dmitri Shostakovich comes third
with 21% of the vote, and Sergei Prokofiev and Nikolai Rimsky-Korsakov rank the lowest,
constituting 12% and 8 % respectively.
3) Interestingly, there is quite a considerable difference between the figure for Pyotr
Tchaikovsky and the figure for Nikolai Rimsky-Korsakov: the former is more than three times
as high as the latter / the former is 22% higher than the latter. I do not find this surprising
because / I think this is because / I think the reason behind this difference is that Pyotr
Tchaikovsky’s music is more recognized in the world and he is far more popular than Nikolai
Rimsky-Korsakov.
109.
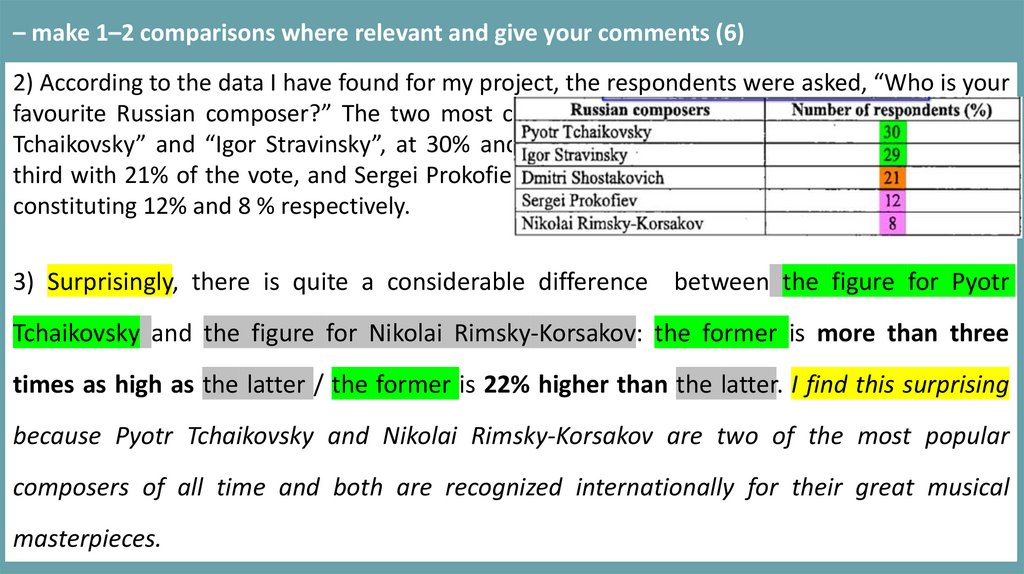
– make 1–2 comparisons where relevant and give your comments (6)2) According to the data I have found for my project, the respondents were asked, “Who is your
favourite Russian composer?” The two most common responses to this question are “Pyotr
Tchaikovsky” and “Igor Stravinsky”, at 30% and 29% respectively. Dmitri Shostakovich comes
third with 21% of the vote, and Sergei Prokofiev and Nikolai Rimsky-Korsakov rank the lowest,
constituting 12% and 8 % respectively.
3) Surprisingly, there is quite a considerable difference between the figure for Pyotr
Tchaikovsky and the figure for Nikolai Rimsky-Korsakov: the former is more than three
times as high as the latter / the former is 22% higher than the latter. I find this surprising
because Pyotr Tchaikovsky and Nikolai Rimsky-Korsakov are two of the most popular
composers of all time and both are recognized internationally for their great musical
masterpieces.