


 Финансы
Похожие презентации:


")

")


")

Lecture 4. Interval estimation – cont’d
1. Lecture 4
LECTURE 4INTERVAL ESTIMATION –
CONT’D
2. Confidence intervals for the difference between the means of two normal populations
CONFIDENCE INTERVALS FOR THE DIFFERENCEBETWEEN THE MEANS OF TWO NORMAL POPULATIONS
• An important problem in statistical inference deals with the comparison of two population means.
• As an example, a farmer may consider the use of two alternative fertilizers, his interest being in the difference
between the resulting mean crop yields per acre.
• To compare population means, a random sample is drawn from the two populations and an inference
about the difference between population means is based on the sample results. The appropriate
method for analyzing this information depends on the procedure used in selecting the samples. We
will consider the following two very common sampling schemes:
Matched Pairs
Independent Samples
3. Confidence intervals for the difference between the means of two normal populations: Matched Pairs
CONFIDENCE INTERVALS FOR THE DIFFERENCEBETWEEN THE MEANS OF TWO NORMAL POPULATIONS:
MATCHED PAIRS
• In this scheme, the sample members are chosen in pairs, one from each population. The idea is that, apart
from the factor under study, the members of these pairs should resemble one another as closely as possible
so that the comparison of interest can be made directly.
• For instance, suppose that we want to measure the effectiveness of a speed-reading course. One possible
approach would be to record the number of words per minute read by a sample of students before taking
the course and compare with results for the same students after completing the course. In this case, each
pair of observations consists of before and after measurements on a single student.
4. Confidence intervals based on matched pairs
CONFIDENCE INTERVALS BASED ON MATCHED PAIRS5.
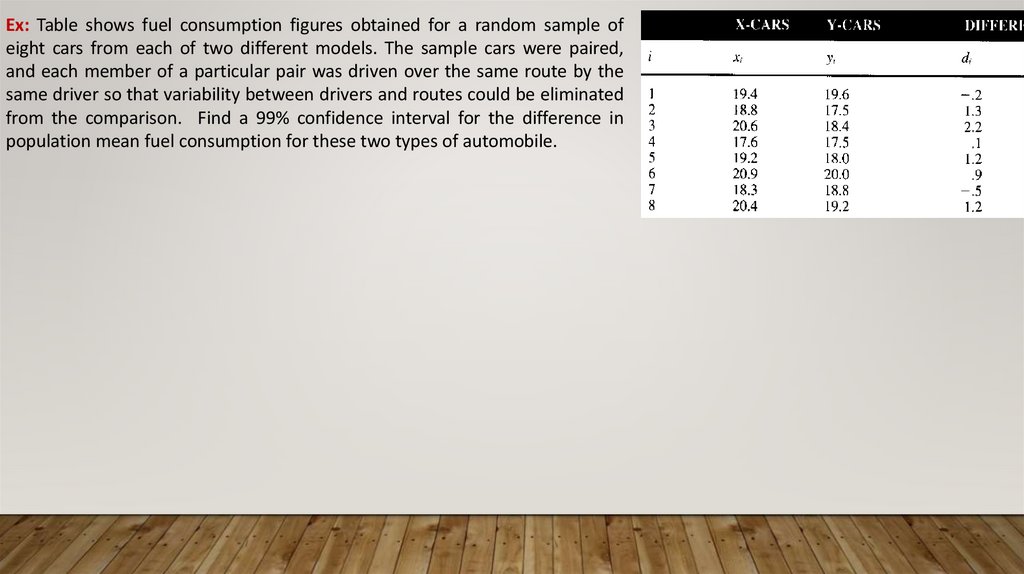
Ex: Table shows fuel consumption figures obtained for a random sample ofeight cars from each of two different models. The sample cars were paired,
and each member of a particular pair was driven over the same route by the
same driver so that variability between drivers and routes could be eliminated
from the comparison. Find a 99% confidence interval for the difference in
population mean fuel consumption for these two types of automobile.
6.
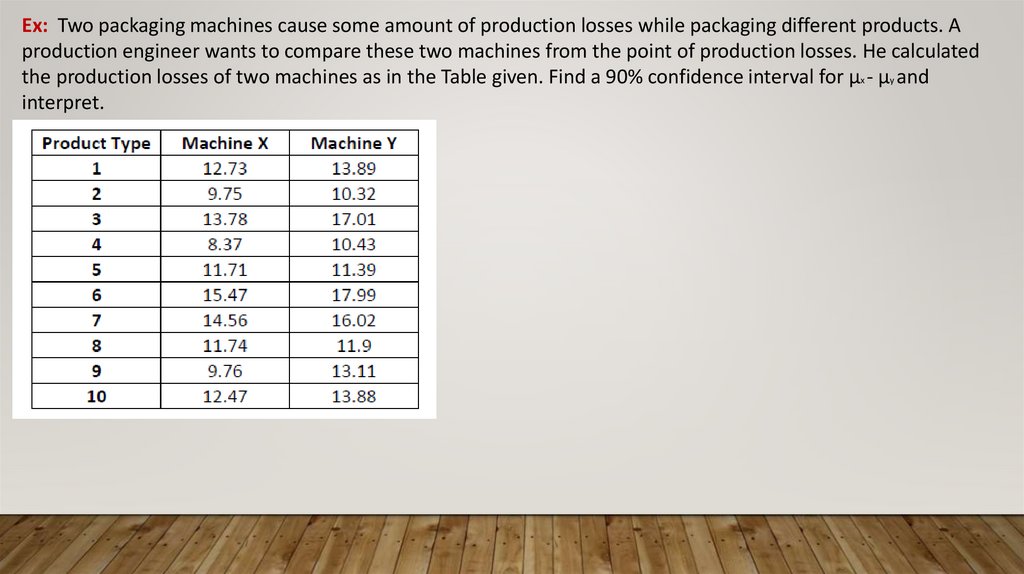
Ex: Two packaging machines cause some amount of production losses while packaging different products. Aproduction engineer wants to compare these two machines from the point of production losses. He calculated
the production losses of two machines as in the Table given. Find a 90% confidence interval for μx - μy and
interpret.
7. ConfIdence Intervals for the dIfference between the means of two normal populatIons: Independent Samples
CONFIDENCE INTERVALS FOR THE DIFFERENCE BETWEEN THEMEANS OF TWO NORMAL POPULATIONS:
INDEPENDENT SAMPLES
• In this scheme, samples are drawn independently from two populations of interest
so that the membership of one sample is not influenced by that of another.
8. Confidence intervals based on independent sampleS: known variances oR large sample sizes
CONFIDENCE INTERVALS BASED ON INDEPENDENT SAMPLES:KNOWN VARIANCES OR LARGE SAMPLE SIZES
9.
Ex: For a random sample of 96 smokers, the mean amount of short-term absenteeism from work was 2.15 hours per month,and the sample st. deviation was 2.09 hours per month. For an independent random sample of 206 employees who had never
smoked , the mean amount of absenteeism was 1.69 hours per month, and the sample st. deviation was 1.91 hours per
month. Find a 99% confidence interval for the difference between the population means.
10.
Ex: For a random sample of 40 accounting students in a class using group learning techniques, the mean examination score was322.12 and the sample standard deviation was 54.53. For an independent random sample of 61 students in the same course
but in a class not using group learning techniques, the sample mean and standard deviation of the scores were 304.61 and
62.61, respectively. Find a 95% confidence interval for the difference between the two population mean scores and interpret
your result.
11. Confidence intervals for difference between the means of two normal populations: independent samples population variances equal
CONFIDENCE INTERVALS FOR DIFFERENCE BETWEEN THE MEANS OF TWONORMAL POPULATIONS: INDEPENDENT SAMPLES
POPULATION VARIANCES EQUAL
12.
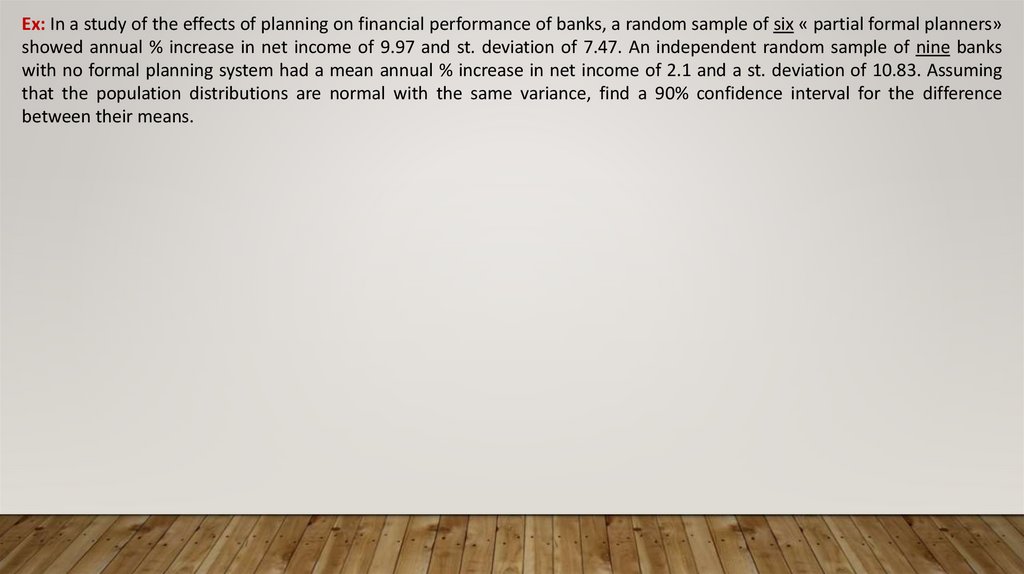
Ex: In a study of the effects of planning on financial performance of banks, a random sample of six « partial formal planners»showed annual % increase in net income of 9.97 and st. deviation of 7.47. An independent random sample of nine banks
with no formal planning system had a mean annual % increase in net income of 2.1 and a st. deviation of 10.83. Assuming
that the population distributions are normal with the same variance, find a 90% confidence interval for the difference
between their means.
13. CONFIDENCE INTERVALS FOR THE DIFFERENCE BETWEEN TWO POPULATION PROPORTIONS: LARGE SAMPLES
14.
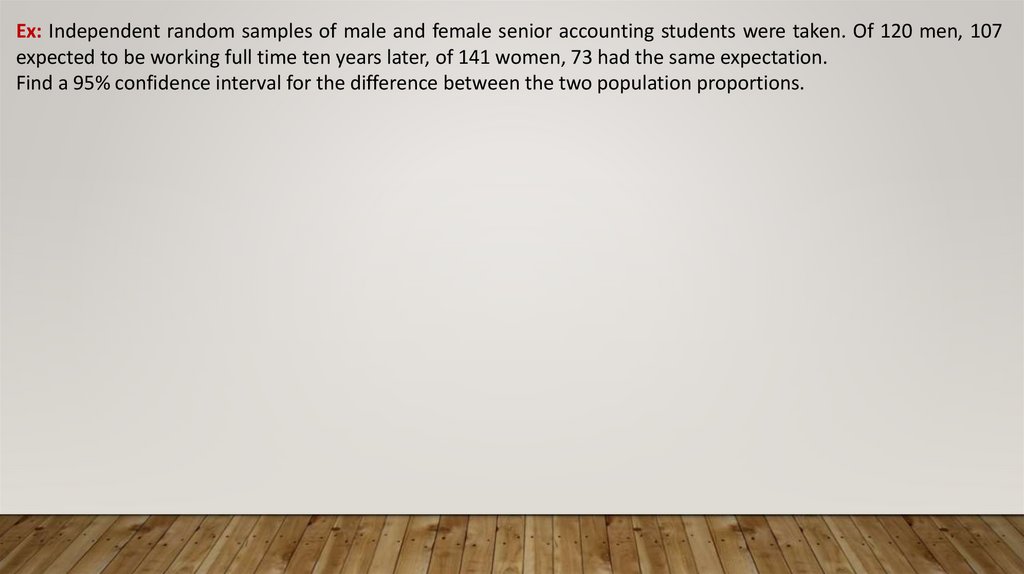
Ex: Independent random samples of male and female senior accounting students were taken. Of 120 men, 107expected to be working full time ten years later, of 141 women, 73 had the same expectation.
Find a 95% confidence interval for the difference between the two population proportions.
15.
ESTIMATING THE SAMPLE SIZE16.
• Typically, the only way to obtain a narrower interval with a given probabilitycontent is to take a large sample. In some circumstances, the investigator may be
able to fix in advance the width of the confidence interval, choosing a sample size
big enough to guarantee that width. In this section, we show how the sample size
can be chosen in this way for two estimation problems.
17. Intervals for the mean of a normal distribution: population variance known
INTERVALS FOR THE MEAN OF A NORMALDISTRIBUTION: POPULATION VARIANCE KNOWN
18.
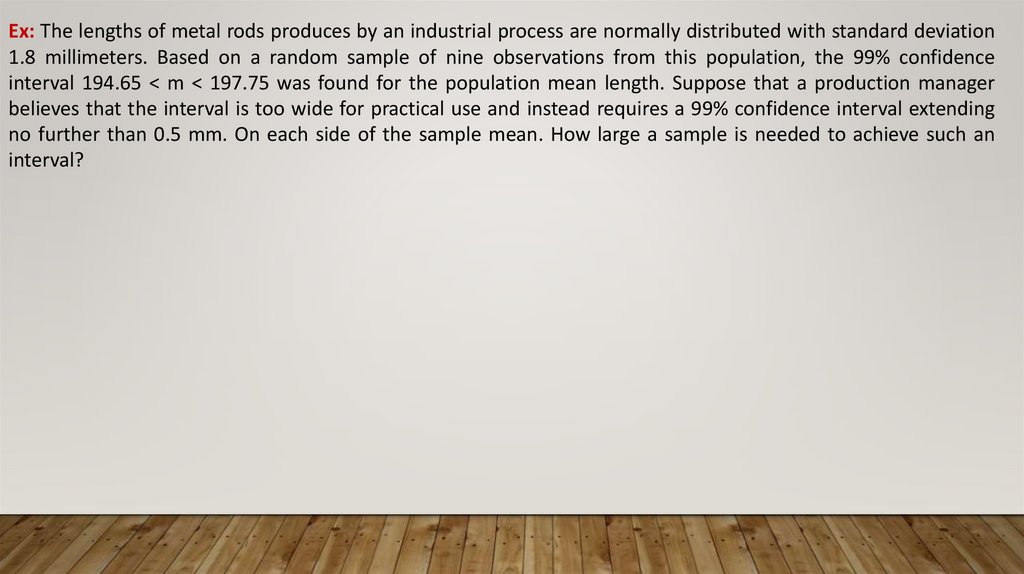
Ex: The lengths of metal rods produces by an industrial process are normally distributed with standard deviation1.8 millimeters. Based on a random sample of nine observations from this population, the 99% confidence
interval 194.65 < m < 197.75 was found for the population mean length. Suppose that a production manager
believes that the interval is too wide for practical use and instead requires a 99% confidence interval extending
no further than 0.5 mm. On each side of the sample mean. How large a sample is needed to achieve such an
interval?
19. Intervals for the population proportion
INTERVALS FOR THE POPULATION PROPORTION20.
Ex: A politician wants to estimate the proportion of constituents favoring a controversial piece of proposedlegislation. Suppose that a 99% confidence interval that extends at most 0.05 on each side of the sample
proportion is required. How many sample observations are needed?