


 Финансы
Похожие презентации:


")

")


Lecture 3. Interval estimation
1. Lecture 3
LECTURE 3INTERVAL ESTIMATION
2. Last Week
LAST WEEK• We considered the point estimation of an unknown population parameter – that is,
the production of a single number that in some sense is a «good bet».
• For most practical problems, a point estimate alone is inadequate.
3.
• For instance, suppose that a check on a random sample of parts from a largeshipment leads to the estimate that 10% of all the parts are defective.
• Faced with this figure, a manager is likely to ask such questions as :
• «Can I be fairly sure that the true percentage of defectives is between 5% and 15%?» or
• «Does it then seem very likely that between 9% and 11% of all the parts are defective?»
• Questions of this kind seek information beyond that contained in a single point
estimate; they are asking about the reliability of that estimate -> interval estimate:
a range of values in which the quantity to be estimated appears likely to lie.
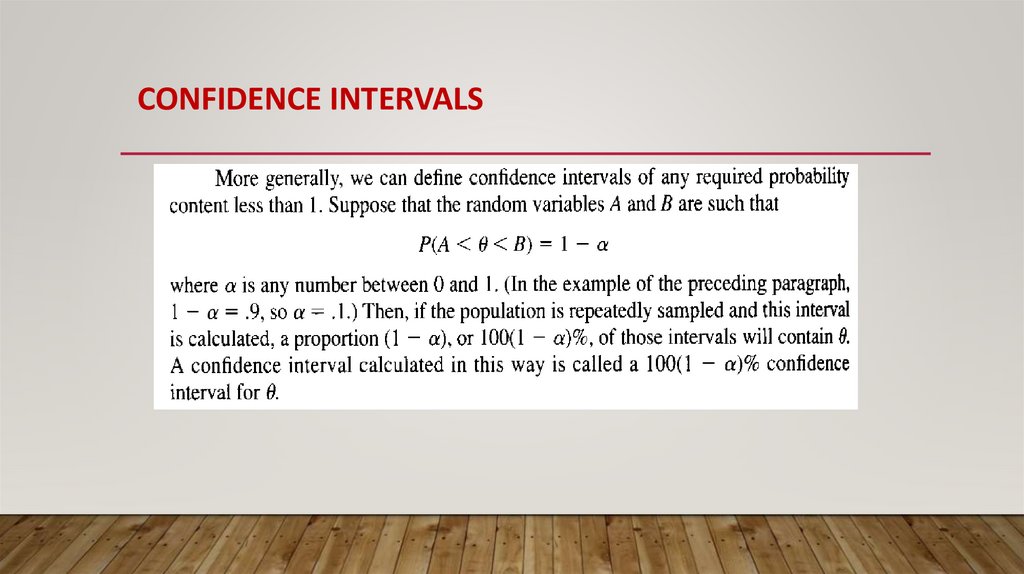
4. Confidence intervals
CONFIDENCE INTERVALS• The larger the sample size, ceteris paribus, the shorter will be the interval estimates that
reflect our uncertainty about a parameter’s true value.
• An interval estimator for a population parameter is a rule for determining (based on
sample information) a range, or interval, in which the parameter is likely to fall. The
corresponding estimate is called an interval estimate.
5. Confidence intervals
CONFIDENCE INTERVALS6.
CONFIDENCE INTERVALS7. Confidence intervals for the mean of a normal distribution: population variance known
CONFIDENCE INTERVALS FOR THE MEAN OF A NORMAL DISTRIBUTION:POPULATION VARIANCE KNOWN
8.
Ex: A random sample of 16 observations from a normal population with standard deviation 6has mean 25. Find a 90% confidence interval for the population mean.
9.
10.
11.
Ex: A process produces bas of refined sugars. The weights of the content of these bags are normally distributedwith standard dev. 1.2 ounces. The content of a random sample of 25 bags had mean weight 19.8 ounces.
Find a 95% confidence interval for the true mean weight for all bags of sugar produced by the progress.
12.
PROPERTIES:• For a given probability content and sample size, the bigger the
population’s standard deviation, the wider the confidence interval for the
population mean.
• For a given probability content and population standard deviation, the
bigger the sample size the narrower the confidence interval for the
population mean.
• For a given population standard deviation and sample size, the bigger the
probability content, the wider the confidence interval for the population
mean.
13.
14. Confidence intervals for the population mean: large sample sizes
CONFIDENCE INTERVALS FOR THE POPULATION MEAN:LARGE SAMPLE SIZES
15.
Ex: A random sample of 172 accounting students was asked to rate the importance of particular jobcharacteristics on a scale from one (not important) to five (extremely important). For «job security», the
sample mean rating was 4.38 and the sample standard deviation was 0.70. Find a 99% confidence interval
for the population mean.
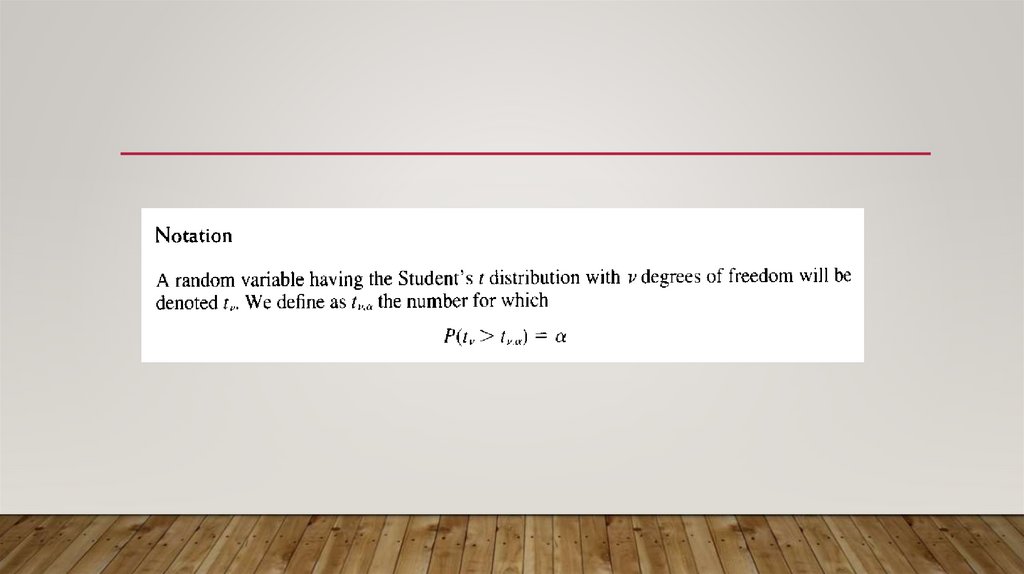
16. THE STUDENT’S T DISTRIBUTION
17.
18. CONFIDENCE INTERVALS FOR THE MEAN OF A NORMAL POPULATION: POPULATION VARIANCE UNKNOWN
19.
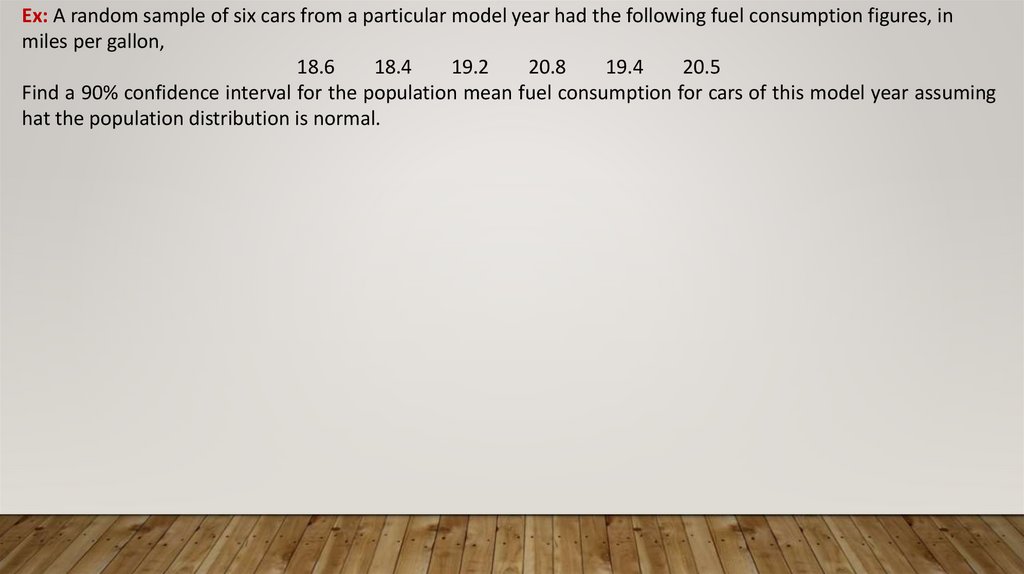
Ex: A random sample of six cars from a particular model year had the following fuel consumption figures, inmiles per gallon,
18.6
18.4
19.2
20.8
19.4
20.5
Find a 90% confidence interval for the population mean fuel consumption for cars of this model year assuming
hat the population distribution is normal.
20.
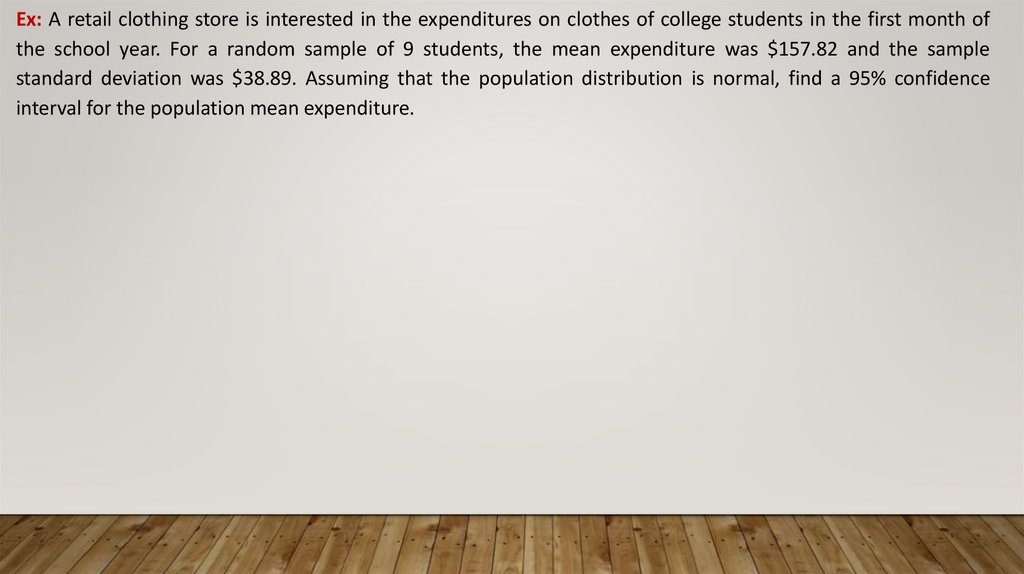
Ex: A retail clothing store is interested in the expenditures on clothes of college students in the first month ofthe school year. For a random sample of 9 students, the mean expenditure was $157.82 and the sample
standard deviation was $38.89. Assuming that the population distribution is normal, find a 95% confidence
interval for the population mean expenditure.
21.
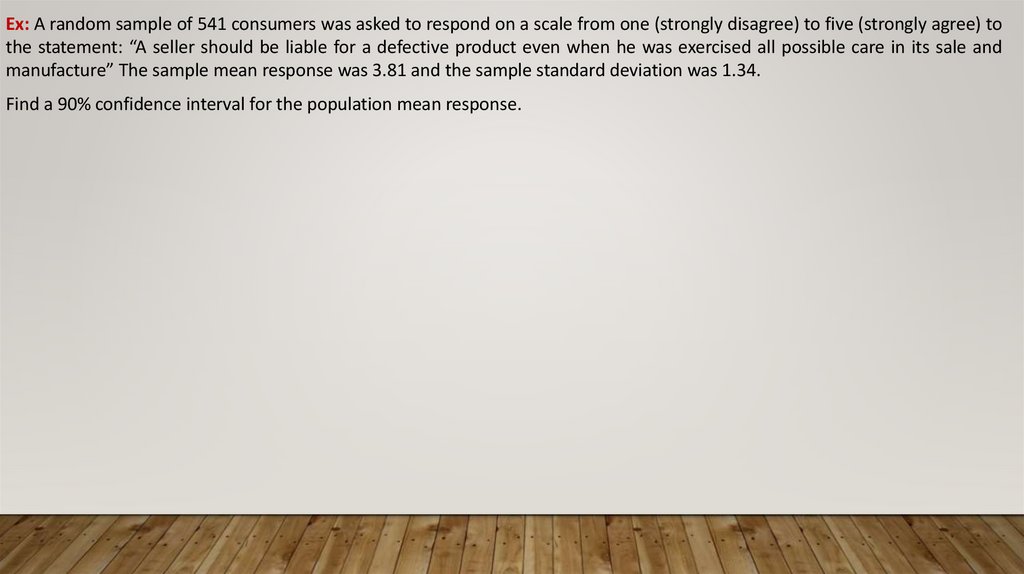
Ex: A random sample of 541 consumers was asked to respond on a scale from one (strongly disagree) to five (strongly agree) tothe statement: “A seller should be liable for a defective product even when he was exercised all possible care in its sale and
manufacture” The sample mean response was 3.81 and the sample standard deviation was 1.34.
Find a 90% confidence interval for the population mean response.
22.
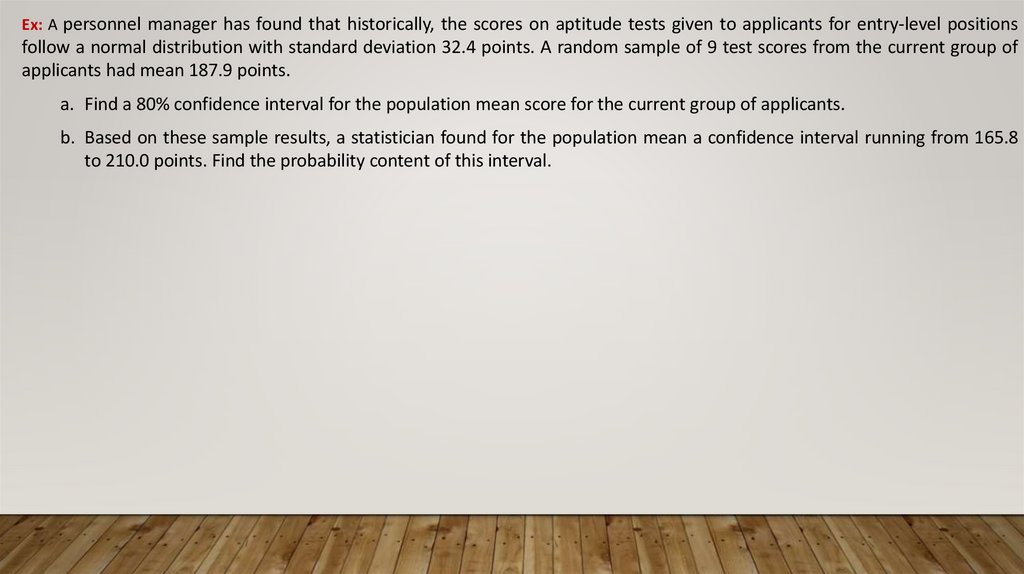
Ex: A personnel manager has found that historically, the scores on aptitude tests given to applicants for entry-level positionsfollow a normal distribution with standard deviation 32.4 points. A random sample of 9 test scores from the current group of
applicants had mean 187.9 points.
a. Find a 80% confidence interval for the population mean score for the current group of applicants.
b. Based on these sample results, a statistician found for the population mean a confidence interval running from 165.8
to 210.0 points. Find the probability content of this interval.