


 Информатика
Похожие презентации:


")


Project Hydra: OC-Sandbox for AMD & NVIDIA Eco-System
1.
PROJECT HYDRAOC-SANDBOX FOR AMD & NVIDIA ECO-SYSTEM
HYDRA 1.8H PRO IS ALREADY AVAILABLE FOR PATREON SUBSCRIBERS
1USMUS 2021-2025
2.
TABLE OF CONTENTSMISC SECTION
CPU SECTION
GPU SECTION
DRAM SECTION
WHAT IS HYDRA PROJECT?
CPU DIAGNOSTIC - EASY MOD
NVIDIA GPU DIAGNOSTIC - EASY MODE
DRAM
DIAGNOSTIC
-
PREPARATION
FEATURES FOR RYZEN
CPU DIAGNOSTIC - SETUP
NVIDIA GPU DIAGNOSTIC - SETUP (1)
DRAM
DIAGNOSTIC
-
SETUP
(1)
FEATURES FOR DRAM
CPU DIAGNOSTIC - SEARCH CORE AMD CO (1)
NVIDIA GPU DIAGNOSTIC - SETUP (2)
DRAM
DIAGNOSTIC
-
SETUP
(2)
FEATURES FOR NVIDIA
CPU DIAGNOSTIC - SEARCH CORE AMD CO (2)
NVIDIA GPU DIAGNOSTIC - TUNING PROCESS
DRAM DIAGNOSTIC - SETUP (3)
FEATURES FOR RADEON
CPU DIAGNOSTIC - SEARCH HOC CO
RTX/GTX-TUNER
OTHER MAJOR FUNCTIONS
CPU DIAGNOSTIC - PROFILE CREATION
RTX/GTX-TUNER - TAB (2)
REQUIREMENTS
CPU DIAGNOSTIC - PROCESS
NVIDIA GPU CORE CURVE CONTROL (1)
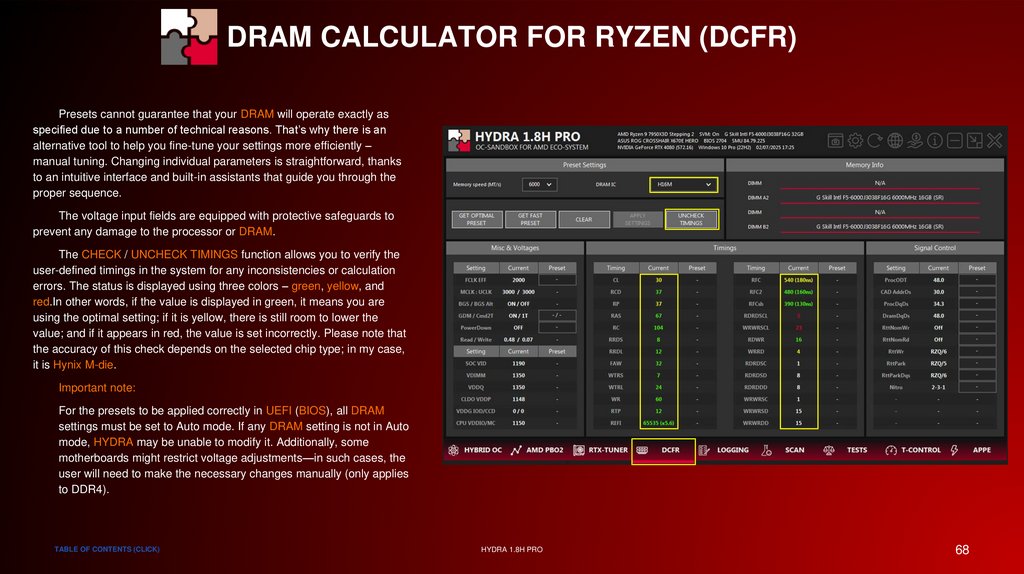
DRAM CALCULATOR FOR RYZEN (DCFR) (1)
VERSION COMPARISON
AMD PBO2 - TAB (1)
NVIDIA GPU CORE CURVE CONTROL (2)
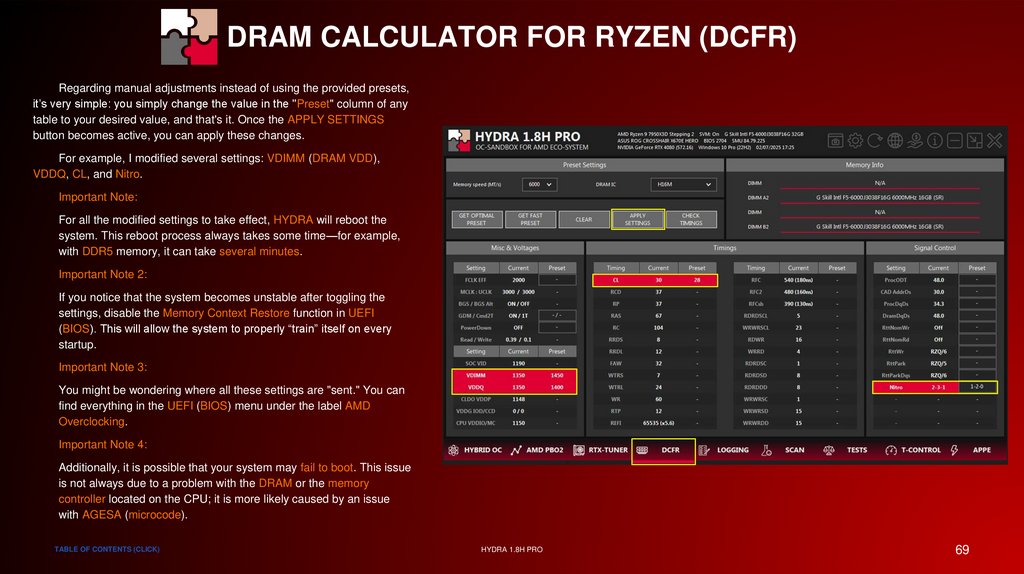
DRAM CALCULATOR FOR RYZEN (DCFR) (2)
AMD PBO2 - TAB (2)
NVIDIA GPU CORE CURVE CONTROL (3)
DRAM CALCULATOR FOR RYZEN (DCFR) (3)
NVIDIA GPU CORE CURVE BUILDER
T-CONTROL
(1)
HYBRID OC - TAB ?
T-CONTROL
(2)
HYBRID OC - ACTIVATION ?
T-CONTROL (3)
-
TAB
(1)
DRAM DIAGNOSTIC - TUNING PROCESS
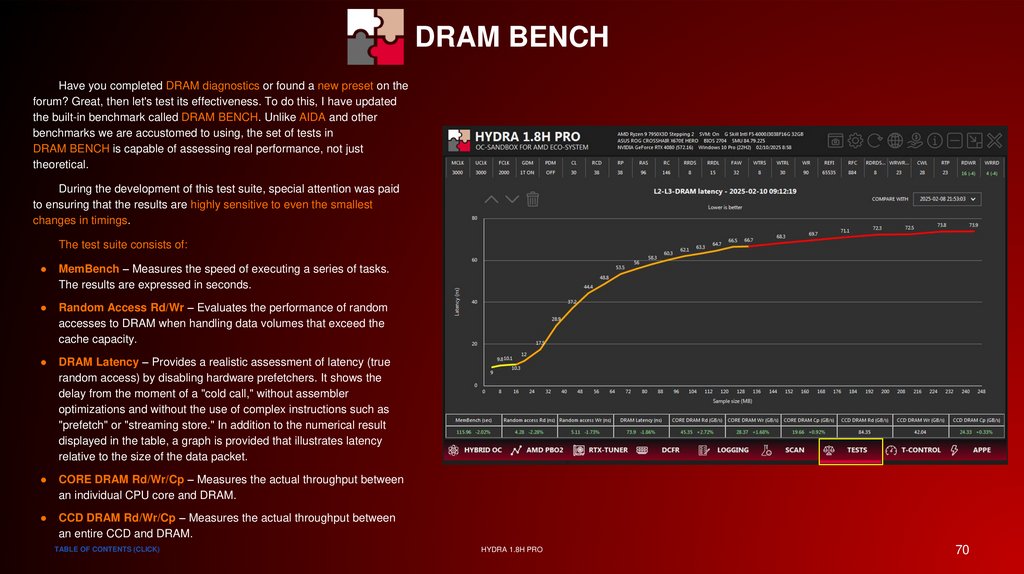
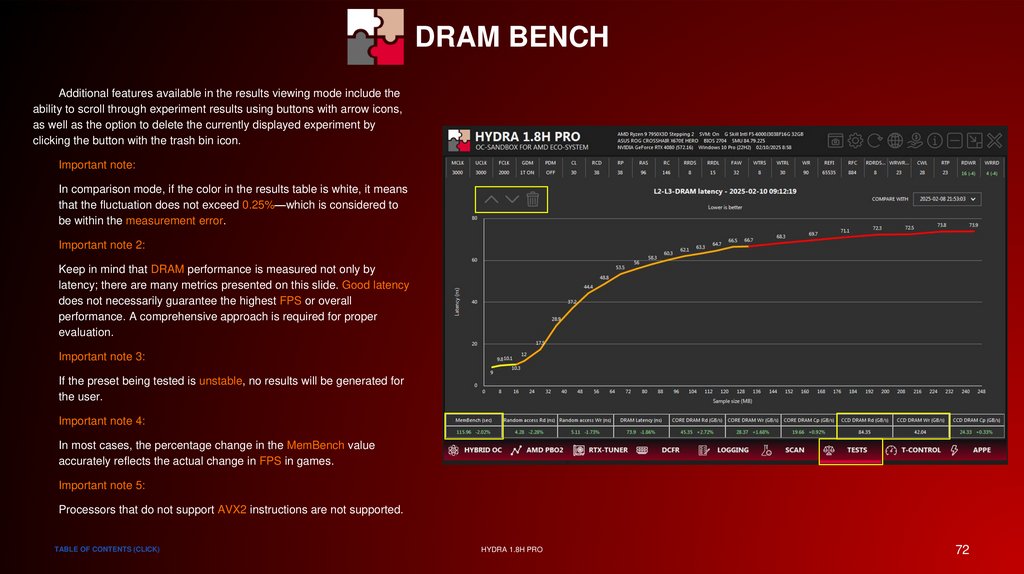
DRAM BENCH (1)
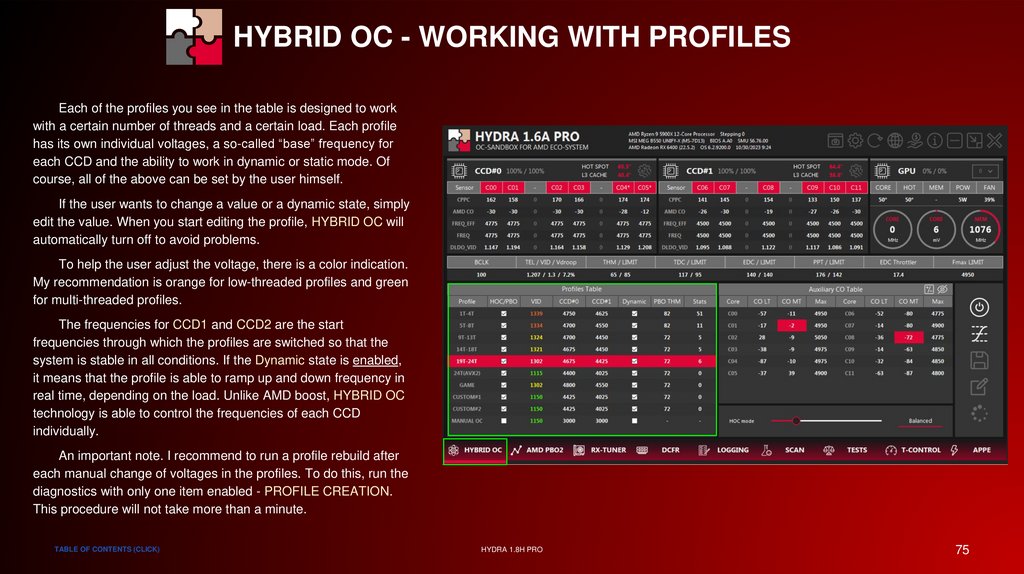
HYBRID OC - WORKING WITH PROFILES (1) ?
AMD GPU DIAGNOSTIC - EASY MODE
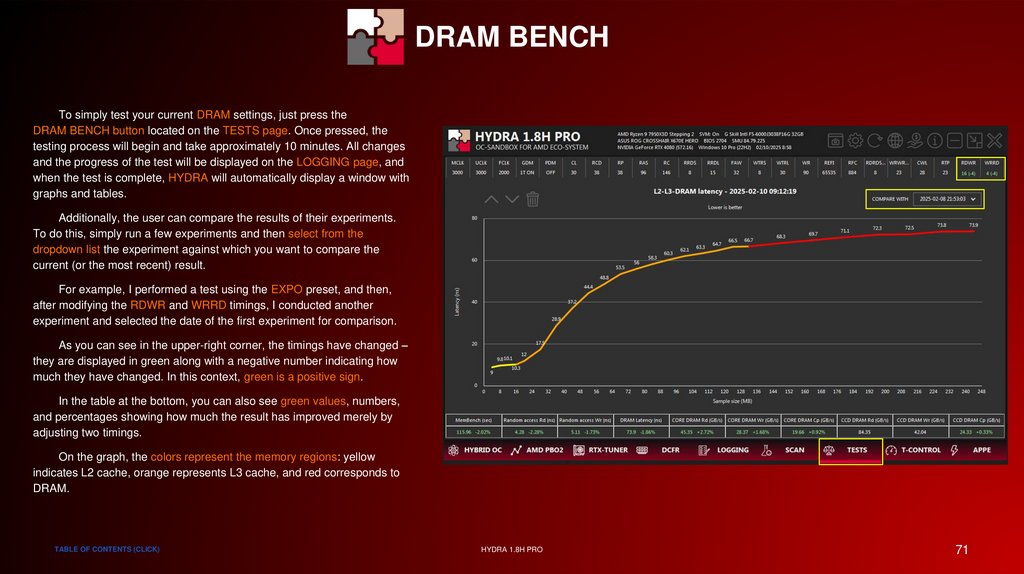
DRAM BENCH (2)
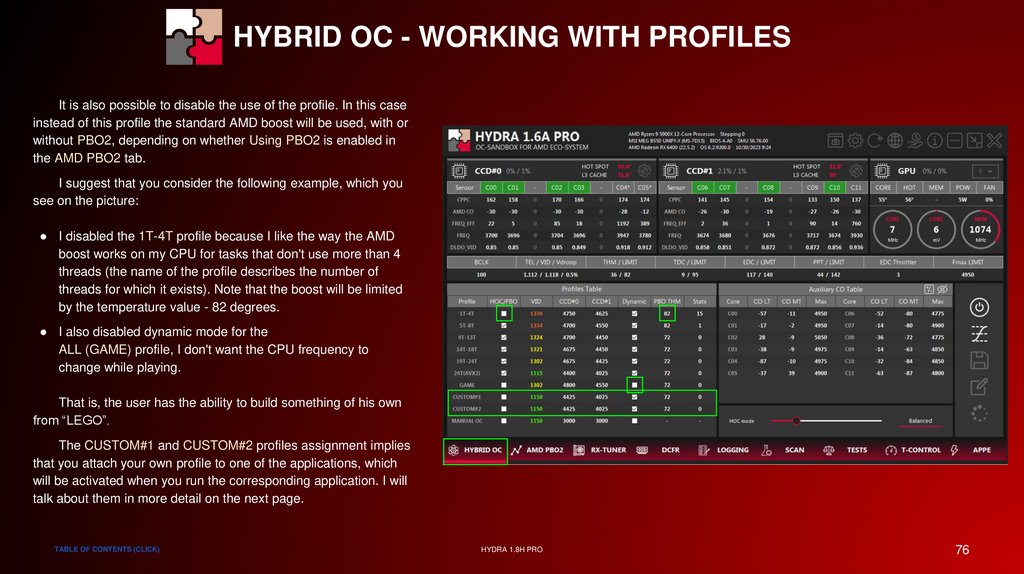
HYBRID OC - WORKING WITH PROFILES (2) ?
AMD GPU DIAGNOSTIC - SETUP (1)
DRAM
HYBRID OC - ADDITIONAL SETTINGS
AMD GPU DIAGNOSTIC - SETUP (2)
HYBRID OC - USER PROFILES
AMD GPU DIAGNOSTIC - SETUP (3)
HYBRID OC - PBO MODE
AMD GPU DIAGNOSTIC - TUNING PROCESS ?
HYBRID OC - HOC CO TABLE ?
RX-TUNER
BUILT-IN TESTS (1)
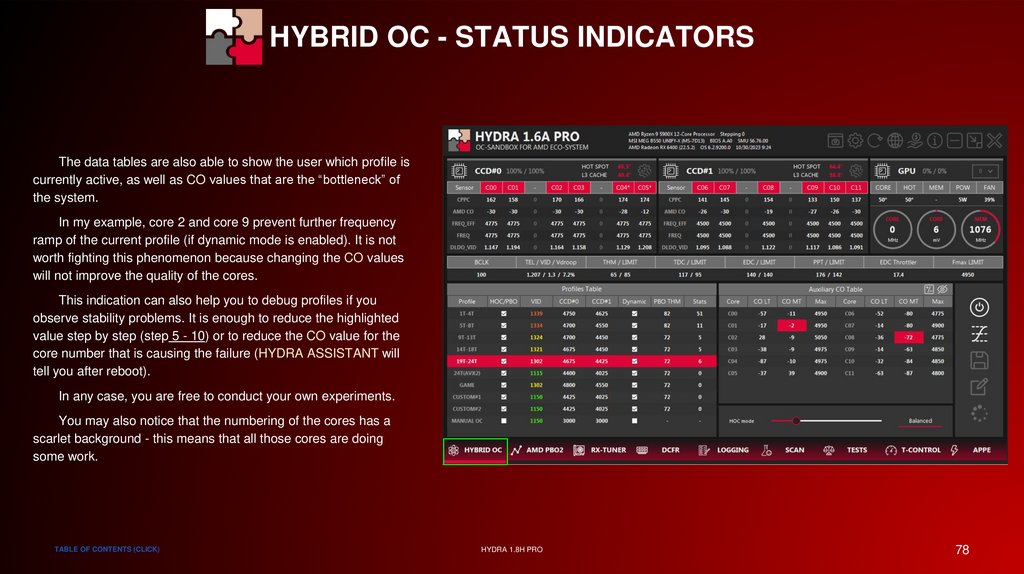
HYBRID OC - STATUS INDICATORS ?
RX-TUNER - SECRET SETTINGS
BUILT-IN TESTS (2)
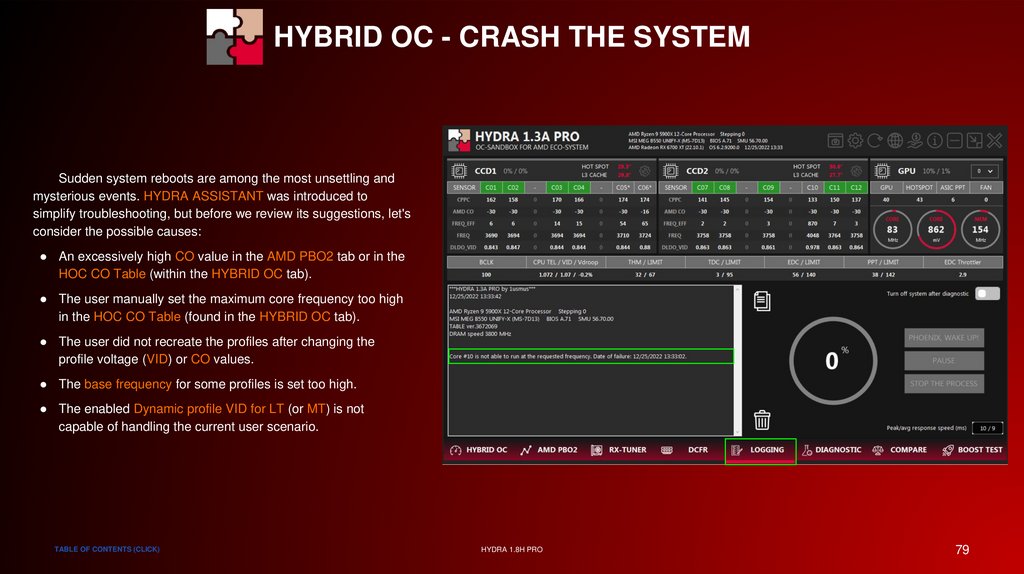
HYBRID OC - CRASH THE SYSTEM ?
PHOENIX
MANUAL OC
PCI-MUTEX HOLDING TIME HAS EXPIRED
SOME CPU TWEAKS
STABILITY PROBLEMS
CPU MONITORING CUSTOMIZATION
GAME IS NOT DETECTED
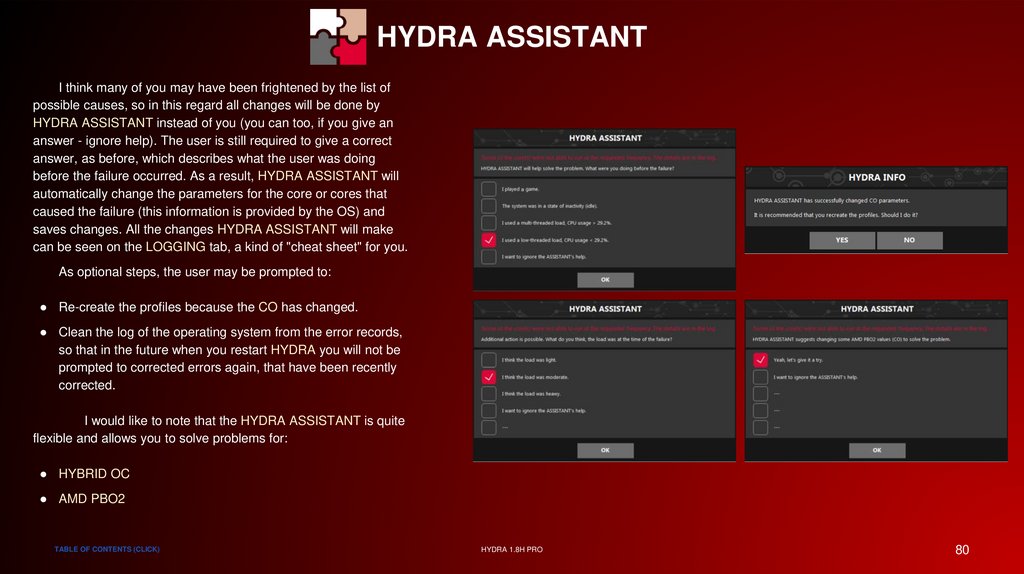
HYDRA ASSISTANT ?
ADVANCED POWER PLAN EDITOR
LOGGING IN .CSV
-
BENCH
(3)
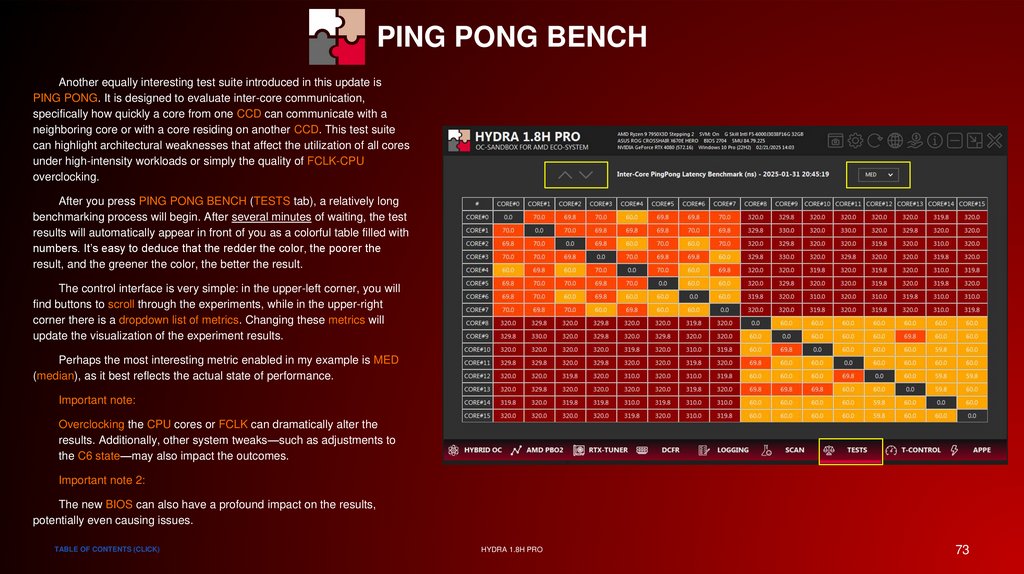
PING PONG BENCH
TAB
TDC / EDC / PPT / TEMPERATURE LIMIT REACHED
HYDRA 1.8H PRO
2
3.
SPECIAL THANKSMISC SECTION
TABLE OF CONTENTS (CLICK)
HYDRA 1.8H PRO
3
4.
WHAT IS HYDRA PROJECT?HYDRA project is a revolutionary overclocking tool designed specifically for modern NVIDIA and AMD graphics cards, Ryzen processors, and DRAM. HYDRA
delivers an entirely new level of system control: with its automated mode featuring an integrated assistant alongside the option for precise manual tuning, you
achieve unparalleled accuracy in reaching your desired performance. Whether you're aiming for extreme overclocking or striving for energy-efficient optimization,
HYDRA guarantees peak performance without compromising safety and stability.
Utilizing innovative algorithms, HYDRA automatically analyzes your hardware's potential, optimizes settings in real time, and provides an exclusive suite of
performance tests to evaluate your tuning results. HYDRA is not just software—it’s your key to unmatched performance and stability, opening new horizons for
both enthusiasts and professionals.
Every month, the project receives exclusive updates to keep it in tune with the latest hardware trends and technological innovations. These updates not only fix
identified issues but also add new tests, modules, and features to enhance your tuning experience. Additionally, an official Discord channel has been established
for support and discussion, where you can get assistance and share your experiences with other enthusiasts.
This guide provides a detailed walkthrough with practical examples, FAQs, and tips designed to ensure a comfortable introduction to the HYDRA software.
With comprehensive explanations and step-by-step instructions, every user will quickly master all the functionalities of the program and optimize their computer for
maximum efficiency. The FAQ section will help resolve common issues swiftly, while practical tips will assist in avoiding typical mistakes and make the tuning
process smoother and more productive.
TABLE OF CONTENTS (CLICK)
HYDRA 1.8H PRO
4
5.
FEATURES FOR RYZEN● AMD CO Auto-Tuning module:
Available in two modes – a "1-click" mode for quick setup or a professional mode for in-depth parameter control.
● HYBRID OC:
A hybrid overclocking solution that combines the capabilities of AMD CO with classic static overclocking and a set of user-defined rules to achieve optimal
performance.
● Performance comparison tests:
This module performs a comparative analysis of system performance across various states, allowing you to assess the effectiveness of your tuning.
● Manual Overclocking:
Provides the ability to manually adjust parameters to reach the desired level of overclocking.
● Full control of AMD PBO2 and eCLK from Windows:
Enables direct management of AMD PBO2 and eCLK settings right from the Windows operating system.
● Application profiling:
Allows you to create custom overclocking profiles for selected processes, ensuring maximum optimization.
● T-CONTROL:
Automatically manages the Windows task scheduler and leverages some exclusive OS features to deliver maximum performance and smooth frame rates in
games. It also supports user-defined application profiling.
● Detailed monitoring and logging of processor sensors:
Provides data collection with a polling period of less than 10ms, enabling high-precision tracking and analysis of processor performance.
TABLE OF CONTENTS (CLICK)
HYDRA 1.8H PRO
5
6.
FEATURES FOR DRAM● Automatic Timing Tuning, ODT searching (DDR5), and optional Undervolting of domains associated with DRAM operation:
This module provides automatic optimization of memory timings, including accurate ODT settings selection. It also offers the option for undervolting specific
domains that impact DRAM performance, ensuring enhanced stability and efficiency.
● DCFR - DRAM Calculator for Ryzen:
A module that helps in accurately selecting the timings for your DRAM. It offers ready-to-use presets, full control over all known DRAM parameters, and
exceptionally detailed monitoring for maximum tuning precision.
● CHECK MY MEM:
A module that employs a series of tests to verify the stability of the DRAM. It provides a quick check for errors and confirms the reliability of the DRAM under
various operating conditions.
● DRAM BENCH:
A comprehensive L2-L3-DRAM benchmarking tool that allows for comparing results and memory settings. It consists of a series of tests designed to determine
the actual performance of the memory or the performance change resulting from adjusting one or more timings. It includes an unlimited history of experiments
for thorough analysis.
TABLE OF CONTENTS (CLICK)
HYDRA 1.8H PRO
6
7.
FEATURES FOR NVIDIA● Automatic Overclocking or Undervolting module for Core and VRAM:
Available in two modes – a "1-click" mode for quick setup or a professional mode for in-depth parameter control.
● Core Curve creation and editing module with visual feedback:
Provides intuitive control over the Сore Curve. With an interactive interface, users can easily create, edit, and monitor changes in the Core Curve, enabling
them to achieve optimal performance settings.
● Application profiling:
Offers the ability to create custom profiles for applications, with support for simultaneous operation of up to 6 GPUs, ensuring task-specific optimization.
● Manual Overclocking:
Provides flexible and precise adjustment of settings to achieve maximum performance, allowing users to experiment with various configurations.
● GPU Sensor Monitoring:
Delivers real-time monitoring of key GPU parameters, including temperature, power consumption, frequencies, and fan speed, to provide the most accurate
insights into its performance.
● Performance comparison test (with and without optimization):
This test enables you to compare system performance before and after applying optimization settings, providing a clear understanding of the actual
performance gains.
TABLE OF CONTENTS (CLICK)
HYDRA 1.8H PRO
7
8.
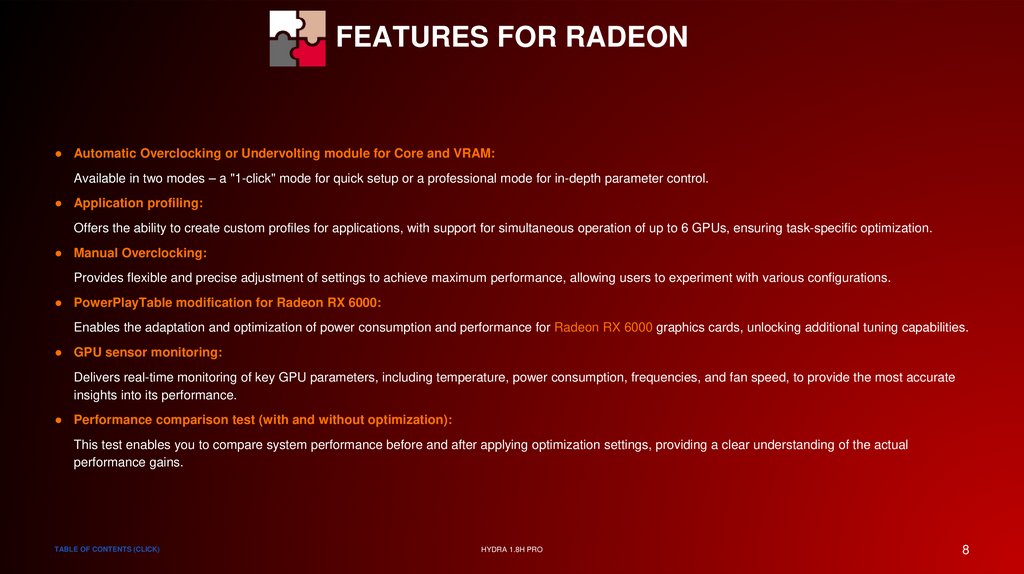
FEATURES FOR RADEON● Automatic Overclocking or Undervolting module for Core and VRAM:
Available in two modes – a "1-click" mode for quick setup or a professional mode for in-depth parameter control.
● Application profiling:
Offers the ability to create custom profiles for applications, with support for simultaneous operation of up to 6 GPUs, ensuring task-specific optimization.
● Manual Overclocking:
Provides flexible and precise adjustment of settings to achieve maximum performance, allowing users to experiment with various configurations.
● PowerPlayTable modification for Radeon RX 6000:
Enables the adaptation and optimization of power consumption and performance for Radeon RX 6000 graphics cards, unlocking additional tuning capabilities.
● GPU sensor monitoring:
Delivers real-time monitoring of key GPU parameters, including temperature, power consumption, frequencies, and fan speed, to provide the most accurate
insights into its performance.
● Performance comparison test (with and without optimization):
This test enables you to compare system performance before and after applying optimization settings, providing a clear understanding of the actual
performance gains.
TABLE OF CONTENTS (CLICK)
HYDRA 1.8H PRO
8
9.
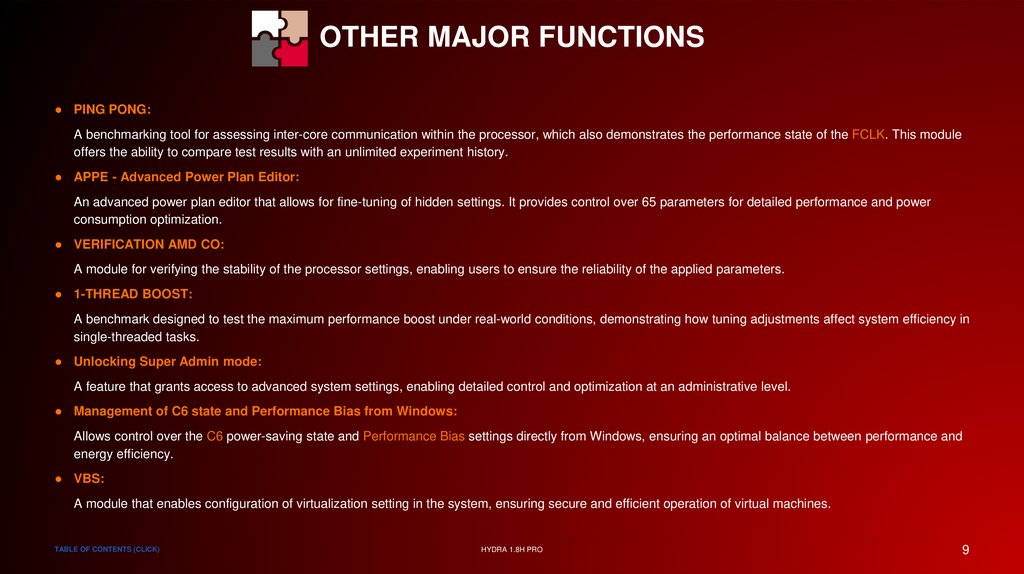
OTHER MAJOR FUNCTIONS● PING PONG:
A benchmarking tool for assessing inter-core communication within the processor, which also demonstrates the performance state of the FCLK. This module
offers the ability to compare test results with an unlimited experiment history.
● APPE - Advanced Power Plan Editor:
An advanced power plan editor that allows for fine-tuning of hidden settings. It provides control over 65 parameters for detailed performance and power
consumption optimization.
● VERIFICATION AMD CO:
A module for verifying the stability of the processor settings, enabling users to ensure the reliability of the applied parameters.
● 1-THREAD BOOST:
A benchmark designed to test the maximum performance boost under real-world conditions, demonstrating how tuning adjustments affect system efficiency in
single-threaded tasks.
● Unlocking Super Admin mode:
A feature that grants access to advanced system settings, enabling detailed control and optimization at an administrative level.
● Management of C6 state and Performance Bias from Windows:
Allows control over the C6 power-saving state and Performance Bias settings directly from Windows, ensuring an optimal balance between performance and
energy efficiency.
● VBS:
A module that enables configuration of virtualization setting in the system, ensuring secure and efficient operation of virtual machines.
TABLE OF CONTENTS (CLICK)
HYDRA 1.8H PRO
9
10.
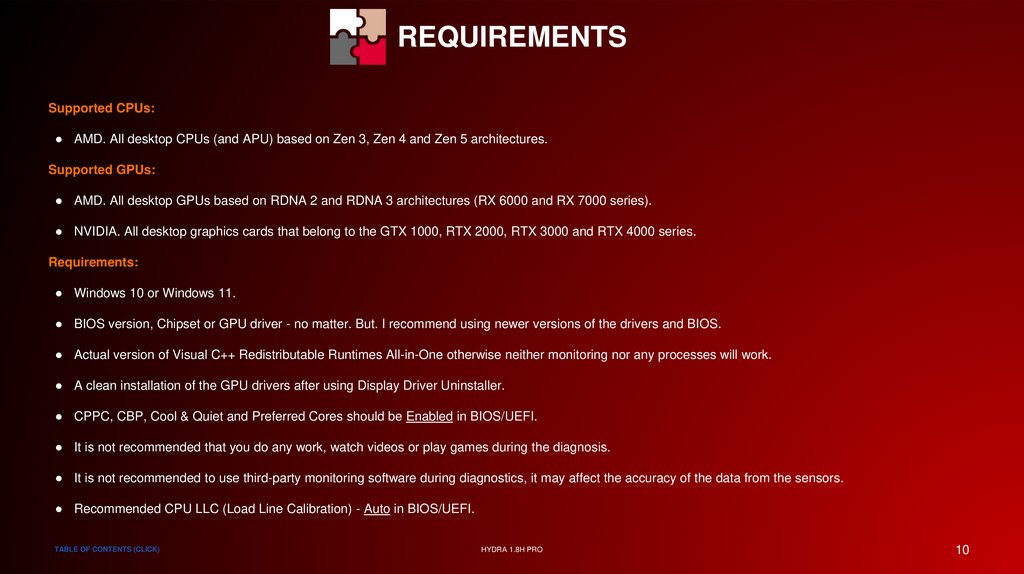
REQUIREMENTSSupported CPUs:
● AMD. All desktop CPUs (and APU) based on Zen 3, Zen 4 and Zen 5 architectures.
Supported GPUs:
● AMD. All desktop GPUs based on RDNA 2 and RDNA 3 architectures (RX 6000 and RX 7000 series).
● NVIDIA. All desktop graphics cards that belong to the GTX 1000, RTX 2000, RTX 3000 and RTX 4000 series.
Requirements:
● Windows 10 or Windows 11.
● BIOS version, Chipset or GPU driver - no matter. But. I recommend using newer versions of the drivers and BIOS.
● Actual version of Visual C++ Redistributable Runtimes All-in-One otherwise neither monitoring nor any processes will work.
● A clean installation of the GPU drivers after using Display Driver Uninstaller.
● CPPC, CBP, Cool & Quiet and Preferred Cores should be Enabled in BIOS/UEFI.
● It is not recommended that you do any work, watch videos or play games during the diagnosis.
● It is not recommended to use third-party monitoring software during diagnostics, it may affect the accuracy of the data from the sensors.
● Recommended CPU LLC (Load Line Calibration) - Auto in BIOS/UEFI.
TABLE OF CONTENTS (CLICK)
HYDRA 1.8H PRO
10
11.
SPECIAL THANKSVERSION
COMPARISON
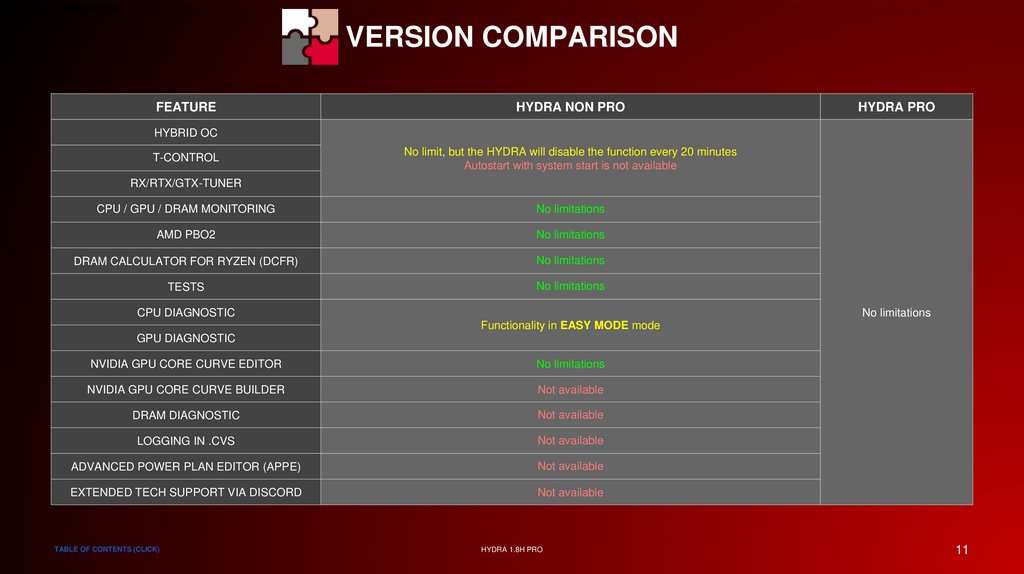
VERSION COMPARISON
FEATURE
HYDRA NON PRO
HYDRA PRO
HYBRID OC
T-CONTROL
No limit, but the HYDRA will disable the function every 20 minutes
Autostart with system start is not available
RX/RTX/GTX-TUNER
CPU / GPU / DRAM MONITORING
No limitations
AMD PBO2
No limitations
DRAM CALCULATOR FOR RYZEN (DCFR)
No limitations
TESTS
No limitations
CPU DIAGNOSTIC
No limitations
Functionality in EASY MODE mode
GPU DIAGNOSTIC
NVIDIA GPU CORE CURVE EDITOR
No limitations
NVIDIA GPU CORE CURVE BUILDER
Not available
DRAM DIAGNOSTIC
Not available
LOGGING IN .CVS
Not available
ADVANCED POWER PLAN EDITOR (APPE)
Not available
EXTENDED TECH SUPPORT VIA DISCORD
Not available
TABLE OF CONTENTS (CLICK)
HYDRA 1.8H PRO
11
12.
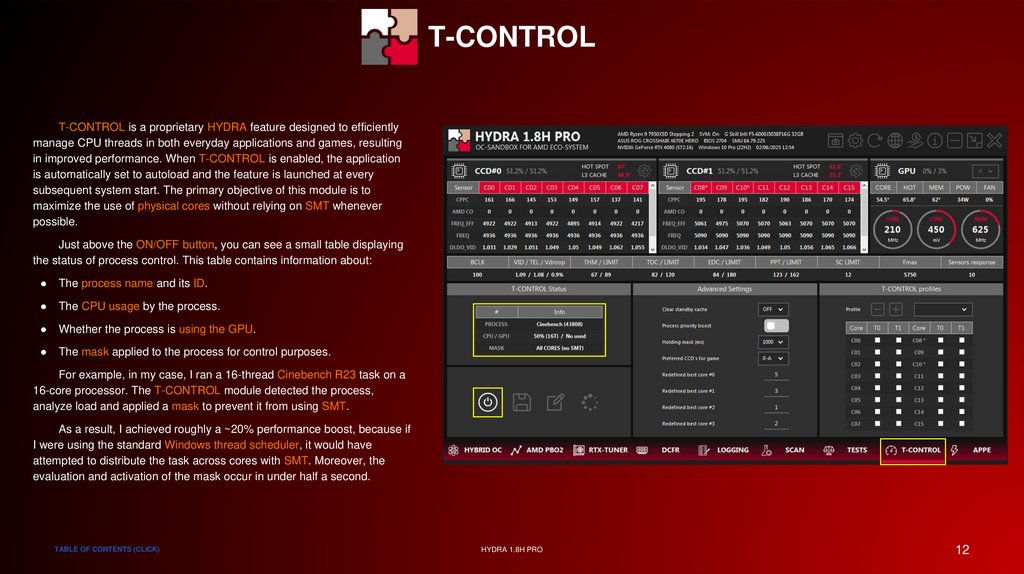
T-CONTROLT-CONTROL is a proprietary HYDRA feature designed to efficiently
manage CPU threads in both everyday applications and games, resulting
in improved performance. When T-CONTROL is enabled, the application
is automatically set to autoload and the feature is launched at every
subsequent system start. The primary objective of this module is to
maximize the use of physical cores without relying on SMT whenever
possible.
Just above the ON/OFF button, you can see a small table displaying
the status of process control. This table contains information about:
The process name and its ID.
The CPU usage by the process.
Whether the process is using the GPU.
The mask applied to the process for control purposes.
For example, in my case, I ran a 16-thread Cinebench R23 task on a
16-core processor. The T-CONTROL module detected the process,
analyze load and applied a mask to prevent it from using SMT.
As a result, I achieved roughly a ~20% performance boost, because if
I were using the standard Windows thread scheduler, it would have
attempted to distribute the task across cores with SMT. Moreover, the
evaluation and activation of the mask occur in under half a second.
TABLE OF CONTENTS (CLICK)
HYDRA 1.8H PRO
12
13.
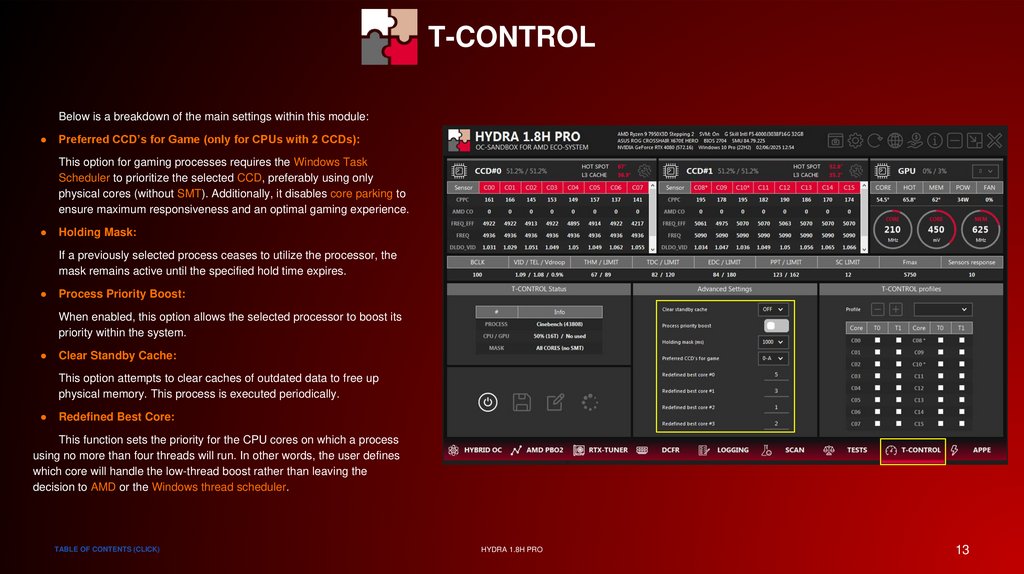
T-CONTROLBelow is a breakdown of the main settings within this module:
Preferred CCD’s for Game (only for CPUs with 2 CCDs):
This option for gaming processes requires the Windows Task
Scheduler to prioritize the selected CCD, preferably using only
physical cores (without SMT). Additionally, it disables core parking to
ensure maximum responsiveness and an optimal gaming experience.
Holding Mask:
If a previously selected process ceases to utilize the processor, the
mask remains active until the specified hold time expires.
Process Priority Boost:
When enabled, this option allows the selected processor to boost its
priority within the system.
Clear Standby Cache:
This option attempts to clear caches of outdated data to free up
physical memory. This process is executed periodically.
Redefined Best Core:
This function sets the priority for the CPU cores on which a process
using no more than four threads will run. In other words, the user defines
which core will handle the low-thread boost rather than leaving the
decision to AMD or the Windows thread scheduler.
TABLE OF CONTENTS (CLICK)
HYDRA 1.8H PRO
13
14.
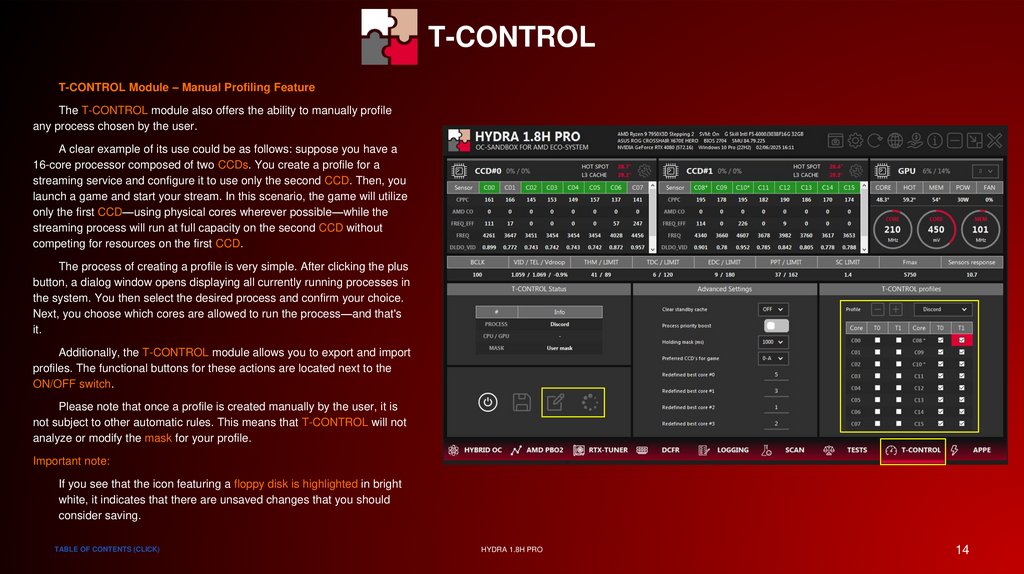
T-CONTROLT-CONTROL Module – Manual Profiling Feature
The T-CONTROL module also offers the ability to manually profile
any process chosen by the user.
A clear example of its use could be as follows: suppose you have a
16-core processor composed of two CCDs. You create a profile for a
streaming service and configure it to use only the second CCD. Then, you
launch a game and start your stream. In this scenario, the game will utilize
only the first CCD—using physical cores wherever possible—while the
streaming process will run at full capacity on the second CCD without
competing for resources on the first CCD.
The process of creating a profile is very simple. After clicking the plus
button, a dialog window opens displaying all currently running processes in
the system. You then select the desired process and confirm your choice.
Next, you choose which cores are allowed to run the process—and that's
it.
Additionally, the T-CONTROL module allows you to export and import
profiles. The functional buttons for these actions are located next to the
ON/OFF switch.
Please note that once a profile is created manually by the user, it is
not subject to other automatic rules. This means that T-CONTROL will not
analyze or modify the mask for your profile.
Important note:
If you see that the icon featuring a floppy disk is highlighted in bright
white, it indicates that there are unsaved changes that you should
consider saving.
TABLE OF CONTENTS (CLICK)
HYDRA 1.8H PRO
14
15.
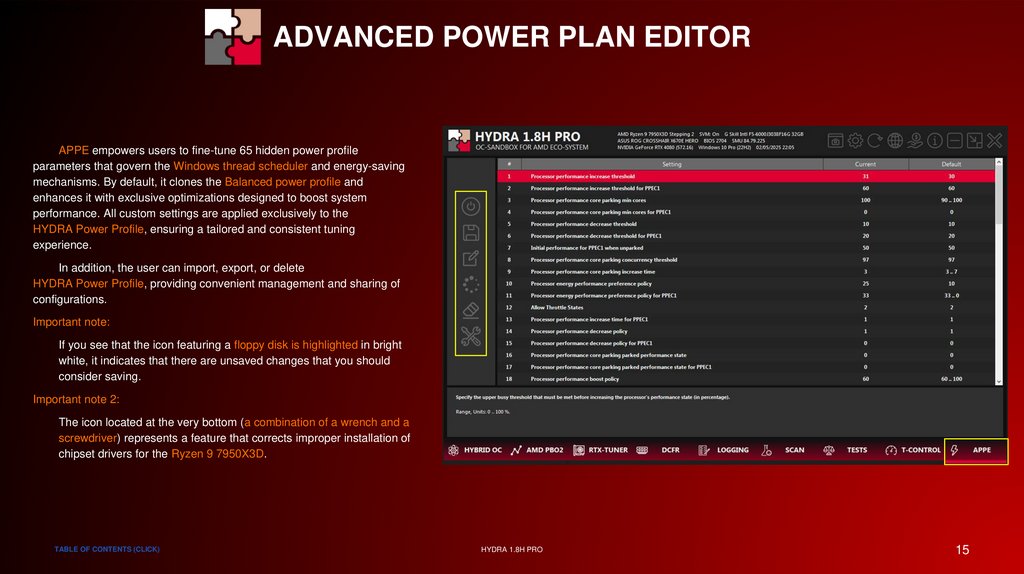
SPECIAL THANKSADVANCED POWER PLAN EDITOR
APPE empowers users to fine-tune 65 hidden power profile
parameters that govern the Windows thread scheduler and energy-saving
mechanisms. By default, it clones the Balanced power profile and
enhances it with exclusive optimizations designed to boost system
performance. All custom settings are applied exclusively to the
HYDRA Power Profile, ensuring a tailored and consistent tuning
experience.
In addition, the user can import, export, or delete
HYDRA Power Profile, providing convenient management and sharing of
configurations.
Important note:
If you see that the icon featuring a floppy disk is highlighted in bright
white, it indicates that there are unsaved changes that you should
consider saving.
Important note 2:
The icon located at the very bottom (a combination of a wrench and a
screwdriver) represents a feature that corrects improper installation of
chipset drivers for the Ryzen 9 7950X3D.
TABLE OF CONTENTS (CLICK)
HYDRA 1.8H PRO
15
16.
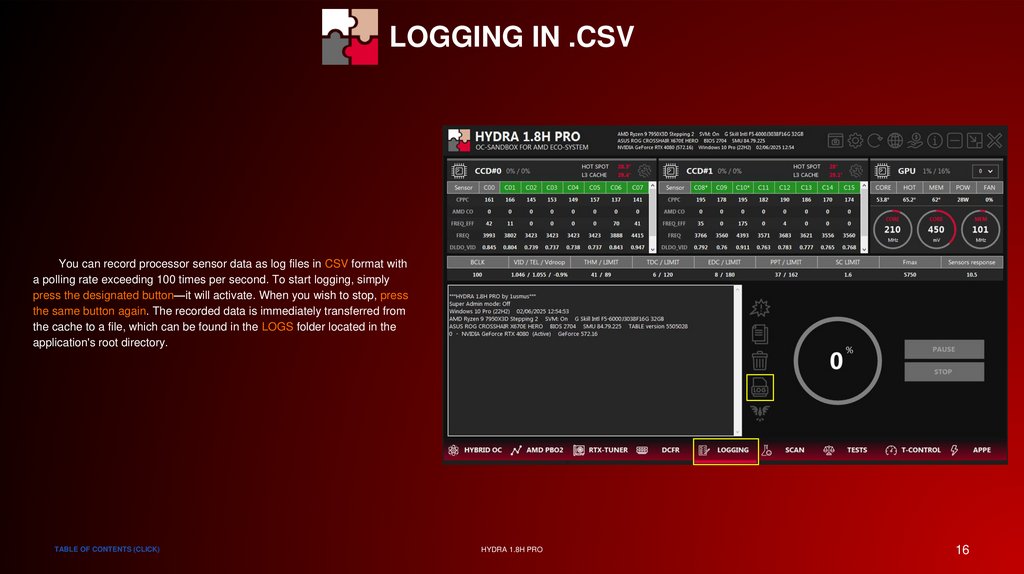
LOGGING IN .CSVYou can record processor sensor data as log files in CSV format with
a polling rate exceeding 100 times per second. To start logging, simply
press the designated button—it will activate. When you wish to stop, press
the same button again. The recorded data is immediately transferred from
the cache to a file, which can be found in the LOGS folder located in the
application's root directory.
TABLE OF CONTENTS (CLICK)
HYDRA 1.8H PRO
16
17.
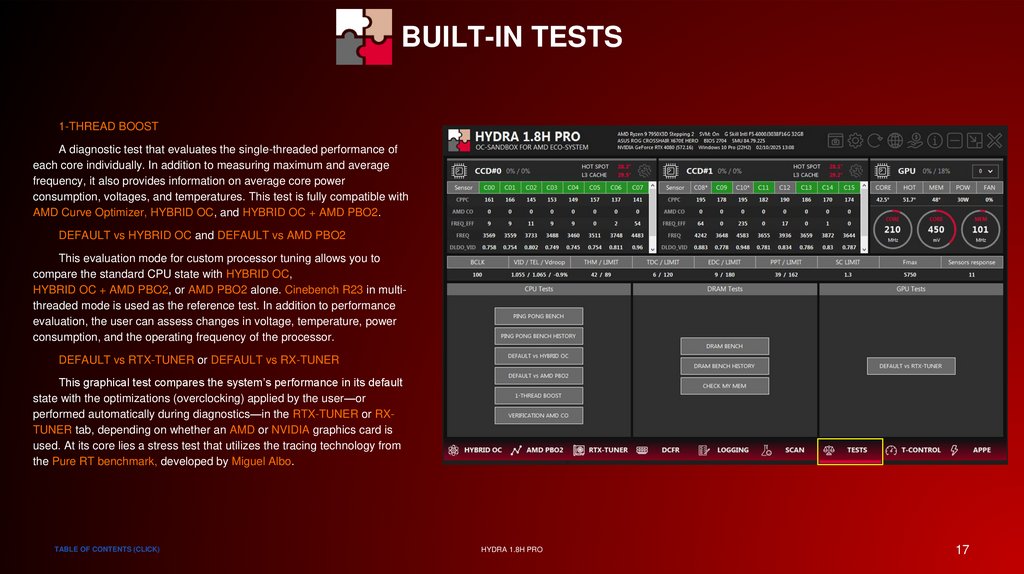
BUILT-IN TESTS1-THREAD BOOST
A diagnostic test that evaluates the single-threaded performance of
each core individually. In addition to measuring maximum and average
frequency, it also provides information on average core power
consumption, voltages, and temperatures. This test is fully compatible with
AMD Curve Optimizer, HYBRID OC, and HYBRID OC + AMD PBO2.
DEFAULT vs HYBRID OC and DEFAULT vs AMD PBO2
This evaluation mode for custom processor tuning allows you to
compare the standard CPU state with HYBRID OC,
HYBRID OC + AMD PBO2, or AMD PBO2 alone. Cinebench R23 in multithreaded mode is used as the reference test. In addition to performance
evaluation, the user can assess changes in voltage, temperature, power
consumption, and the operating frequency of the processor.
DEFAULT vs RTX-TUNER or DEFAULT vs RX-TUNER
This graphical test compares the system’s performance in its default
state with the optimizations (overclocking) applied by the user—or
performed automatically during diagnostics—in the RTX-TUNER or RXTUNER tab, depending on whether an AMD or NVIDIA graphics card is
used. At its core lies a stress test that utilizes the tracing technology from
the Pure RT benchmark, developed by Miguel Albo.
TABLE OF CONTENTS (CLICK)
HYDRA 1.8H PRO
17
18.
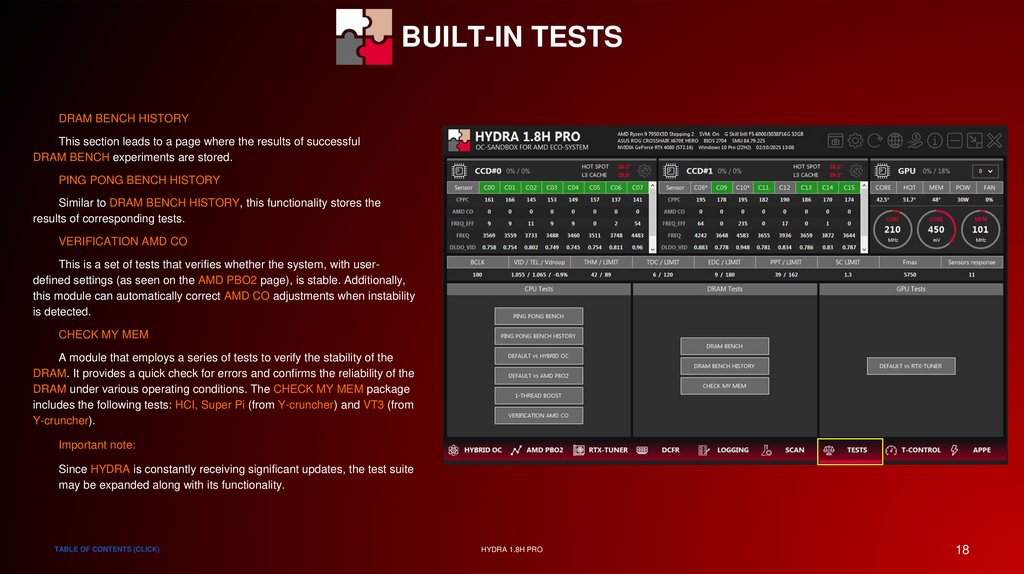
BUILT-IN TESTSDRAM BENCH HISTORY
This section leads to a page where the results of successful
DRAM BENCH experiments are stored.
PING PONG BENCH HISTORY
Similar to DRAM BENCH HISTORY, this functionality stores the
results of corresponding tests.
VERIFICATION AMD CO
This is a set of tests that verifies whether the system, with userdefined settings (as seen on the AMD PBO2 page), is stable. Additionally,
this module can automatically correct AMD CO adjustments when instability
is detected.
CHECK MY MEM
A module that employs a series of tests to verify the stability of the
DRAM. It provides a quick check for errors and confirms the reliability of the
DRAM under various operating conditions. The CHECK MY MEM package
includes the following tests: HCI, Super Pi (from Y-cruncher) and VT3 (from
Y-cruncher).
Important note:
Since HYDRA is constantly receiving significant updates, the test suite
may be expanded along with its functionality.
TABLE OF CONTENTS (CLICK)
HYDRA 1.8H PRO
18
19.
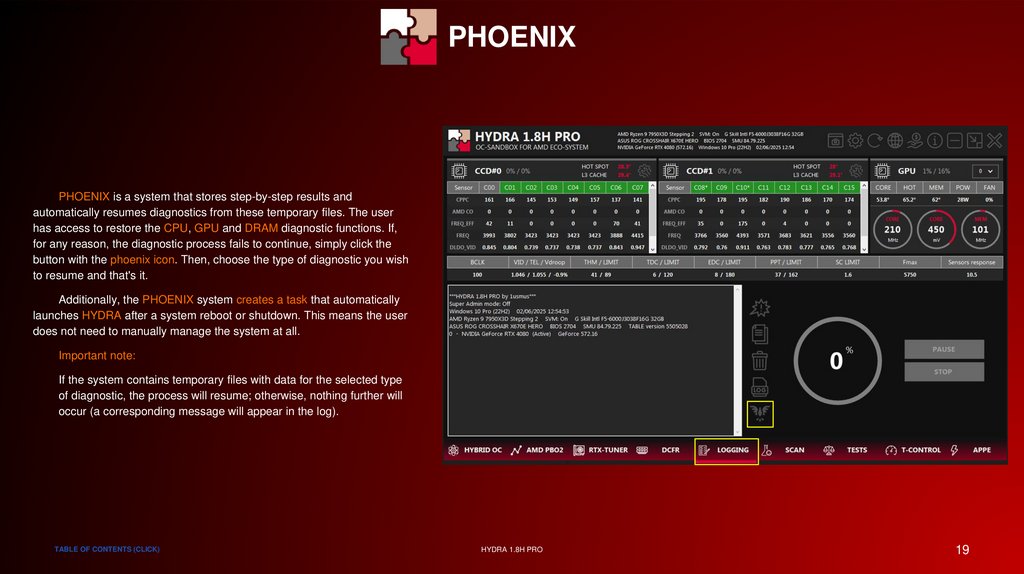
SPECIAL THANKSPHOENIX
PHOENIX is a system that stores step-by-step results and
automatically resumes diagnostics from these temporary files. The user
has access to restore the CPU, GPU and DRAM diagnostic functions. If,
for any reason, the diagnostic process fails to continue, simply click the
button with the phoenix icon. Then, choose the type of diagnostic you wish
to resume and that's it.
Additionally, the PHOENIX system creates a task that automatically
launches HYDRA after a system reboot or shutdown. This means the user
does not need to manually manage the system at all.
Important note:
If the system contains temporary files with data for the selected type
of diagnostic, the process will resume; otherwise, nothing further will
occur (a corresponding message will appear in the log).
TABLE OF CONTENTS (CLICK)
HYDRA 1.8H PRO
19
20.
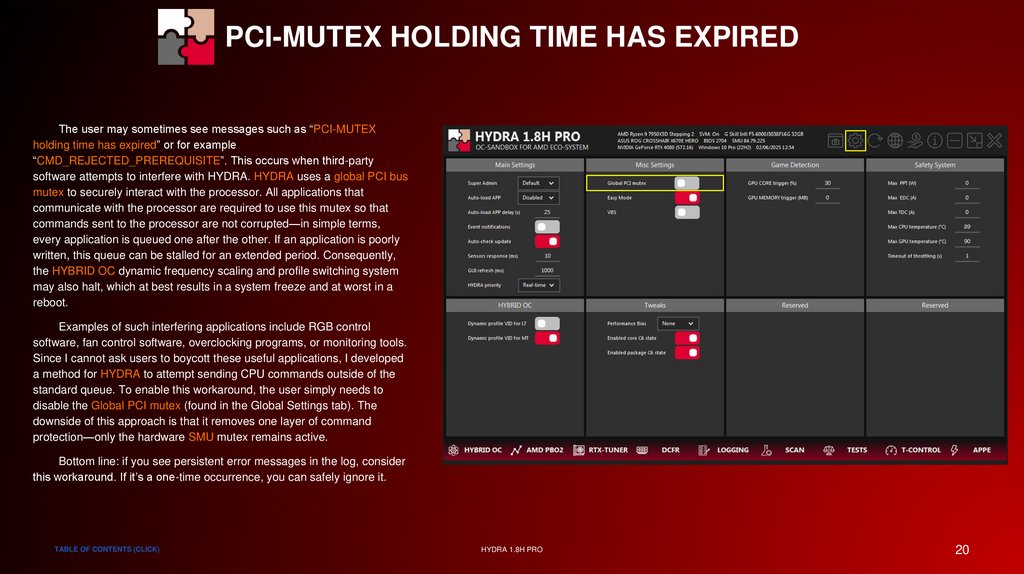
PCI-MUTEX HOLDING TIME HAS EXPIREDThe user may sometimes see messages such as “PCI-MUTEX
holding time has expired” or for example
“CMD_REJECTED_PREREQUISITE”. This occurs when third-party
software attempts to interfere with HYDRA. HYDRA uses a global PCI bus
mutex to securely interact with the processor. All applications that
communicate with the processor are required to use this mutex so that
commands sent to the processor are not corrupted—in simple terms,
every application is queued one after the other. If an application is poorly
written, this queue can be stalled for an extended period. Consequently,
the HYBRID OC dynamic frequency scaling and profile switching system
may also halt, which at best results in a system freeze and at worst in a
reboot.
Examples of such interfering applications include RGB control
software, fan control software, overclocking programs, or monitoring tools.
Since I cannot ask users to boycott these useful applications, I developed
a method for HYDRA to attempt sending CPU commands outside of the
standard queue. To enable this workaround, the user simply needs to
disable the Global PCI mutex (found in the Global Settings tab). The
downside of this approach is that it removes one layer of command
protection—only the hardware SMU mutex remains active.
Bottom line: if you see persistent error messages in the log, consider
this workaround. If it’s a one-time occurrence, you can safely ignore it.
TABLE OF CONTENTS (CLICK)
HYDRA 1.8H PRO
20
21.
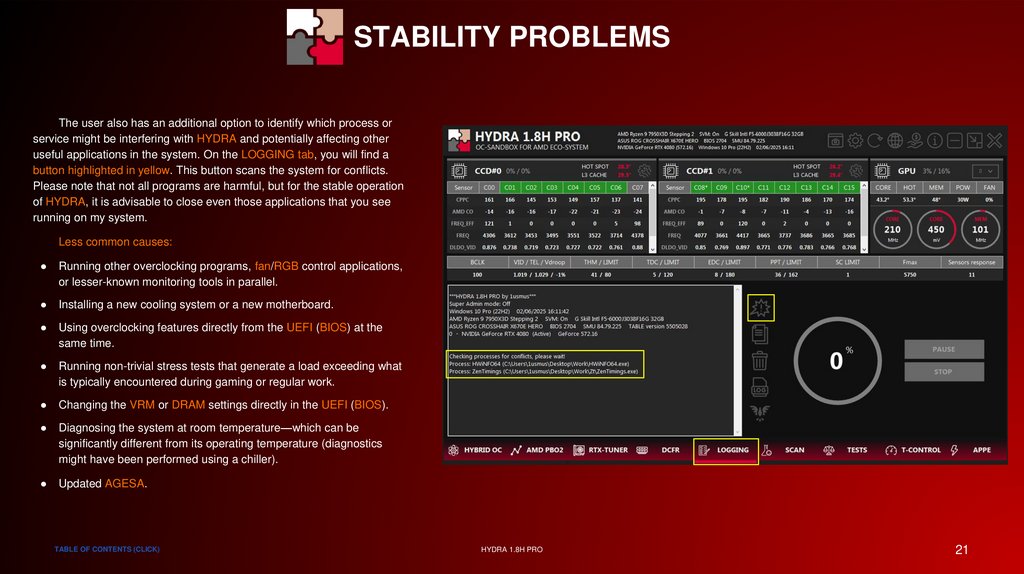
STABILITY PROBLEMSThe user also has an additional option to identify which process or
service might be interfering with HYDRA and potentially affecting other
useful applications in the system. On the LOGGING tab, you will find a
button highlighted in yellow. This button scans the system for conflicts.
Please note that not all programs are harmful, but for the stable operation
of HYDRA, it is advisable to close even those applications that you see
running on my system.
Less common causes:
Running other overclocking programs, fan/RGB control applications,
or lesser-known monitoring tools in parallel.
Installing a new cooling system or a new motherboard.
Using overclocking features directly from the UEFI (BIOS) at the
same time.
Running non-trivial stress tests that generate a load exceeding what
is typically encountered during gaming or regular work.
Changing the VRM or DRAM settings directly in the UEFI (BIOS).
Diagnosing the system at room temperature—which can be
significantly different from its operating temperature (diagnostics
might have been performed using a chiller).
Updated AGESA.
TABLE OF CONTENTS (CLICK)
HYDRA 1.8H PRO
21
22.
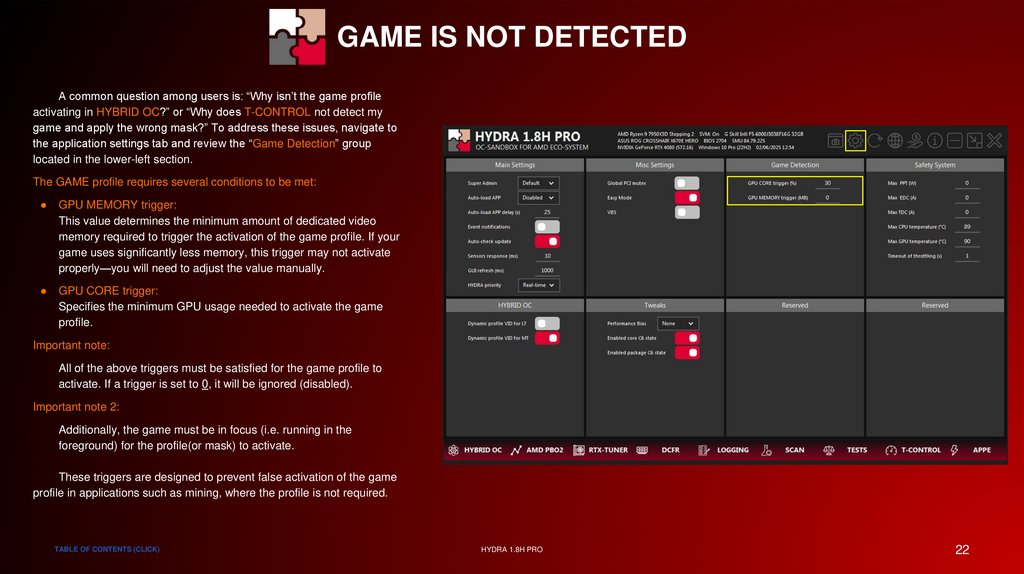
GAME IS NOT DETECTEDA common question among users is: “Why isn’t the game profile
activating in HYBRID OC?” or “Why does T-CONTROL not detect my
game and apply the wrong mask?” To address these issues, navigate to
the application settings tab and review the “Game Detection” group
located in the lower-left section.
The GAME profile requires several conditions to be met:
GPU MEMORY trigger:
This value determines the minimum amount of dedicated video
memory required to trigger the activation of the game profile. If your
game uses significantly less memory, this trigger may not activate
properly—you will need to adjust the value manually.
GPU CORE trigger:
Specifies the minimum GPU usage needed to activate the game
profile.
Important note:
All of the above triggers must be satisfied for the game profile to
activate. If a trigger is set to 0, it will be ignored (disabled).
Important note 2:
Additionally, the game must be in focus (i.e. running in the
foreground) for the profile(or mask) to activate.
These triggers are designed to prevent false activation of the game
profile in applications such as mining, where the profile is not required.
TABLE OF CONTENTS (CLICK)
HYDRA 1.8H PRO
22
23.
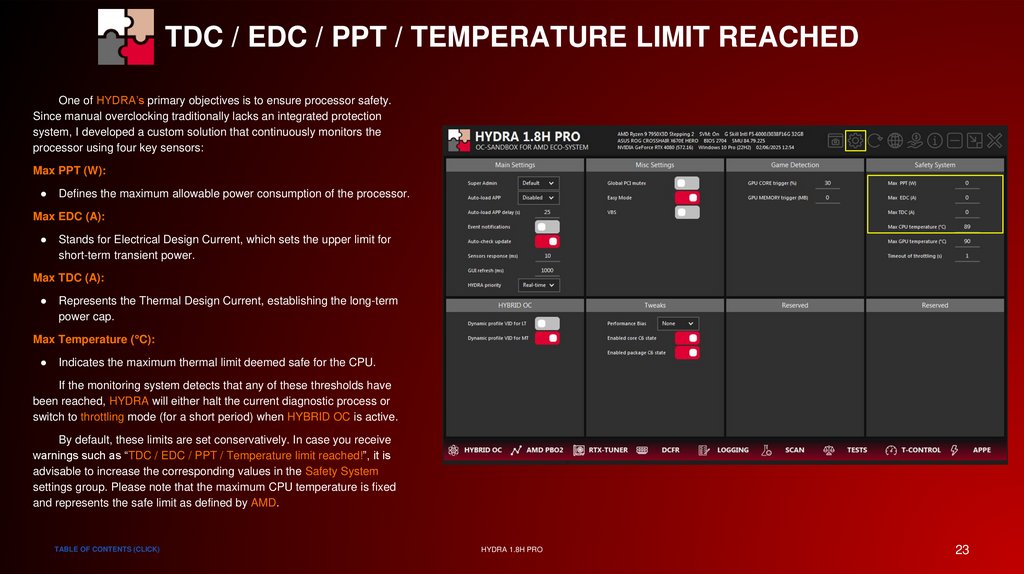
TDC / EDC / PPT / TEMPERATURE LIMIT REACHEDOne of HYDRA’s primary objectives is to ensure processor safety.
Since manual overclocking traditionally lacks an integrated protection
system, I developed a custom solution that continuously monitors the
processor using four key sensors:
Max PPT (W):
Defines the maximum allowable power consumption of the processor.
Max EDC (A):
Stands for Electrical Design Current, which sets the upper limit for
short-term transient power.
Max TDC (A):
Represents the Thermal Design Current, establishing the long-term
power cap.
Max Temperature (°C):
Indicates the maximum thermal limit deemed safe for the CPU.
If the monitoring system detects that any of these thresholds have
been reached, HYDRA will either halt the current diagnostic process or
switch to throttling mode (for a short period) when HYBRID OC is active.
By default, these limits are set conservatively. In case you receive
warnings such as “TDC / EDC / PPT / Temperature limit reached!”, it is
advisable to increase the corresponding values in the Safety System
settings group. Please note that the maximum CPU temperature is fixed
and represents the safe limit as defined by AMD.
TABLE OF CONTENTS (CLICK)
HYDRA 1.8H PRO
23
24.
SPECIAL THANKSSPECIAL THANKS
Vadym Kosmin (@A_z_z_y), @Veii, Alexey Shalpegin (@15432), Keaton Blomquist (@sbski), @patrickschur_, @PJVol, Ivan Rusanov
@ManniX, @Reknez, @LEIV, @Tyler15e, @wanderinarcheologist, Martin Malik, Ann Martiné, @DayDreamer, @rizlah
@kutale, @arcanazen, @RdWing, @Bloax, @Riwwelorsch, @Gadfly, @ACE, @Devin, @profitkaa
TABLE OF CONTENTS (CLICK)
HYDRA 1.8H PRO
24
25.
SPECIAL THANKSCPU SECTION
TABLE OF CONTENTS (CLICK)
HYDRA 1.8H PRO
25
26.
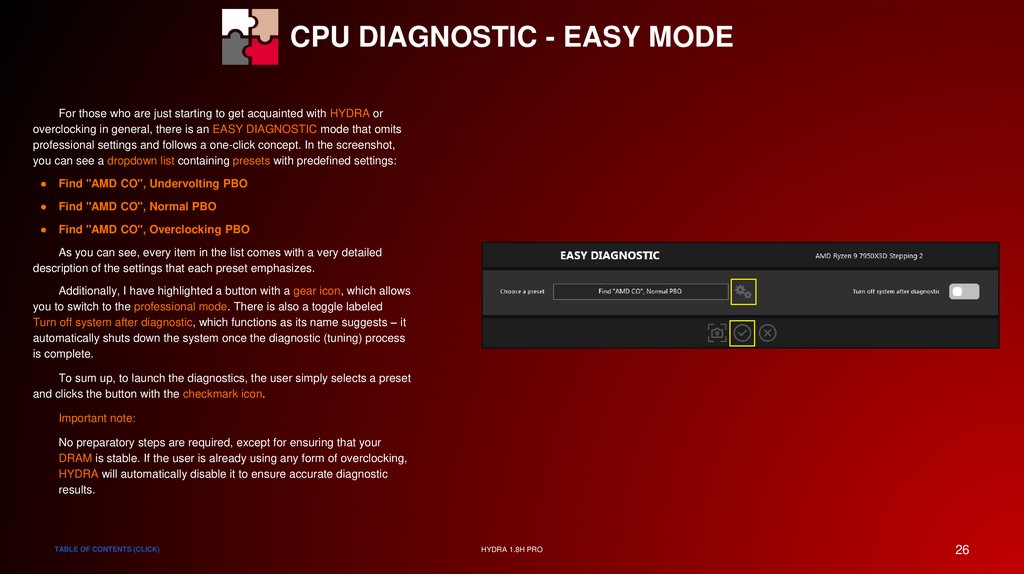
CPU DIAGNOSTIC - EASY MODEFor those who are just starting to get acquainted with HYDRA or
overclocking in general, there is an EASY DIAGNOSTIC mode that omits
professional settings and follows a one-click concept. In the screenshot,
you can see a dropdown list containing presets with predefined settings:
Find "AMD CO", Undervolting PBO
Find "AMD CO", Normal PBO
Find "AMD CO", Overclocking PBO
As you can see, every item in the list comes with a very detailed
description of the settings that each preset emphasizes.
Additionally, I have highlighted a button with a gear icon, which allows
you to switch to the professional mode. There is also a toggle labeled
Turn off system after diagnostic, which functions as its name suggests – it
automatically shuts down the system once the diagnostic (tuning) process
is complete.
To sum up, to launch the diagnostics, the user simply selects a preset
and clicks the button with the checkmark icon.
Important note:
No preparatory steps are required, except for ensuring that your
DRAM is stable. If the user is already using any form of overclocking,
HYDRA will automatically disable it to ensure accurate diagnostic
results.
TABLE OF CONTENTS (CLICK)
HYDRA 1.8H PRO
26
27.
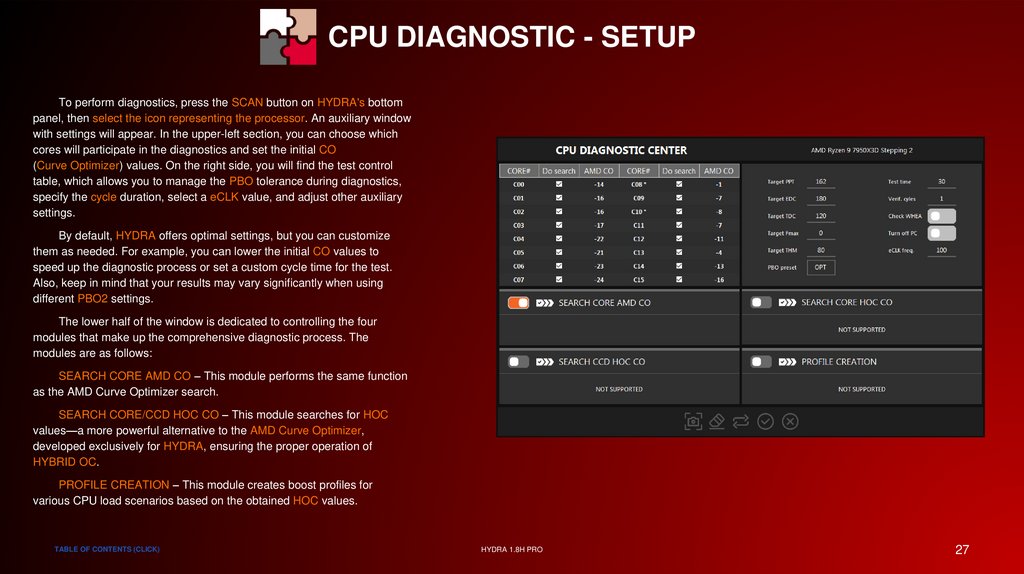
CPU DIAGNOSTIC - SETUPTo perform diagnostics, press the SCAN button on HYDRA's bottom
panel, then select the icon representing the processor. An auxiliary window
with settings will appear. In the upper-left section, you can choose which
cores will participate in the diagnostics and set the initial CO
(Curve Optimizer) values. On the right side, you will find the test control
table, which allows you to manage the PBO tolerance during diagnostics,
specify the cycle duration, select a eCLK value, and adjust other auxiliary
settings.
By default, HYDRA offers optimal settings, but you can customize
them as needed. For example, you can lower the initial CO values to
speed up the diagnostic process or set a custom cycle time for the test.
Also, keep in mind that your results may vary significantly when using
different PBO2 settings.
The lower half of the window is dedicated to controlling the four
modules that make up the comprehensive diagnostic process. The
modules are as follows:
SEARCH CORE AMD CO – This module performs the same function
as the AMD Curve Optimizer search.
SEARCH CORE/CCD HOC CO – This module searches for HOC
values—a more powerful alternative to the AMD Curve Optimizer,
developed exclusively for HYDRA, ensuring the proper operation of
HYBRID OC.
PROFILE CREATION – This module creates boost profiles for
various CPU load scenarios based on the obtained HOC values.
TABLE OF CONTENTS (CLICK)
HYDRA 1.8H PRO
27
28.
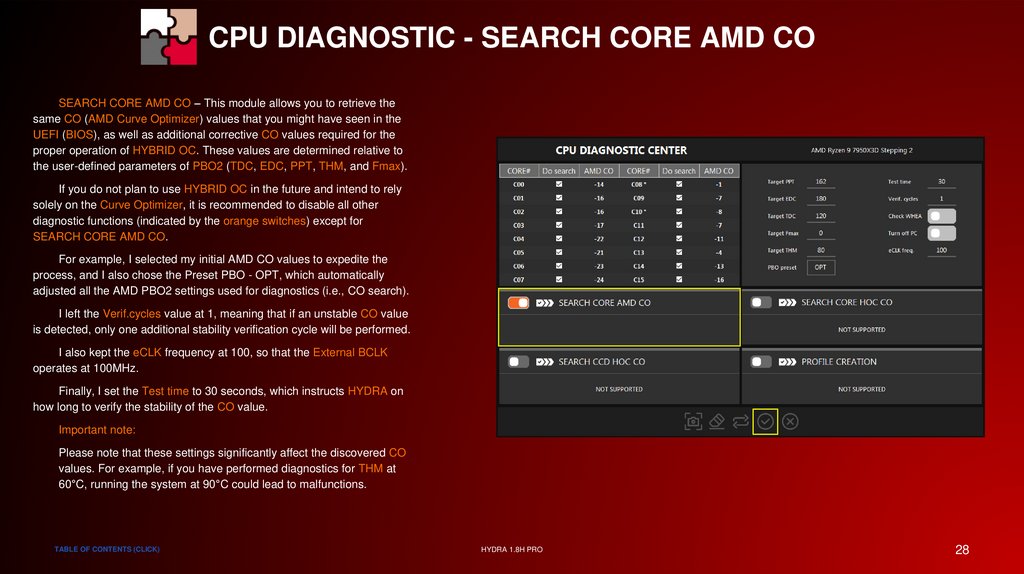
CPU DIAGNOSTIC - SEARCH CORE AMD COSEARCH CORE AMD CO – This module allows you to retrieve the
same CO (AMD Curve Optimizer) values that you might have seen in the
UEFI (BIOS), as well as additional corrective CO values required for the
proper operation of HYBRID OC. These values are determined relative to
the user-defined parameters of PBO2 (TDC, EDC, PPT, THM, and Fmax).
If you do not plan to use HYBRID OC in the future and intend to rely
solely on the Curve Optimizer, it is recommended to disable all other
diagnostic functions (indicated by the orange switches) except for
SEARCH CORE AMD CO.
For example, I selected my initial AMD CO values to expedite the
process, and I also chose the Preset PBO - OPT, which automatically
adjusted all the AMD PBO2 settings used for diagnostics (i.e., CO search).
I left the Verif.cycles value at 1, meaning that if an unstable CO value
is detected, only one additional stability verification cycle will be performed.
I also kept the eCLK frequency at 100, so that the External BCLK
operates at 100MHz.
Finally, I set the Test time to 30 seconds, which instructs HYDRA on
how long to verify the stability of the CO value.
Important note:
Please note that these settings significantly affect the discovered CO
values. For example, if you have performed diagnostics for THM at
60°C, running the system at 90°C could lead to malfunctions.
TABLE OF CONTENTS (CLICK)
HYDRA 1.8H PRO
28
29.
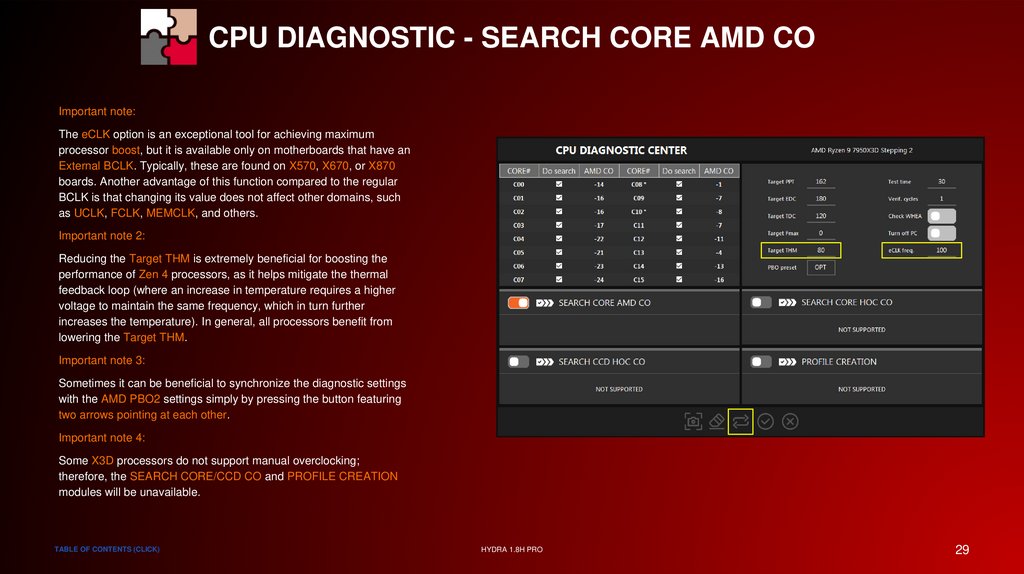
CPU DIAGNOSTIC - SEARCH CORE AMD COImportant note:
The eCLK option is an exceptional tool for achieving maximum
processor boost, but it is available only on motherboards that have an
External BCLK. Typically, these are found on X570, X670, or X870
boards. Another advantage of this function compared to the regular
BCLK is that changing its value does not affect other domains, such
as UCLK, FCLK, MEMCLK, and others.
Important note 2:
Reducing the Target THM is extremely beneficial for boosting the
performance of Zen 4 processors, as it helps mitigate the thermal
feedback loop (where an increase in temperature requires a higher
voltage to maintain the same frequency, which in turn further
increases the temperature). In general, all processors benefit from
lowering the Target THM.
Important note 3:
Sometimes it can be beneficial to synchronize the diagnostic settings
with the AMD PBO2 settings simply by pressing the button featuring
two arrows pointing at each other.
Important note 4:
Some X3D processors do not support manual overclocking;
therefore, the SEARCH CORE/CCD CO and PROFILE CREATION
modules will be unavailable.
TABLE OF CONTENTS (CLICK)
HYDRA 1.8H PRO
29
30.
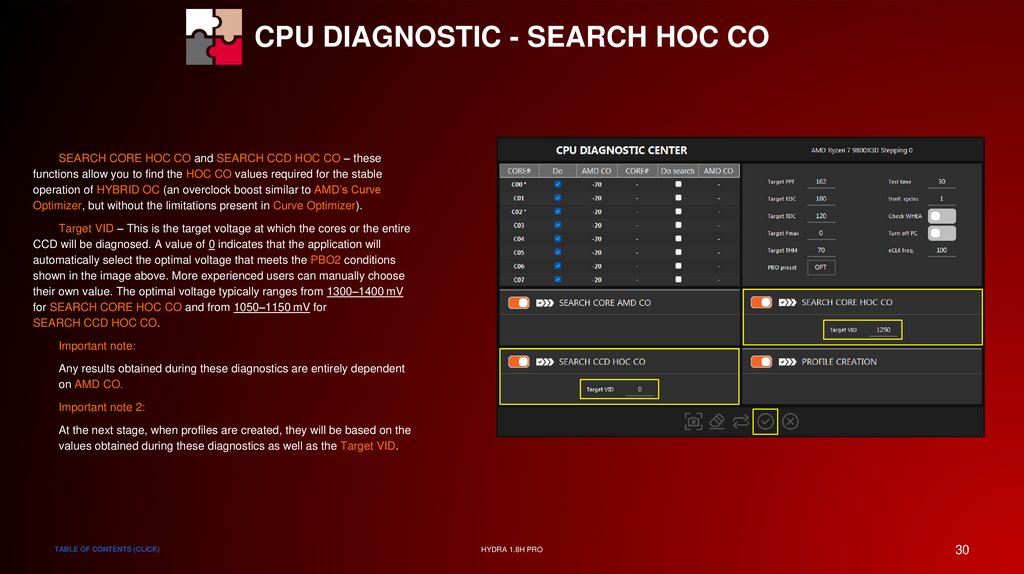
CPU DIAGNOSTIC - SEARCH HOC COSEARCH CORE HOC CO and SEARCH CCD HOC CO – these
functions allow you to find the HOC CO values required for the stable
operation of HYBRID OC (an overclock boost similar to AMD’s Curve
Optimizer, but without the limitations present in Curve Optimizer).
Target VID – This is the target voltage at which the cores or the entire
CCD will be diagnosed. A value of 0 indicates that the application will
automatically select the optimal voltage that meets the PBO2 conditions
shown in the image above. More experienced users can manually choose
their own value. The optimal voltage typically ranges from 1300–1400 mV
for SEARCH CORE HOC CO and from 1050–1150 mV for
SEARCH CCD HOC CO.
Important note:
Any results obtained during these diagnostics are entirely dependent
on AMD CO.
Important note 2:
At the next stage, when profiles are created, they will be based on the
values obtained during these diagnostics as well as the Target VID.
TABLE OF CONTENTS (CLICK)
HYDRA 1.8H PRO
30
31.
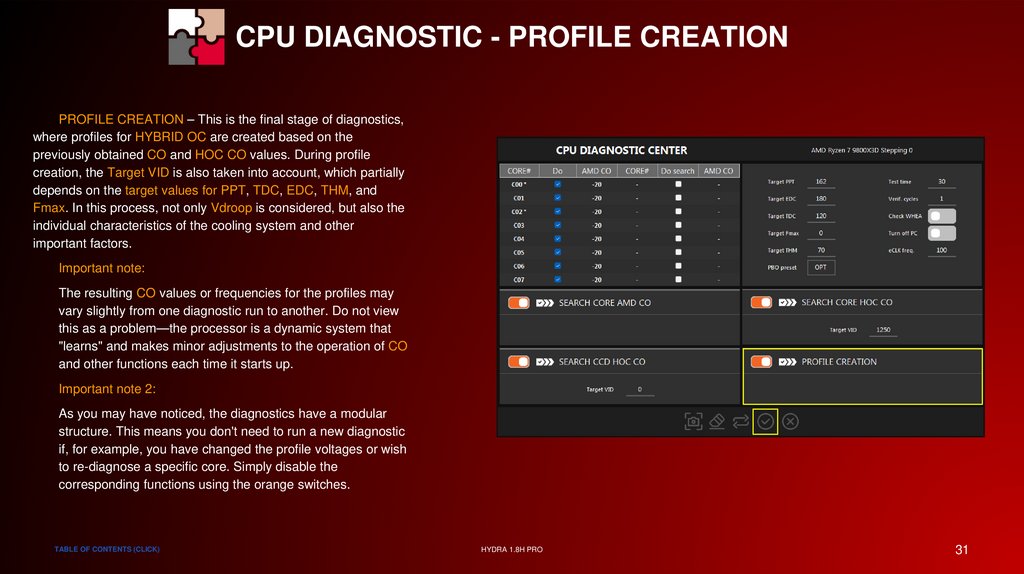
CPU DIAGNOSTIC - PROFILE CREATIONPROFILE CREATION – This is the final stage of diagnostics,
where profiles for HYBRID OC are created based on the
previously obtained CO and HOC CO values. During profile
creation, the Target VID is also taken into account, which partially
depends on the target values for PPT, TDC, EDC, THM, and
Fmax. In this process, not only Vdroop is considered, but also the
individual characteristics of the cooling system and other
important factors.
Important note:
The resulting CO values or frequencies for the profiles may
vary slightly from one diagnostic run to another. Do not view
this as a problem—the processor is a dynamic system that
"learns" and makes minor adjustments to the operation of CO
and other functions each time it starts up.
Important note 2:
As you may have noticed, the diagnostics have a modular
structure. This means you don't need to run a new diagnostic
if, for example, you have changed the profile voltages or wish
to re-diagnose a specific core. Simply disable the
corresponding functions using the orange switches.
TABLE OF CONTENTS (CLICK)
HYDRA 1.8H PRO
31
32.
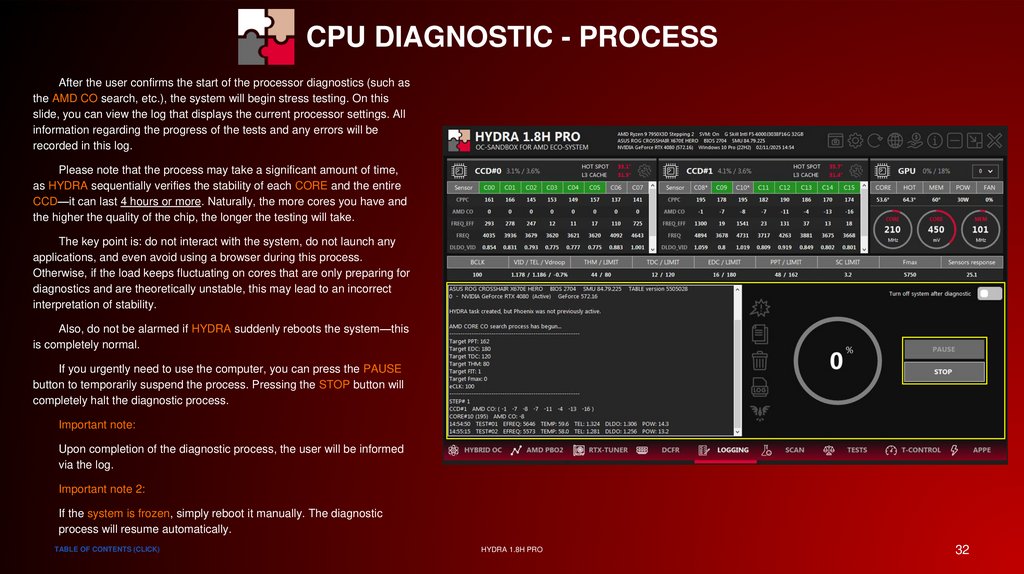
SPECIAL THANKSCPU DIAGNOSTIC - PROCESS
After the user confirms the start of the processor diagnostics (such as
the AMD CO search, etc.), the system will begin stress testing. On this
slide, you can view the log that displays the current processor settings. All
information regarding the progress of the tests and any errors will be
recorded in this log.
Please note that the process may take a significant amount of time,
as HYDRA sequentially verifies the stability of each CORE and the entire
CCD—it can last 4 hours or more. Naturally, the more cores you have and
the higher the quality of the chip, the longer the testing will take.
The key point is: do not interact with the system, do not launch any
applications, and even avoid using a browser during this process.
Otherwise, if the load keeps fluctuating on cores that are only preparing for
diagnostics and are theoretically unstable, this may lead to an incorrect
interpretation of stability.
Also, do not be alarmed if HYDRA suddenly reboots the system—this
is completely normal.
If you urgently need to use the computer, you can press the PAUSE
button to temporarily suspend the process. Pressing the STOP button will
completely halt the diagnostic process.
Important note:
Upon completion of the diagnostic process, the user will be informed
via the log.
Important note 2:
If the system is frozen, simply reboot it manually. The diagnostic
process will resume automatically.
TABLE OF CONTENTS (CLICK)
HYDRA 1.8H PRO
32
33.
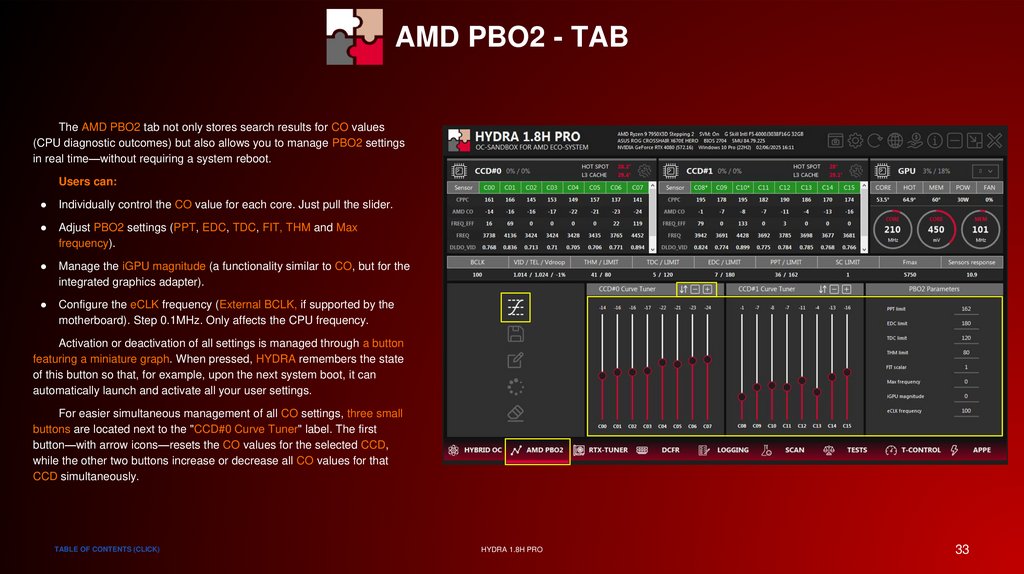
AMD PBO2 - TABThe AMD PBO2 tab not only stores search results for CO values
(CPU diagnostic outcomes) but also allows you to manage PBO2 settings
in real time—without requiring a system reboot.
Users can:
Individually control the CO value for each core. Just pull the slider.
Adjust PBO2 settings (PPT, EDC, TDC, FIT, THM and Max
frequency).
Manage the iGPU magnitude (a functionality similar to CO, but for the
integrated graphics adapter).
Configure the eCLK frequency (External BCLK, if supported by the
motherboard). Step 0.1MHz. Only affects the CPU frequency.
Activation or deactivation of all settings is managed through a button
featuring a miniature graph. When pressed, HYDRA remembers the state
of this button so that, for example, upon the next system boot, it can
automatically launch and activate all your user settings.
For easier simultaneous management of all CO settings, three small
buttons are located next to the "CCD#0 Curve Tuner" label. The first
button—with arrow icons—resets the CO values for the selected CCD,
while the other two buttons increase or decrease all CO values for that
CCD simultaneously.
TABLE OF CONTENTS (CLICK)
HYDRA 1.8H PRO
33
34.
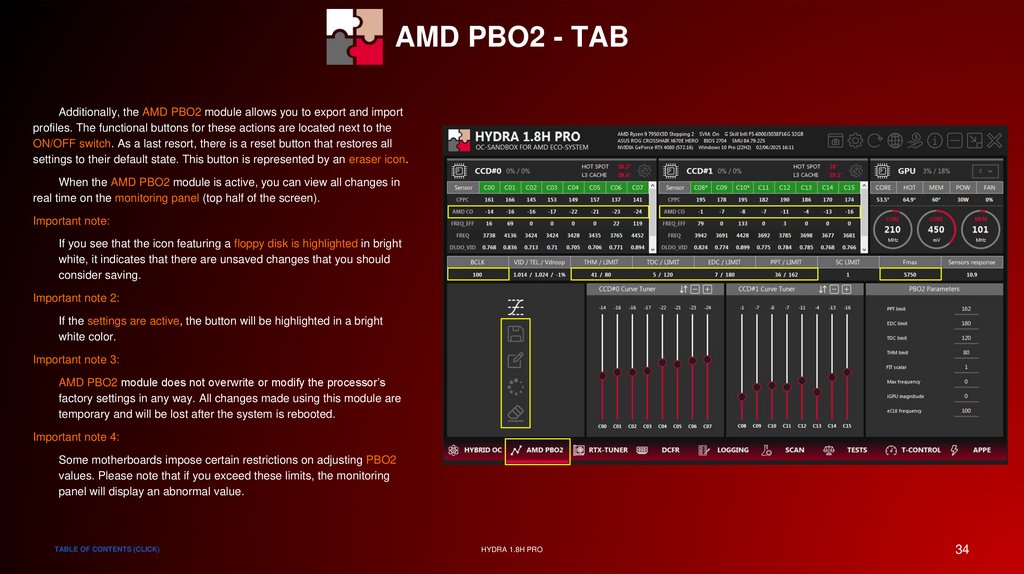
AMD PBO2 - TABAdditionally, the AMD PBO2 module allows you to export and import
profiles. The functional buttons for these actions are located next to the
ON/OFF switch. As a last resort, there is a reset button that restores all
settings to their default state. This button is represented by an eraser icon.
When the AMD PBO2 module is active, you can view all changes in
real time on the monitoring panel (top half of the screen).
Important note:
If you see that the icon featuring a floppy disk is highlighted in bright
white, it indicates that there are unsaved changes that you should
consider saving.
Important note 2:
If the settings are active, the button will be highlighted in a bright
white color.
Important note 3:
AMD PBO2 module does not overwrite or modify the processor’s
factory settings in any way. All changes made using this module are
temporary and will be lost after the system is rebooted.
Important note 4:
Some motherboards impose certain restrictions on adjusting PBO2
values. Please note that if you exceed these limits, the monitoring
panel will display an abnormal value.
TABLE OF CONTENTS (CLICK)
HYDRA 1.8H PRO
34
35.
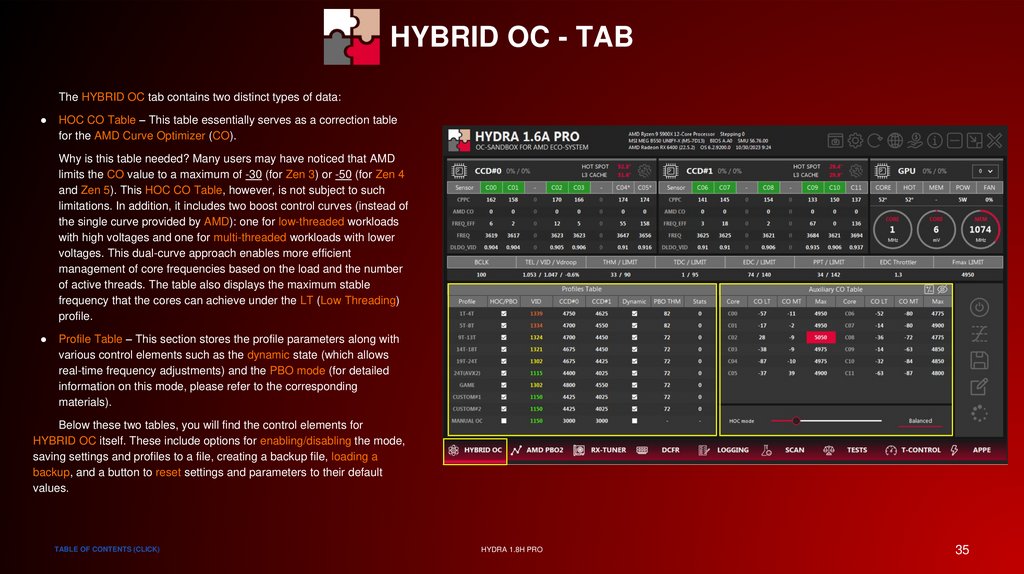
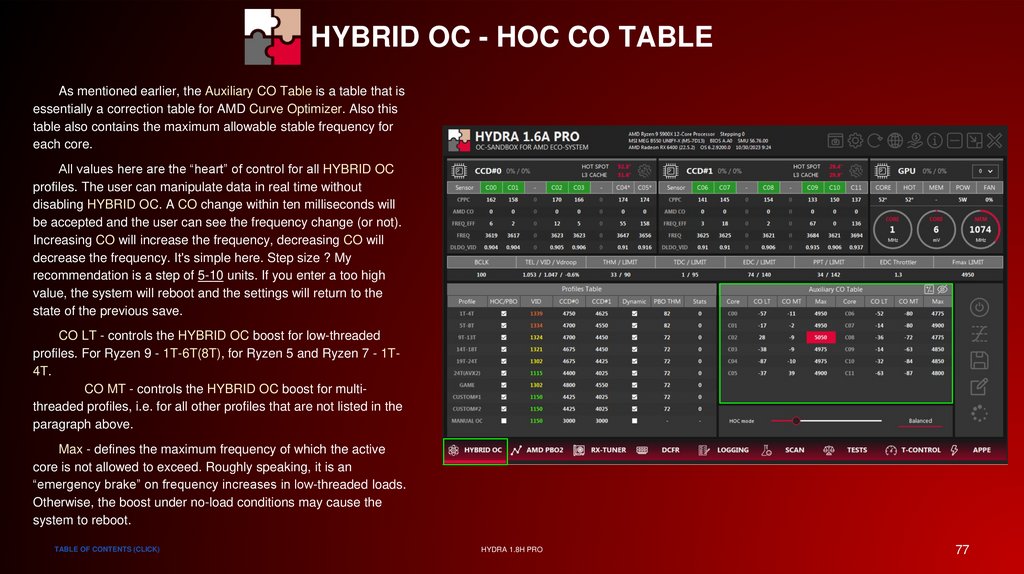
HYBRID OC - TABThe HYBRID OC tab contains two distinct types of data:
HOC CO Table – This table essentially serves as a correction table
for the AMD Curve Optimizer (CO).
Why is this table needed? Many users may have noticed that AMD
limits the CO value to a maximum of -30 (for Zen 3) or -50 (for Zen 4
and Zen 5). This HOC CO Table, however, is not subject to such
limitations. In addition, it includes two boost control curves (instead of
the single curve provided by AMD): one for low-threaded workloads
with high voltages and one for multi-threaded workloads with lower
voltages. This dual-curve approach enables more efficient
management of core frequencies based on the load and the number
of active threads. The table also displays the maximum stable
frequency that the cores can achieve under the LT (Low Threading)
profile.
Profile Table – This section stores the profile parameters along with
various control elements such as the dynamic state (which allows
real-time frequency adjustments) and the PBO mode (for detailed
information on this mode, please refer to the corresponding
materials).
Below these two tables, you will find the control elements for
HYBRID OC itself. These include options for enabling/disabling the mode,
saving settings and profiles to a file, creating a backup file, loading a
backup, and a button to reset settings and parameters to their default
values.
TABLE OF CONTENTS (CLICK)
HYDRA 1.8H PRO
35
36.
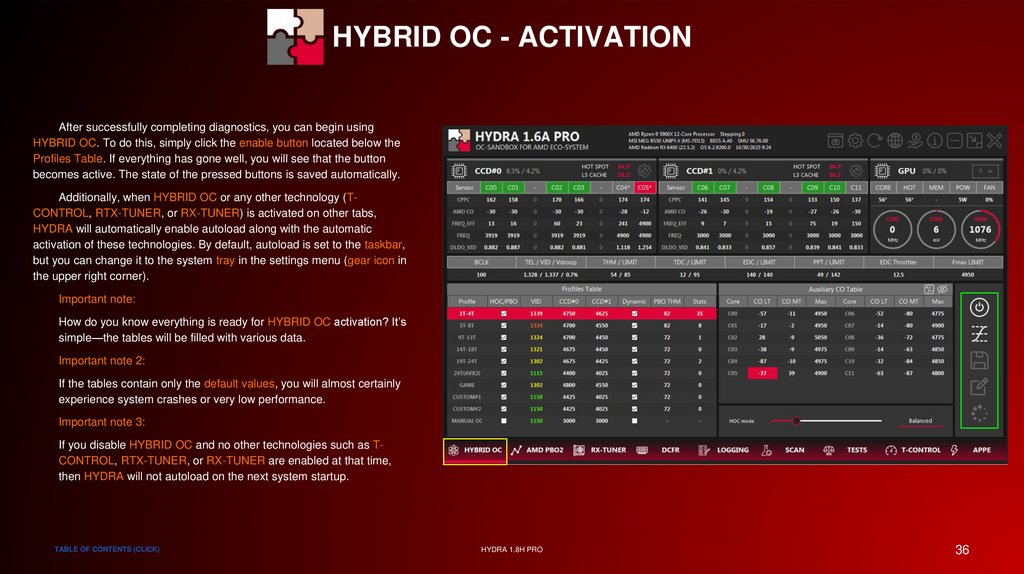
HYBRID OC - ACTIVATIONAfter successfully completing diagnostics, you can begin using
HYBRID OC. To do this, simply click the enable button located below the
Profiles Table. If everything has gone well, you will see that the button
becomes active. The state of the pressed buttons is saved automatically.
Additionally, when HYBRID OC or any other technology (TCONTROL, RTX-TUNER, or RX-TUNER) is activated on other tabs,
HYDRA will automatically enable autoload along with the automatic
activation of these technologies. By default, autoload is set to the taskbar,
but you can change it to the system tray in the settings menu (gear icon in
the upper right corner).
Important note:
How do you know everything is ready for HYBRID OC activation? It’s
simple—the tables will be filled with various data.
Important note 2:
If the tables contain only the default values, you will almost certainly
experience system crashes or very low performance.
Important note 3:
If you disable HYBRID OC and no other technologies such as TCONTROL, RTX-TUNER, or RX-TUNER are enabled at that time,
then HYDRA will not autoload on the next system startup.
TABLE OF CONTENTS (CLICK)
HYDRA 1.8H PRO
36
37.
HYBRID OC - ADDITIONAL SETTINGSThis settings block is constantly evolving and is often simplified to
enhance the user experience. The
Dynamic profile VID for LT
and Dynamic profile VID for MT settings allow for dynamic adjustment of
HYBRID OC profile voltages based on the THM parameter, which you can
find in the Profiles Table (HYBRID OC tab). In essence, if the processor
temperature is below THM, enabling either Dynamic profile VID for LT or
MT allows the voltage to increase until the temperature reaches the THM
value. Conversely, if the processor temperature exceeds THM, the active
profile (and any profile permitted for dynamic voltage regulation) will
reduce the voltage until the temperature aligns with the THM value.
Important note:
The dynamic voltage regulation range can be up to 200mV and
depends on various factors.
Important note 2:
Some user-specific scenarios may cause system stability issues
because HYDRA might not have predefined rules for certain types of
loads. To resolve stability problems, it is recommended to disable
these settings based on the profile in which the failure occurs.
TABLE OF CONTENTS (CLICK)
HYDRA 1.8H PRO
37
38.
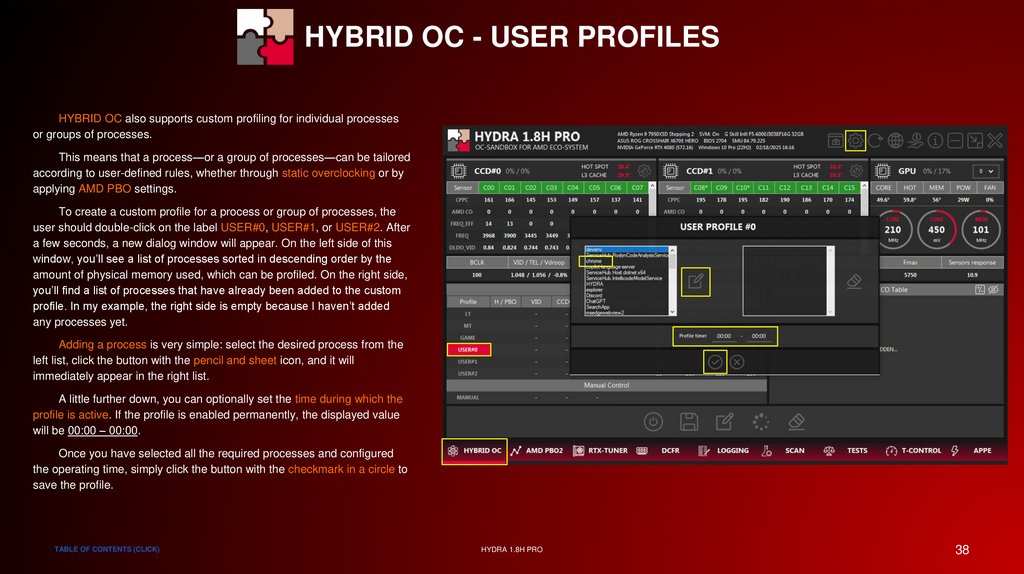
HYBRID OC - USER PROFILESHYBRID OC also supports custom profiling for individual processes
or groups of processes.
This means that a process—or a group of processes—can be tailored
according to user-defined rules, whether through static overclocking or by
applying AMD PBO settings.
To create a custom profile for a process or group of processes, the
user should double-click on the label USER#0, USER#1, or USER#2. After
a few seconds, a new dialog window will appear. On the left side of this
window, you’ll see a list of processes sorted in descending order by the
amount of physical memory used, which can be profiled. On the right side,
you’ll find a list of processes that have already been added to the custom
profile. In my example, the right side is empty because I haven’t added
any processes yet.
Adding a process is very simple: select the desired process from the
left list, click the button with the pencil and sheet icon, and it will
immediately appear in the right list.
A little further down, you can optionally set the time during which the
profile is active. If the profile is enabled permanently, the displayed value
will be 00:00 – 00:00.
Once you have selected all the required processes and configured
the operating time, simply click the button with the checkmark in a circle to
save the profile.
TABLE OF CONTENTS (CLICK)
HYDRA 1.8H PRO
38
39.
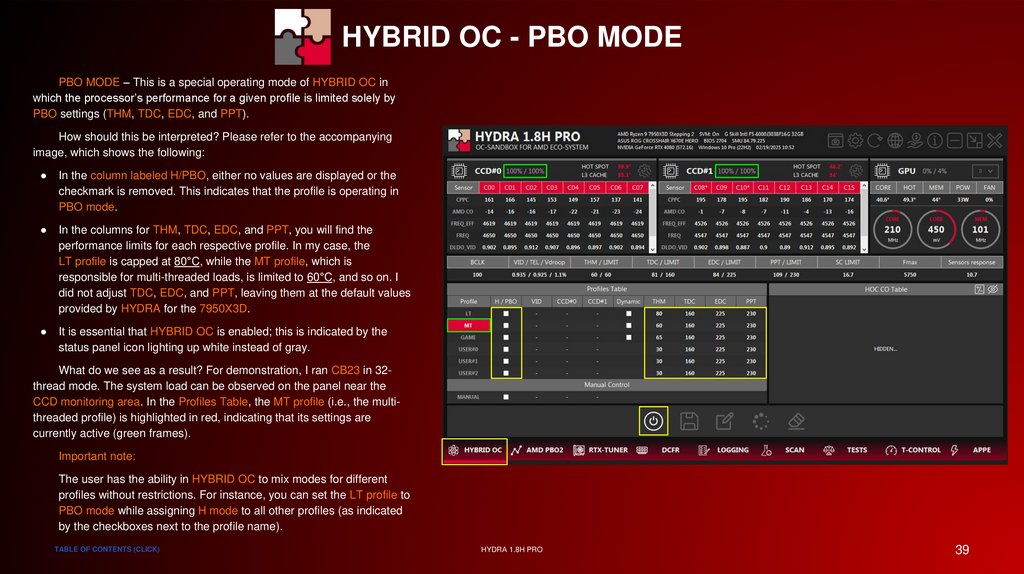
HYBRID OC - PBO MODEPBO MODE – This is a special operating mode of HYBRID OC in
which the processor’s performance for a given profile is limited solely by
PBO settings (THM, TDC, EDC, and PPT).
How should this be interpreted? Please refer to the accompanying
image, which shows the following:
In the column labeled H/PBO, either no values are displayed or the
checkmark is removed. This indicates that the profile is operating in
PBO mode.
In the columns for THM, TDC, EDC, and PPT, you will find the
performance limits for each respective profile. In my case, the
LT profile is capped at 80°C, while the MT profile, which is
responsible for multi-threaded loads, is limited to 60°C, and so on. I
did not adjust TDC, EDC, and PPT, leaving them at the default values
provided by HYDRA for the 7950X3D.
It is essential that HYBRID OC is enabled; this is indicated by the
status panel icon lighting up white instead of gray.
What do we see as a result? For demonstration, I ran CB23 in 32thread mode. The system load can be observed on the panel near the
CCD monitoring area. In the Profiles Table, the MT profile (i.e., the multithreaded profile) is highlighted in red, indicating that its settings are
currently active (green frames).
Important note:
The user has the ability in HYBRID OC to mix modes for different
profiles without restrictions. For instance, you can set the LT profile to
PBO mode while assigning H mode to all other profiles (as indicated
by the checkboxes next to the profile name).
TABLE OF CONTENTS (CLICK)
HYDRA 1.8H PRO
39
40.
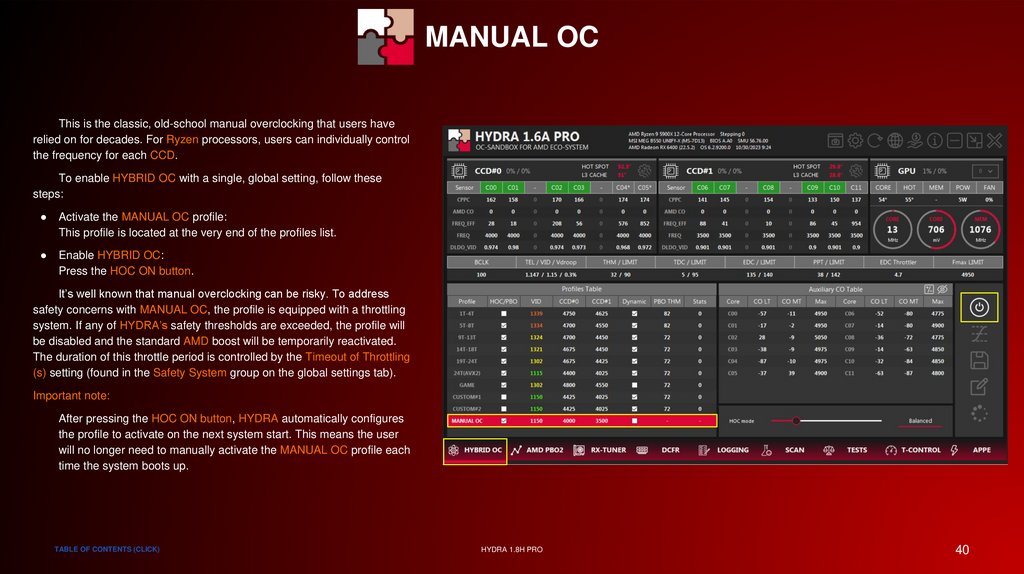
MANUAL OCThis is the classic, old-school manual overclocking that users have
relied on for decades. For Ryzen processors, users can individually control
the frequency for each CCD.
To enable HYBRID OC with a single, global setting, follow these
steps:
Activate the MANUAL OC profile:
This profile is located at the very end of the profiles list.
Enable HYBRID OC:
Press the HOC ON button.
It’s well known that manual overclocking can be risky. To address
safety concerns with MANUAL OC, the profile is equipped with a throttling
system. If any of HYDRA’s safety thresholds are exceeded, the profile will
be disabled and the standard AMD boost will be temporarily reactivated.
The duration of this throttle period is controlled by the Timeout of Throttling
(s) setting (found in the Safety System group on the global settings tab).
Important note:
After pressing the HOC ON button, HYDRA automatically configures
the profile to activate on the next system start. This means the user
will no longer need to manually activate the MANUAL OC profile each
time the system boots up.
TABLE OF CONTENTS (CLICK)
HYDRA 1.8H PRO
40
41.
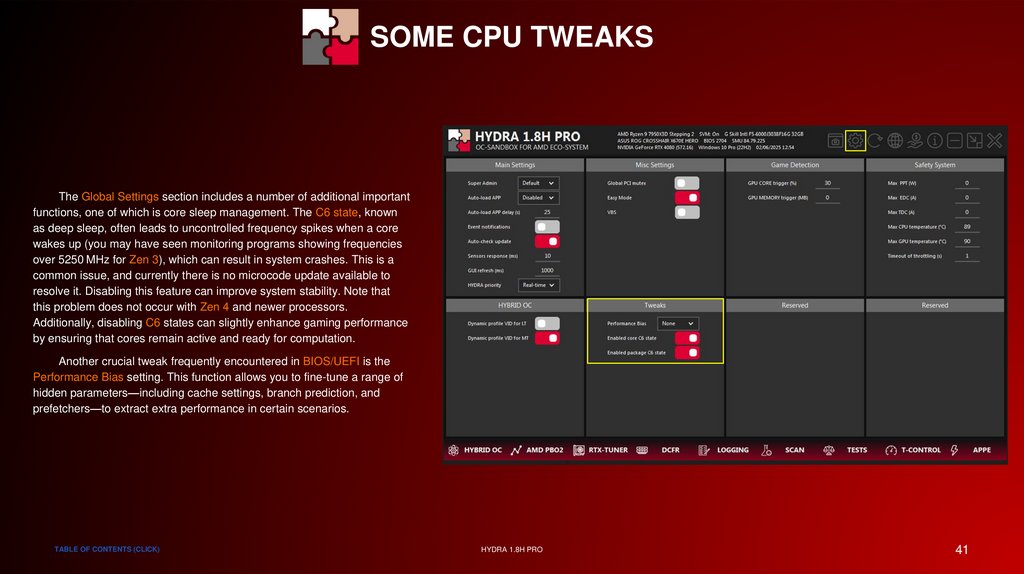
SOME CPU TWEAKSThe Global Settings section includes a number of additional important
functions, one of which is core sleep management. The C6 state, known
as deep sleep, often leads to uncontrolled frequency spikes when a core
wakes up (you may have seen monitoring programs showing frequencies
over 5250 MHz for Zen 3), which can result in system crashes. This is a
common issue, and currently there is no microcode update available to
resolve it. Disabling this feature can improve system stability. Note that
this problem does not occur with Zen 4 and newer processors.
Additionally, disabling C6 states can slightly enhance gaming performance
by ensuring that cores remain active and ready for computation.
Another crucial tweak frequently encountered in BIOS/UEFI is the
Performance Bias setting. This function allows you to fine-tune a range of
hidden parameters—including cache settings, branch prediction, and
prefetchers—to extract extra performance in certain scenarios.
TABLE OF CONTENTS (CLICK)
HYDRA 1.8H PRO
41
42.
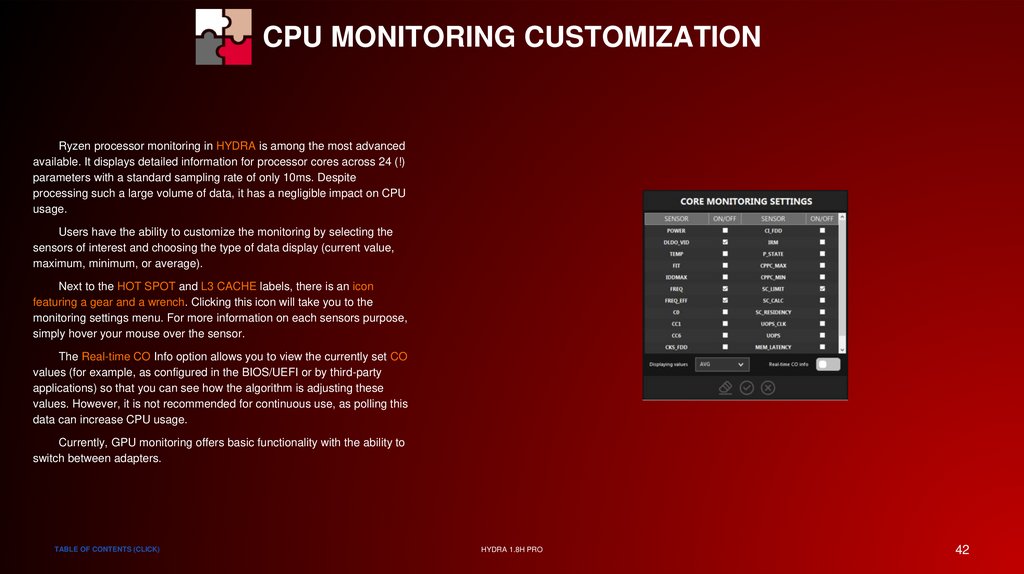
CPU MONITORING CUSTOMIZATIONRyzen processor monitoring in HYDRA is among the most advanced
available. It displays detailed information for processor cores across 24 (!)
parameters with a standard sampling rate of only 10ms. Despite
processing such a large volume of data, it has a negligible impact on CPU
usage.
Users have the ability to customize the monitoring by selecting the
sensors of interest and choosing the type of data display (current value,
maximum, minimum, or average).
Next to the HOT SPOT and L3 CACHE labels, there is an icon
featuring a gear and a wrench. Clicking this icon will take you to the
monitoring settings menu. For more information on each sensors purpose,
simply hover your mouse over the sensor.
The Real-time CO Info option allows you to view the currently set CO
values (for example, as configured in the BIOS/UEFI or by third-party
applications) so that you can see how the algorithm is adjusting these
values. However, it is not recommended for continuous use, as polling this
data can increase CPU usage.
Currently, GPU monitoring offers basic functionality with the ability to
switch between adapters.
TABLE OF CONTENTS (CLICK)
HYDRA 1.8H PRO
42
43.
SPECIAL THANKSGPU SECTION
TABLE OF CONTENTS (CLICK)
HYDRA 1.8H PRO
43
44.
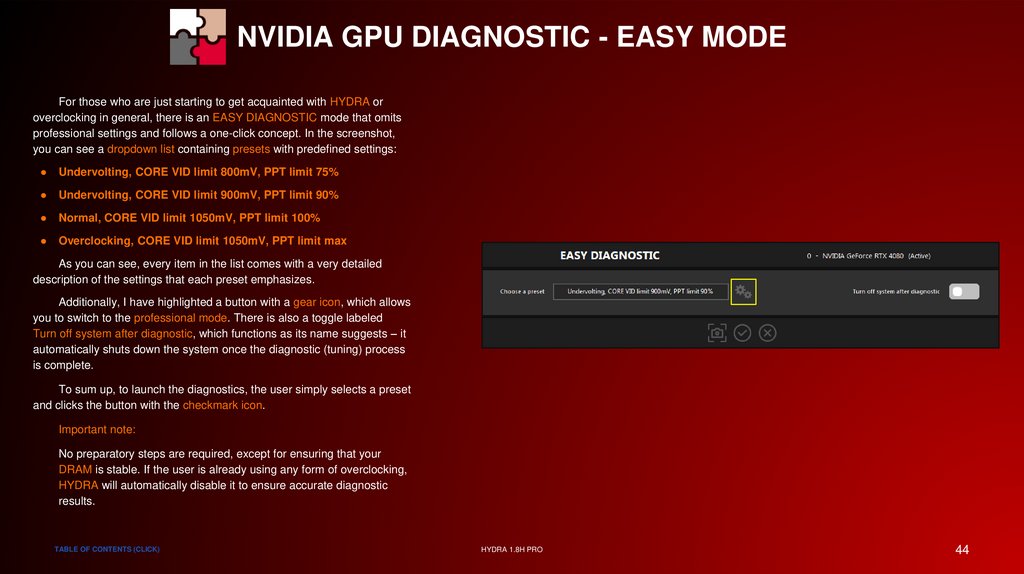
NVIDIA GPU DIAGNOSTIC - EASY MODEFor those who are just starting to get acquainted with HYDRA or
overclocking in general, there is an EASY DIAGNOSTIC mode that omits
professional settings and follows a one-click concept. In the screenshot,
you can see a dropdown list containing presets with predefined settings:
Undervolting, CORE VID limit 800mV, PPT limit 75%
Undervolting, CORE VID limit 900mV, PPT limit 90%
Normal, CORE VID limit 1050mV, PPT limit 100%
Overclocking, CORE VID limit 1050mV, PPT limit max
As you can see, every item in the list comes with a very detailed
description of the settings that each preset emphasizes.
Additionally, I have highlighted a button with a gear icon, which allows
you to switch to the professional mode. There is also a toggle labeled
Turn off system after diagnostic, which functions as its name suggests – it
automatically shuts down the system once the diagnostic (tuning) process
is complete.
To sum up, to launch the diagnostics, the user simply selects a preset
and clicks the button with the checkmark icon.
Important note:
No preparatory steps are required, except for ensuring that your
DRAM is stable. If the user is already using any form of overclocking,
HYDRA will automatically disable it to ensure accurate diagnostic
results.
TABLE OF CONTENTS (CLICK)
HYDRA 1.8H PRO
44
45.
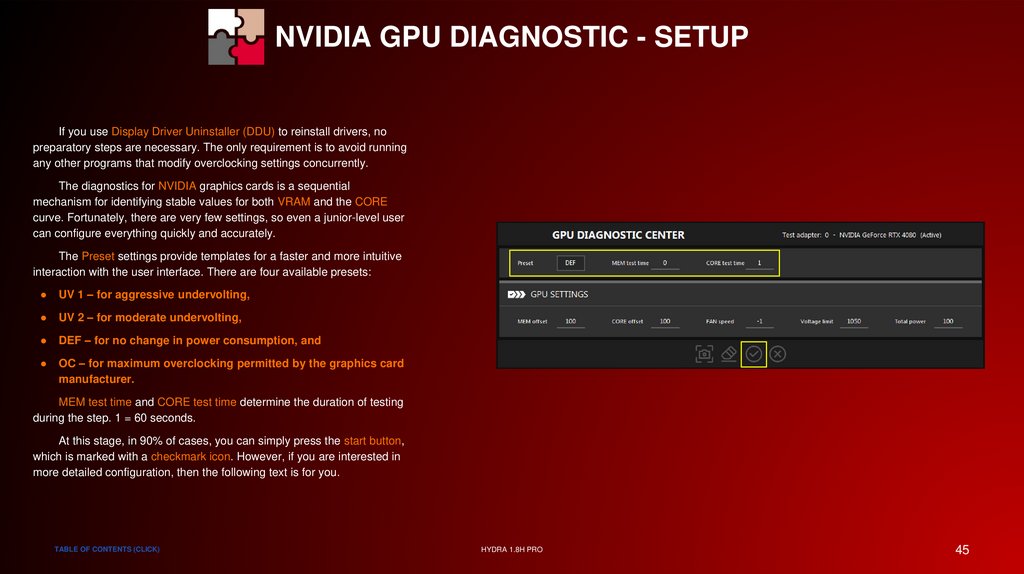
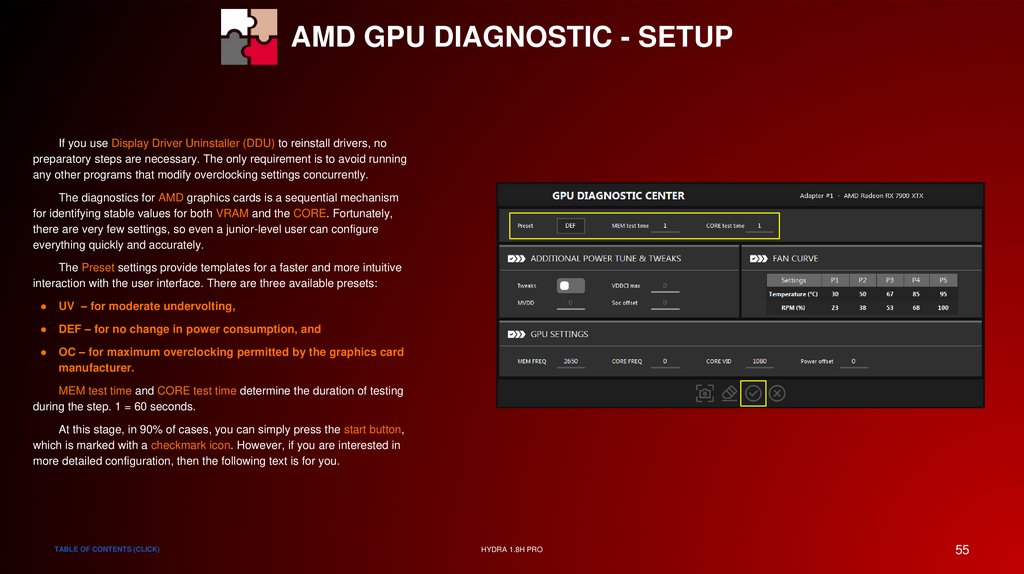
NVIDIA GPU DIAGNOSTIC - SETUPIf you use Display Driver Uninstaller (DDU) to reinstall drivers, no
preparatory steps are necessary. The only requirement is to avoid running
any other programs that modify overclocking settings concurrently.
The diagnostics for NVIDIA graphics cards is a sequential
mechanism for identifying stable values for both VRAM and the CORE
curve. Fortunately, there are very few settings, so even a junior-level user
can configure everything quickly and accurately.
The Preset settings provide templates for a faster and more intuitive
interaction with the user interface. There are four available presets:
UV 1 – for aggressive undervolting,
UV 2 – for moderate undervolting,
DEF – for no change in power consumption, and
OC – for maximum overclocking permitted by the graphics card
manufacturer.
MEM test time and CORE test time determine the duration of testing
during the step. 1 = 60 seconds.
At this stage, in 90% of cases, you can simply press the start button,
which is marked with a checkmark icon. However, if you are interested in
more detailed configuration, then the following text is for you.
TABLE OF CONTENTS (CLICK)
HYDRA 1.8H PRO
45
46.
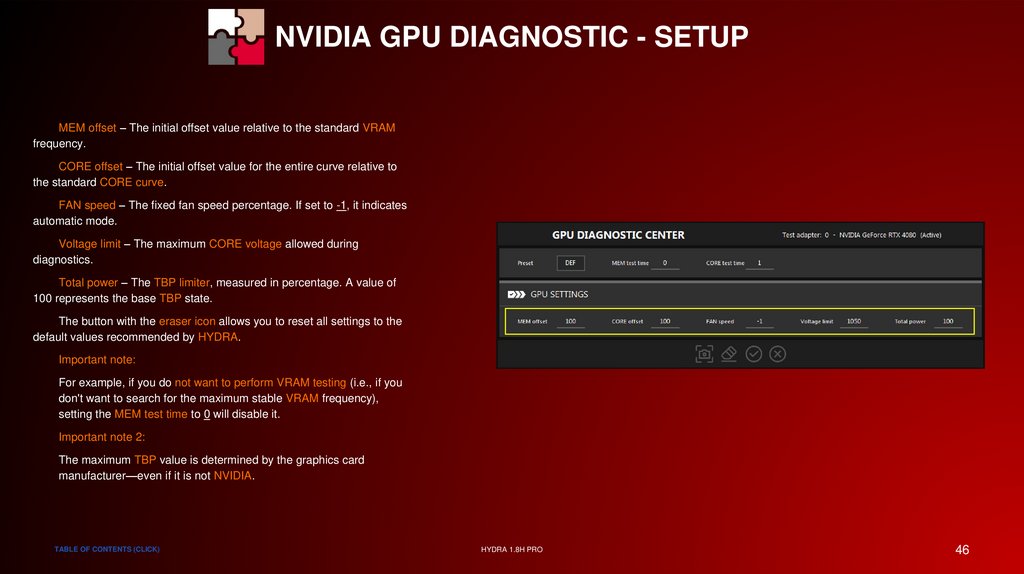
NVIDIA GPU DIAGNOSTIC - SETUPMEM offset – The initial offset value relative to the standard VRAM
frequency.
CORE offset – The initial offset value for the entire curve relative to
the standard CORE curve.
FAN speed – The fixed fan speed percentage. If set to -1, it indicates
automatic mode.
Voltage limit – The maximum CORE voltage allowed during
diagnostics.
Total power – The TBP limiter, measured in percentage. A value of
100 represents the base TBP state.
The button with the eraser icon allows you to reset all settings to the
default values recommended by HYDRA.
Important note:
For example, if you do not want to perform VRAM testing (i.e., if you
don't want to search for the maximum stable VRAM frequency),
setting the MEM test time to 0 will disable it.
Important note 2:
The maximum TBP value is determined by the graphics card
manufacturer—even if it is not NVIDIA.
TABLE OF CONTENTS (CLICK)
HYDRA 1.8H PRO
46
47.
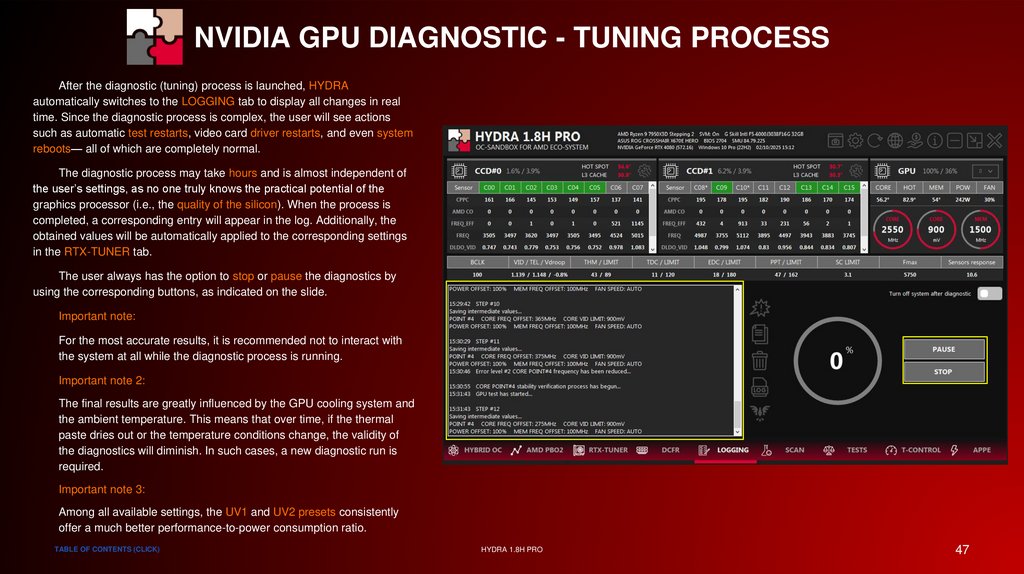
NVIDIA GPU DIAGNOSTIC - TUNING PROCESSAfter the diagnostic (tuning) process is launched, HYDRA
automatically switches to the LOGGING tab to display all changes in real
time. Since the diagnostic process is complex, the user will see actions
such as automatic test restarts, video card driver restarts, and even system
reboots— all of which are completely normal.
The diagnostic process may take hours and is almost independent of
the user’s settings, as no one truly knows the practical potential of the
graphics processor (i.e., the quality of the silicon). When the process is
completed, a corresponding entry will appear in the log. Additionally, the
obtained values will be automatically applied to the corresponding settings
in the RTX-TUNER tab.
The user always has the option to stop or pause the diagnostics by
using the corresponding buttons, as indicated on the slide.
Important note:
For the most accurate results, it is recommended not to interact with
the system at all while the diagnostic process is running.
Important note 2:
The final results are greatly influenced by the GPU cooling system and
the ambient temperature. This means that over time, if the thermal
paste dries out or the temperature conditions change, the validity of
the diagnostics will diminish. In such cases, a new diagnostic run is
required.
Important note 3:
Among all available settings, the UV1 and UV2 presets consistently
offer a much better performance-to-power consumption ratio.
TABLE OF CONTENTS (CLICK)
HYDRA 1.8H PRO
47
48.
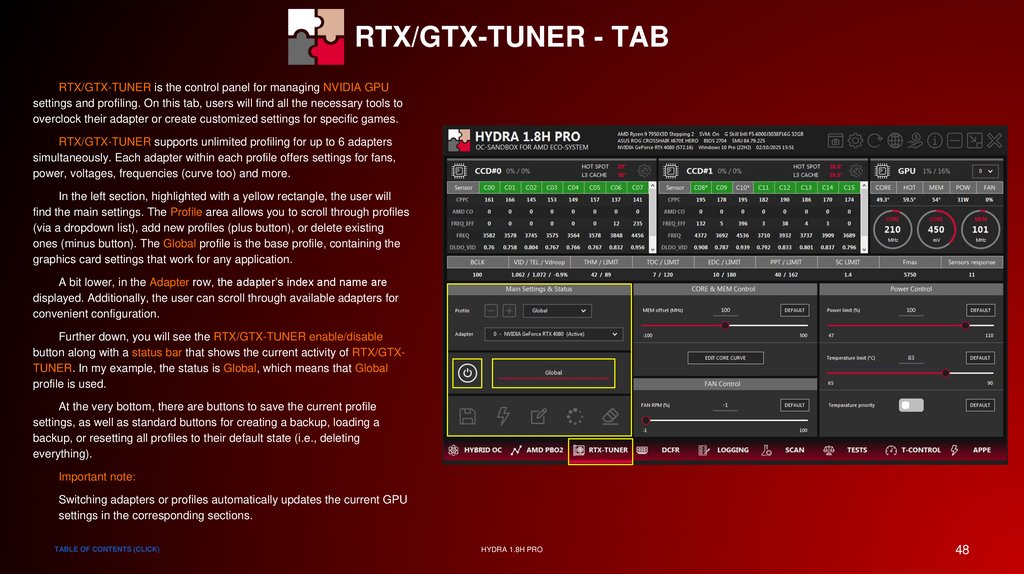
RTX/GTX-TUNER - TABRTX/GTX-TUNER is the control panel for managing NVIDIA GPU
settings and profiling. On this tab, users will find all the necessary tools to
overclock their adapter or create customized settings for specific games.
RTX/GTX-TUNER supports unlimited profiling for up to 6 adapters
simultaneously. Each adapter within each profile offers settings for fans,
power, voltages, frequencies (curve too) and more.
In the left section, highlighted with a yellow rectangle, the user will
find the main settings. The Profile area allows you to scroll through profiles
(via a dropdown list), add new profiles (plus button), or delete existing
ones (minus button). The Global profile is the base profile, containing the
graphics card settings that work for any application.
A bit lower, in the Adapter row, the adapter’s index and name are
displayed. Additionally, the user can scroll through available adapters for
convenient configuration.
Further down, you will see the RTX/GTX-TUNER enable/disable
button along with a status bar that shows the current activity of RTX/GTXTUNER. In my example, the status is Global, which means that Global
profile is used.
At the very bottom, there are buttons to save the current profile
settings, as well as standard buttons for creating a backup, loading a
backup, or resetting all profiles to their default state (i.e., deleting
everything).
Important note:
Switching adapters or profiles automatically updates the current GPU
settings in the corresponding sections.
TABLE OF CONTENTS (CLICK)
HYDRA 1.8H PRO
48
49.
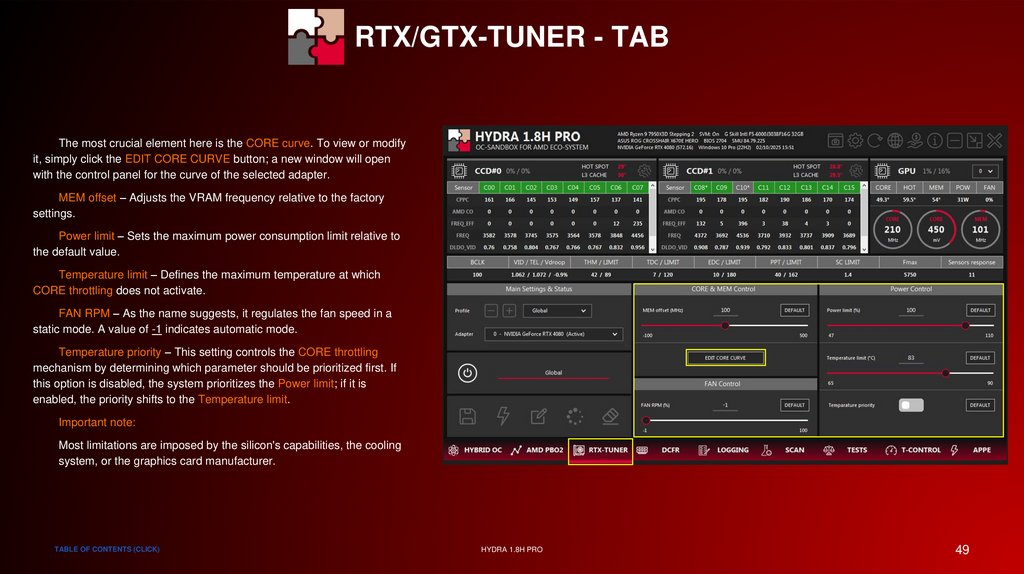
RTX/GTX-TUNER - TABThe most crucial element here is the CORE curve. To view or modify
it, simply click the EDIT CORE CURVE button; a new window will open
with the control panel for the curve of the selected adapter.
MEM offset – Adjusts the VRAM frequency relative to the factory
settings.
Power limit – Sets the maximum power consumption limit relative to
the default value.
Temperature limit – Defines the maximum temperature at which
CORE throttling does not activate.
FAN RPM – As the name suggests, it regulates the fan speed in a
static mode. A value of -1 indicates automatic mode.
Temperature priority – This setting controls the CORE throttling
mechanism by determining which parameter should be prioritized first. If
this option is disabled, the system prioritizes the Power limit; if it is
enabled, the priority shifts to the Temperature limit.
Important note:
Most limitations are imposed by the silicon's capabilities, the cooling
system, or the graphics card manufacturer.
TABLE OF CONTENTS (CLICK)
HYDRA 1.8H PRO
49
50.
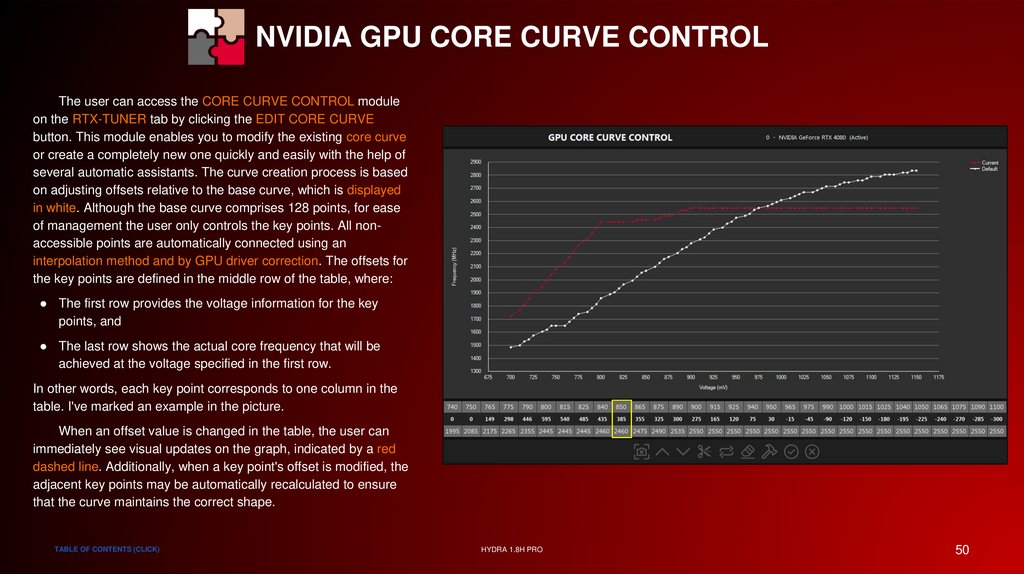
NVIDIA GPU CORE CURVE CONTROLThe user can access the CORE CURVE CONTROL module
on the RTX-TUNER tab by clicking the EDIT CORE CURVE
button. This module enables you to modify the existing core curve
or create a completely new one quickly and easily with the help of
several automatic assistants. The curve creation process is based
on adjusting offsets relative to the base curve, which is displayed
in white. Although the base curve comprises 128 points, for ease
of management the user only controls the key points. All nonaccessible points are automatically connected using an
interpolation method and by GPU driver correction. The offsets for
the key points are defined in the middle row of the table, where:
● The first row provides the voltage information for the key
points, and
● The last row shows the actual core frequency that will be
achieved at the voltage specified in the first row.
In other words, each key point corresponds to one column in the
table. I've marked an example in the picture.
When an offset value is changed in the table, the user can
immediately see visual updates on the graph, indicated by a red
dashed line. Additionally, when a key point's offset is modified, the
adjacent key points may be automatically recalculated to ensure
that the curve maintains the correct shape.
TABLE OF CONTENTS (CLICK)
HYDRA 1.8H PRO
50
51.
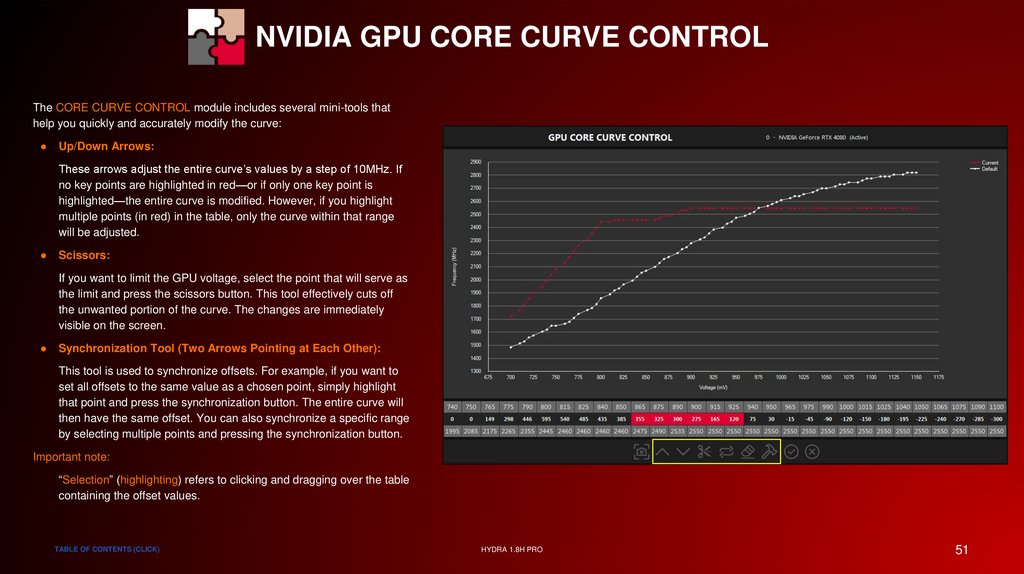
NVIDIA GPU CORE CURVE CONTROLThe CORE CURVE CONTROL module includes several mini-tools that
help you quickly and accurately modify the curve:
Up/Down Arrows:
These arrows adjust the entire curve’s values by a step of 10MHz. If
no key points are highlighted in red—or if only one key point is
highlighted—the entire curve is modified. However, if you highlight
multiple points (in red) in the table, only the curve within that range
will be adjusted.
Scissors:
If you want to limit the GPU voltage, select the point that will serve as
the limit and press the scissors button. This tool effectively cuts off
the unwanted portion of the curve. The changes are immediately
visible on the screen.
Synchronization Tool (Two Arrows Pointing at Each Other):
This tool is used to synchronize offsets. For example, if you want to
set all offsets to the same value as a chosen point, simply highlight
that point and press the synchronization button. The entire curve will
then have the same offset. You can also synchronize a specific range
by selecting multiple points and pressing the synchronization button.
Important note:
“Selection” (highlighting) refers to clicking and dragging over the table
containing the offset values.
TABLE OF CONTENTS (CLICK)
HYDRA 1.8H PRO
51
52.
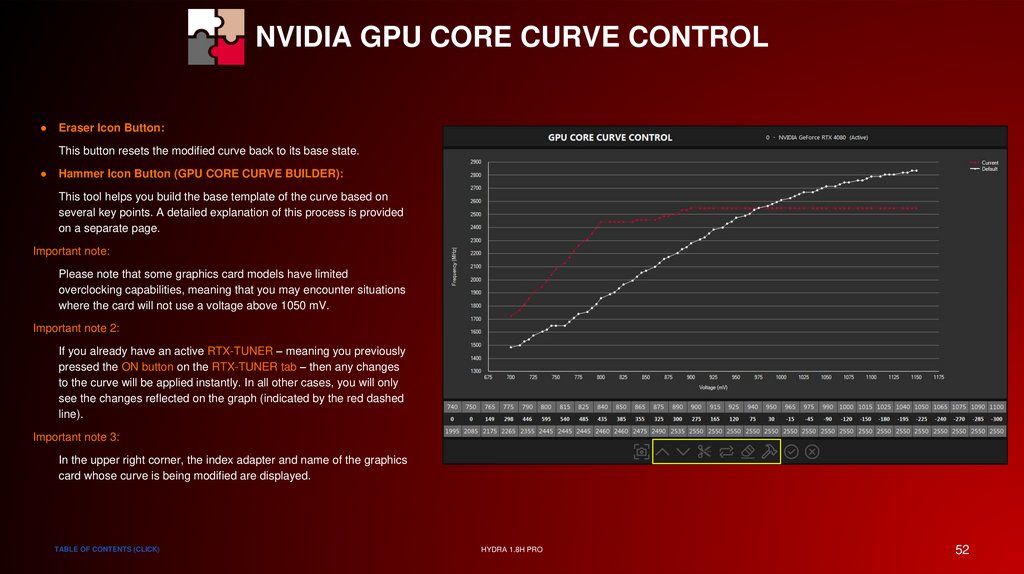
NVIDIA GPU CORE CURVE CONTROLEraser Icon Button:
This button resets the modified curve back to its base state.
Hammer Icon Button (GPU CORE CURVE BUILDER):
This tool helps you build the base template of the curve based on
several key points. A detailed explanation of this process is provided
on a separate page.
Important note:
Please note that some graphics card models have limited
overclocking capabilities, meaning that you may encounter situations
where the card will not use a voltage above 1050 mV.
Important note 2:
If you already have an active RTX-TUNER – meaning you previously
pressed the ON button on the RTX-TUNER tab – then any changes
to the curve will be applied instantly. In all other cases, you will only
see the changes reflected on the graph (indicated by the red dashed
line).
Important note 3:
In the upper right corner, the index adapter and name of the graphics
card whose curve is being modified are displayed.
TABLE OF CONTENTS (CLICK)
HYDRA 1.8H PRO
52
53.
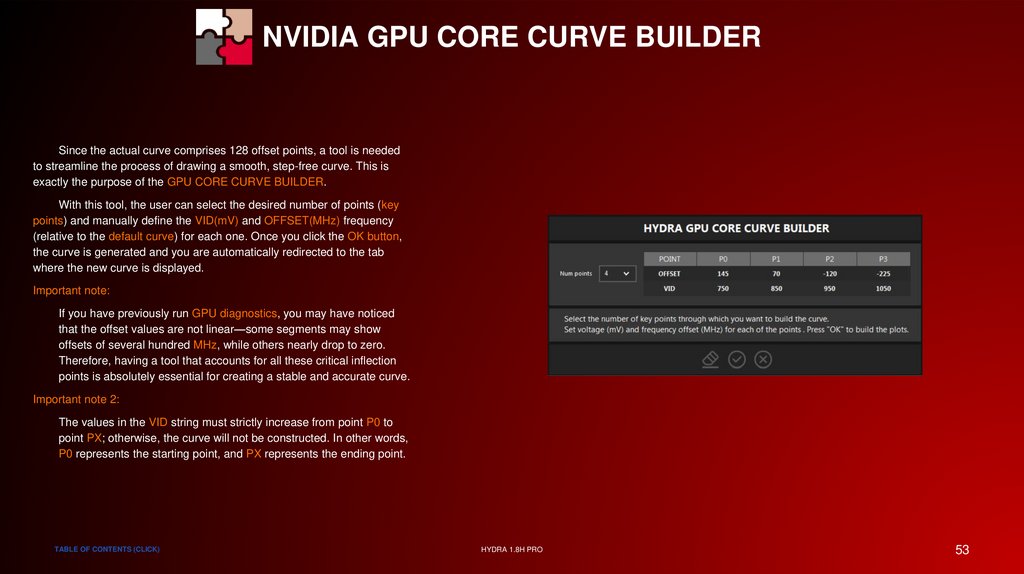
NVIDIA GPU CORE CURVE BUILDERSince the actual curve comprises 128 offset points, a tool is needed
to streamline the process of drawing a smooth, step-free curve. This is
exactly the purpose of the GPU CORE CURVE BUILDER.
With this tool, the user can select the desired number of points (key
points) and manually define the VID(mV) and OFFSET(MHz) frequency
(relative to the default curve) for each one. Once you click the OK button,
the curve is generated and you are automatically redirected to the tab
where the new curve is displayed.
Important note:
If you have previously run GPU diagnostics, you may have noticed
that the offset values are not linear—some segments may show
offsets of several hundred MHz, while others nearly drop to zero.
Therefore, having a tool that accounts for all these critical inflection
points is absolutely essential for creating a stable and accurate curve.
Important note 2:
The values in the VID string must strictly increase from point P0 to
point PX; otherwise, the curve will not be constructed. In other words,
P0 represents the starting point, and PX represents the ending point.
TABLE OF CONTENTS (CLICK)
HYDRA 1.8H PRO
53
54.
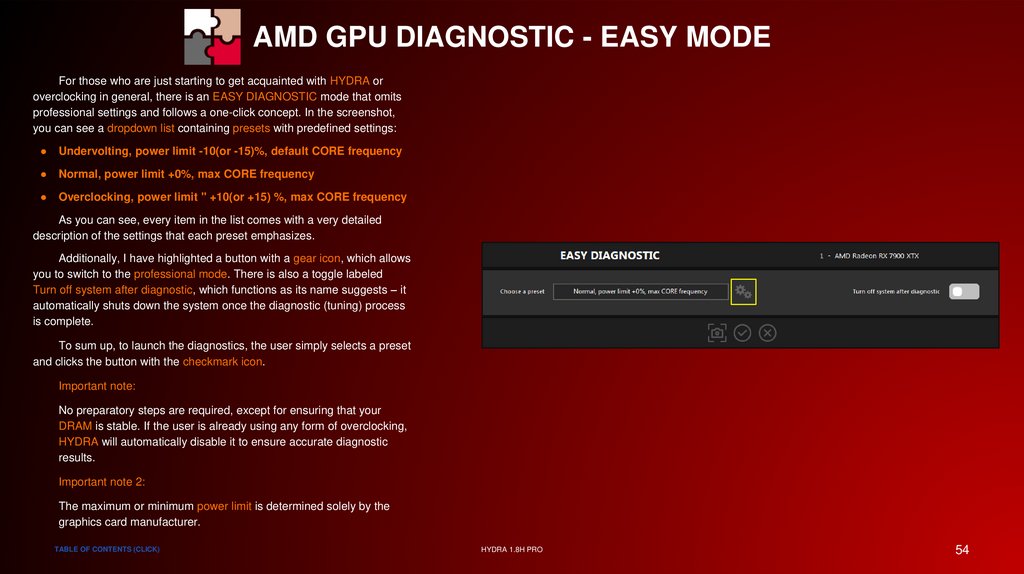
AMD GPU DIAGNOSTIC - EASY MODEFor those who are just starting to get acquainted with HYDRA or
overclocking in general, there is an EASY DIAGNOSTIC mode that omits
professional settings and follows a one-click concept. In the screenshot,
you can see a dropdown list containing presets with predefined settings:
Undervolting, power limit -10(or -15)%, default CORE frequency
Normal, power limit +0%, max CORE frequency
Overclocking, power limit " +10(or +15) %, max CORE frequency
As you can see, every item in the list comes with a very detailed
description of the settings that each preset emphasizes.
Additionally, I have highlighted a button with a gear icon, which allows
you to switch to the professional mode. There is also a toggle labeled
Turn off system after diagnostic, which functions as its name suggests – it
automatically shuts down the system once the diagnostic (tuning) process
is complete.
To sum up, to launch the diagnostics, the user simply selects a preset
and clicks the button with the checkmark icon.
Important note:
No preparatory steps are required, except for ensuring that your
DRAM is stable. If the user is already using any form of overclocking,
HYDRA will automatically disable it to ensure accurate diagnostic
results.
Important note 2:
The maximum or minimum power limit is determined solely by the
graphics card manufacturer.
TABLE OF CONTENTS (CLICK)
HYDRA 1.8H PRO
54
55.
AMD GPU DIAGNOSTIC - SETUPIf you use Display Driver Uninstaller (DDU) to reinstall drivers, no
preparatory steps are necessary. The only requirement is to avoid running
any other programs that modify overclocking settings concurrently.
The diagnostics for AMD graphics cards is a sequential mechanism
for identifying stable values for both VRAM and the CORE. Fortunately,
there are very few settings, so even a junior-level user can configure
everything quickly and accurately.
The Preset settings provide templates for a faster and more intuitive
interaction with the user interface. There are three available presets:
UV – for moderate undervolting,
DEF – for no change in power consumption, and
OC – for maximum overclocking permitted by the graphics card
manufacturer.
MEM test time and CORE test time determine the duration of testing
during the step. 1 = 60 seconds.
At this stage, in 90% of cases, you can simply press the start button,
which is marked with a checkmark icon. However, if you are interested in
more detailed configuration, then the following text is for you.
TABLE OF CONTENTS (CLICK)
HYDRA 1.8H PRO
55
56.
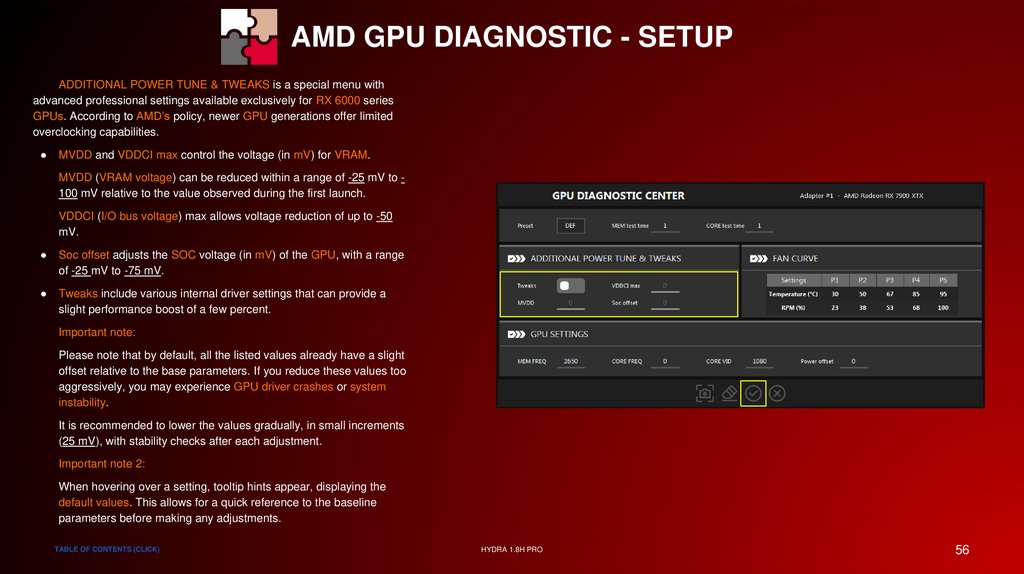
AMD GPU DIAGNOSTIC - SETUPADDITIONAL POWER TUNE & TWEAKS is a special menu with
advanced professional settings available exclusively for RX 6000 series
GPUs. According to AMD’s policy, newer GPU generations offer limited
overclocking capabilities.
MVDD and VDDCI max control the voltage (in mV) for VRAM.
MVDD (VRAM voltage) can be reduced within a range of -25 mV to 100 mV relative to the value observed during the first launch.
VDDCI (I/O bus voltage) max allows voltage reduction of up to -50
mV.
Soc offset adjusts the SOC voltage (in mV) of the GPU, with a range
of -25 mV to -75 mV.
Tweaks include various internal driver settings that can provide a
slight performance boost of a few percent.
Important note:
Please note that by default, all the listed values already have a slight
offset relative to the base parameters. If you reduce these values too
aggressively, you may experience GPU driver crashes or system
instability.
It is recommended to lower the values gradually, in small increments
(25 mV), with stability checks after each adjustment.
Important note 2:
When hovering over a setting, tooltip hints appear, displaying the
default values. This allows for a quick reference to the baseline
parameters before making any adjustments.
TABLE OF CONTENTS (CLICK)
HYDRA 1.8H PRO
56
57.
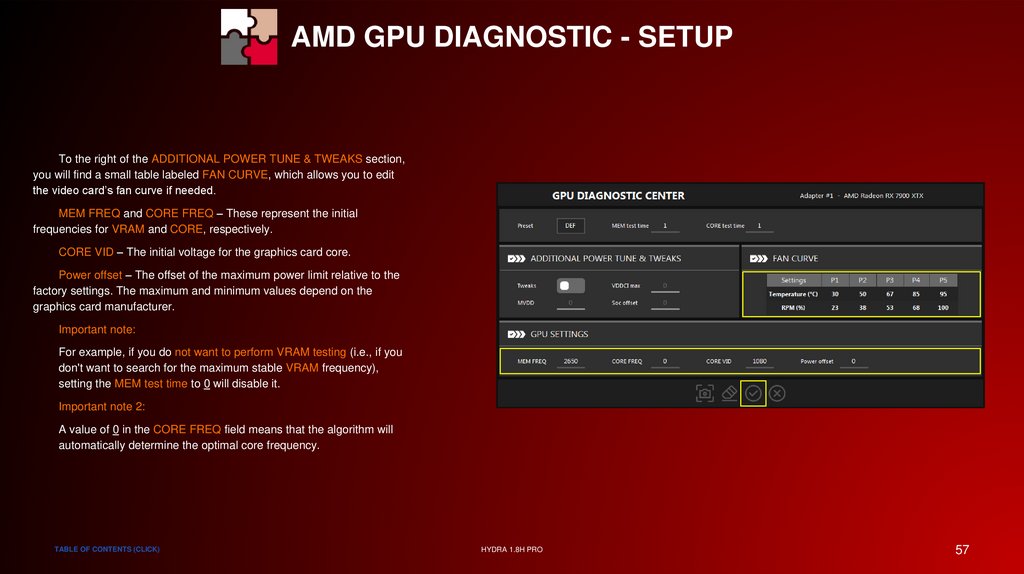
AMD GPU DIAGNOSTIC - SETUPTo the right of the ADDITIONAL POWER TUNE & TWEAKS section,
you will find a small table labeled FAN CURVE, which allows you to edit
the video card’s fan curve if needed.
MEM FREQ and CORE FREQ – These represent the initial
frequencies for VRAM and CORE, respectively.
CORE VID – The initial voltage for the graphics card core.
Power offset – The offset of the maximum power limit relative to the
factory settings. The maximum and minimum values depend on the
graphics card manufacturer.
Important note:
For example, if you do not want to perform VRAM testing (i.e., if you
don't want to search for the maximum stable VRAM frequency),
setting the MEM test time to 0 will disable it.
Important note 2:
A value of 0 in the CORE FREQ field means that the algorithm will
automatically determine the optimal core frequency.
TABLE OF CONTENTS (CLICK)
HYDRA 1.8H PRO
57
58.
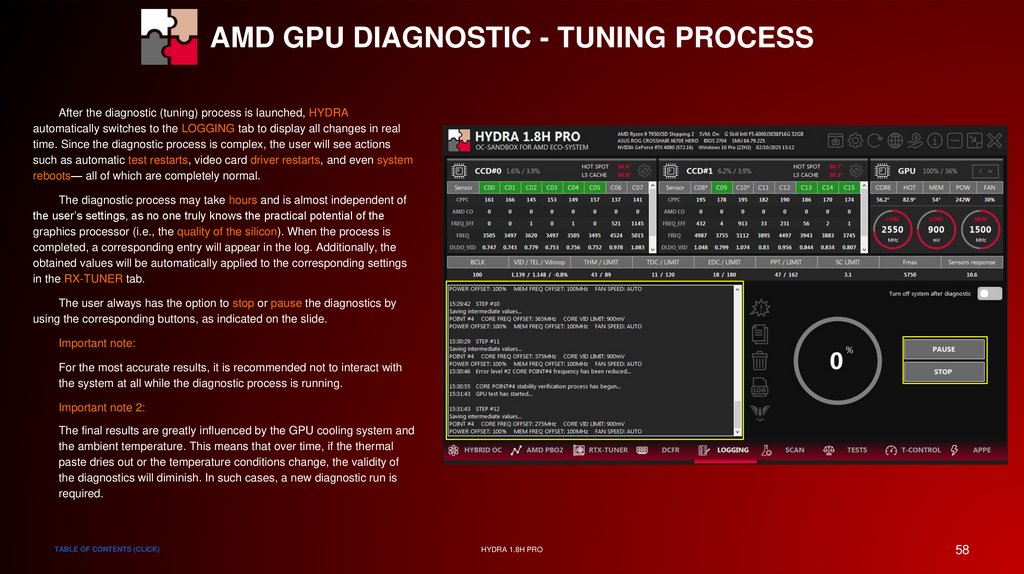
AMD GPU DIAGNOSTIC - TUNING PROCESSAfter the diagnostic (tuning) process is launched, HYDRA
automatically switches to the LOGGING tab to display all changes in real
time. Since the diagnostic process is complex, the user will see actions
such as automatic test restarts, video card driver restarts, and even system
reboots— all of which are completely normal.
The diagnostic process may take hours and is almost independent of
the user’s settings, as no one truly knows the practical potential of the
graphics processor (i.e., the quality of the silicon). When the process is
completed, a corresponding entry will appear in the log. Additionally, the
obtained values will be automatically applied to the corresponding settings
in the RX-TUNER tab.
The user always has the option to stop or pause the diagnostics by
using the corresponding buttons, as indicated on the slide.
Important note:
For the most accurate results, it is recommended not to interact with
the system at all while the diagnostic process is running.
Important note 2:
The final results are greatly influenced by the GPU cooling system and
the ambient temperature. This means that over time, if the thermal
paste dries out or the temperature conditions change, the validity of
the diagnostics will diminish. In such cases, a new diagnostic run is
required.
TABLE OF CONTENTS (CLICK)
HYDRA 1.8H PRO
58
59.
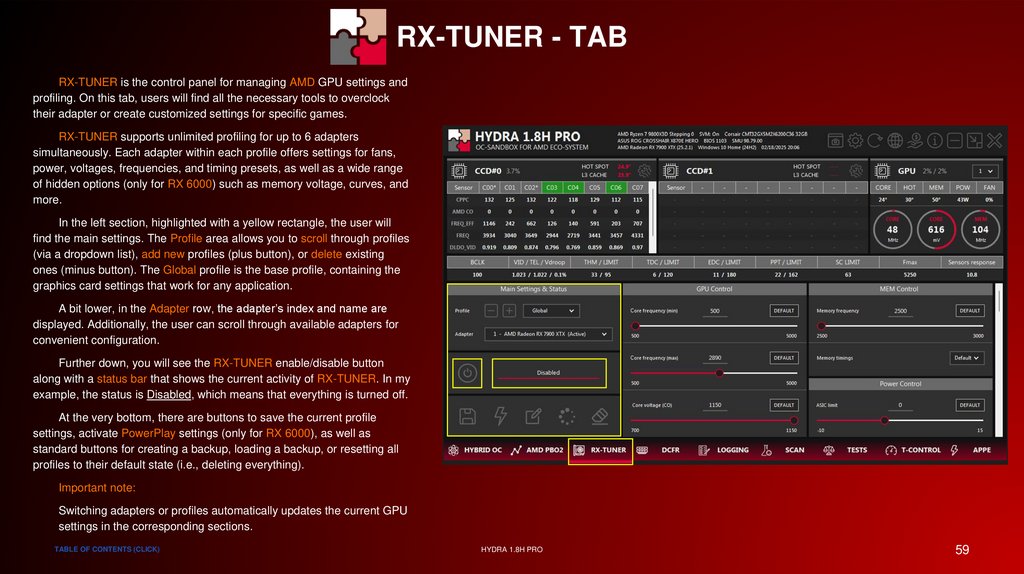
RX-TUNER - TABRX-TUNER is the control panel for managing AMD GPU settings and
profiling. On this tab, users will find all the necessary tools to overclock
their adapter or create customized settings for specific games.
RX-TUNER supports unlimited profiling for up to 6 adapters
simultaneously. Each adapter within each profile offers settings for fans,
power, voltages, frequencies, and timing presets, as well as a wide range
of hidden options (only for RX 6000) such as memory voltage, curves, and
more.
In the left section, highlighted with a yellow rectangle, the user will
find the main settings. The Profile area allows you to scroll through profiles
(via a dropdown list), add new profiles (plus button), or delete existing
ones (minus button). The Global profile is the base profile, containing the
graphics card settings that work for any application.
A bit lower, in the Adapter row, the adapter’s index and name are
displayed. Additionally, the user can scroll through available adapters for
convenient configuration.
Further down, you will see the RX-TUNER enable/disable button
along with a status bar that shows the current activity of RX-TUNER. In my
example, the status is Disabled, which means that everything is turned off.
At the very bottom, there are buttons to save the current profile
settings, activate PowerPlay settings (only for RX 6000), as well as
standard buttons for creating a backup, loading a backup, or resetting all
profiles to their default state (i.e., deleting everything).
Important note:
Switching adapters or profiles automatically updates the current GPU
settings in the corresponding sections.
TABLE OF CONTENTS (CLICK)
HYDRA 1.8H PRO
59
60.
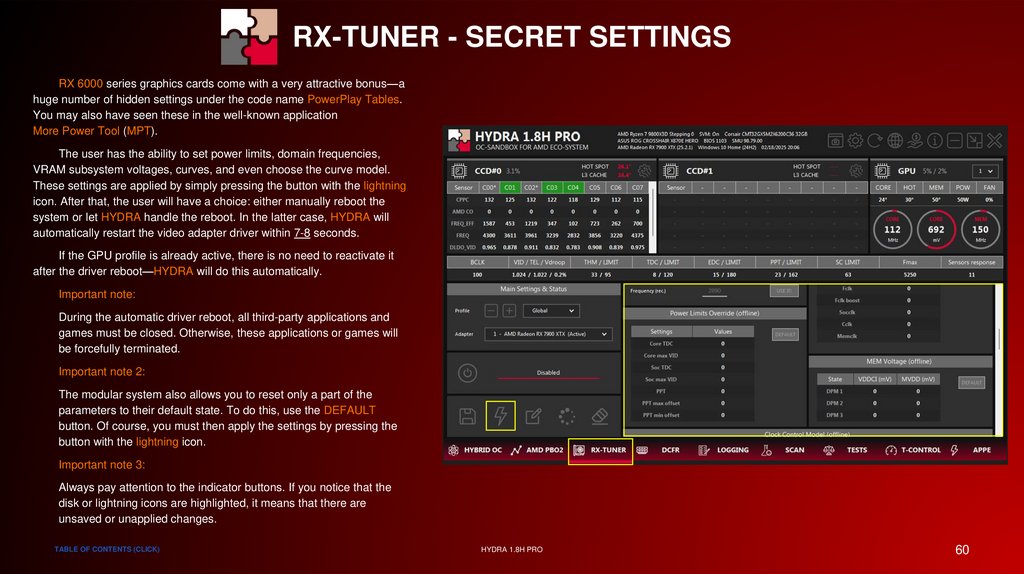
RX-TUNER - SECRET SETTINGSRX 6000 series graphics cards come with a very attractive bonus—a
huge number of hidden settings under the code name PowerPlay Tables.
You may also have seen these in the well-known application
More Power Tool (MPT).
The user has the ability to set power limits, domain frequencies,
VRAM subsystem voltages, curves, and even choose the curve model.
These settings are applied by simply pressing the button with the lightning
icon. After that, the user will have a choice: either manually reboot the
system or let HYDRA handle the reboot. In the latter case, HYDRA will
automatically restart the video adapter driver within 7-8 seconds.
If the GPU profile is already active, there is no need to reactivate it
after the driver reboot—HYDRA will do this automatically.
Important note:
During the automatic driver reboot, all third-party applications and
games must be closed. Otherwise, these applications or games will
be forcefully terminated.
Important note 2:
The modular system also allows you to reset only a part of the
parameters to their default state. To do this, use the DEFAULT
button. Of course, you must then apply the settings by pressing the
button with the lightning icon.
Important note 3:
Always pay attention to the indicator buttons. If you notice that the
disk or lightning icons are highlighted, it means that there are
unsaved or unapplied changes.
TABLE OF CONTENTS (CLICK)
HYDRA 1.8H PRO
60
61.
SPECIAL THANKSDRAM SECTION
TABLE OF CONTENTS (CLICK)
HYDRA 1.8H PRO
61
62.
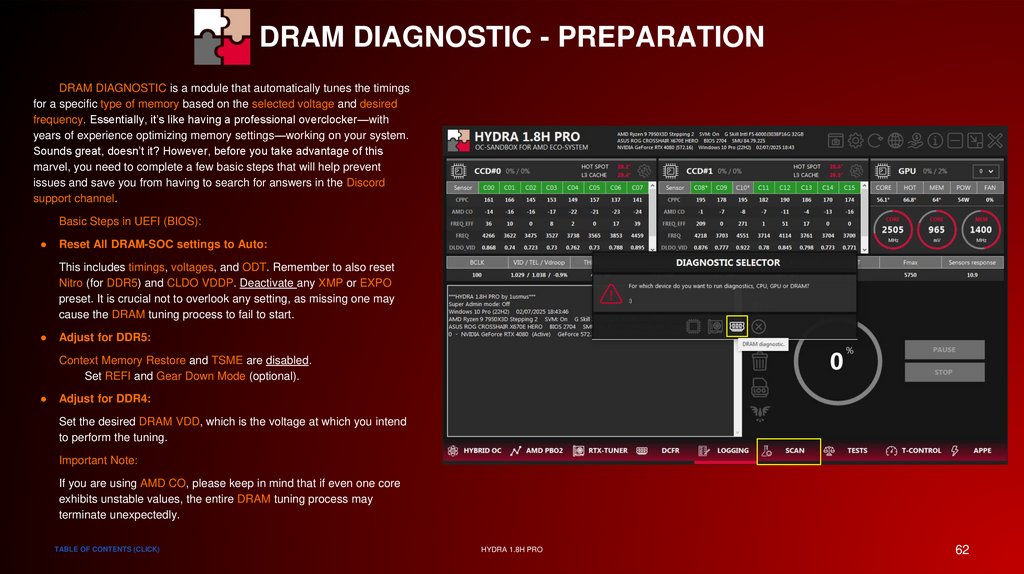
SPECIAL THANKSDRAM DIAGNOSTIC - PREPARATION
DRAM DIAGNOSTIC is a module that automatically tunes the timings
for a specific type of memory based on the selected voltage and desired
frequency. Essentially, it’s like having a professional overclocker—with
years of experience optimizing memory settings—working on your system.
Sounds great, doesn’t it? However, before you take advantage of this
marvel, you need to complete a few basic steps that will help prevent
issues and save you from having to search for answers in the Discord
support channel.
Basic Steps in UEFI (BIOS):
Reset All DRAM-SOC settings to Auto:
This includes timings, voltages, and ODT. Remember to also reset
Nitro (for DDR5) and CLDO VDDP. Deactivate any XMP or EXPO
preset. It is crucial not to overlook any setting, as missing one may
cause the DRAM tuning process to fail to start.
Adjust for DDR5:
Context Memory Restore and TSME are disabled.
Set REFI and Gear Down Mode (optional).
Adjust for DDR4:
Set the desired DRAM VDD, which is the voltage at which you intend
to perform the tuning.
Important Note:
If you are using AMD CO, please keep in mind that if even one core
exhibits unstable values, the entire DRAM tuning process may
terminate unexpectedly.
TABLE OF CONTENTS (CLICK)
HYDRA 1.8H PRO
62
63.
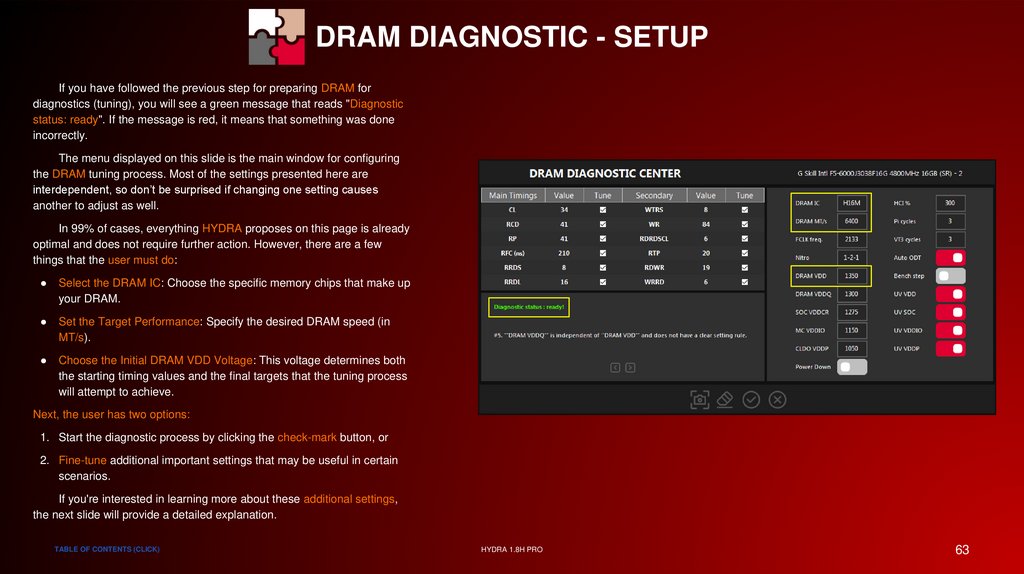
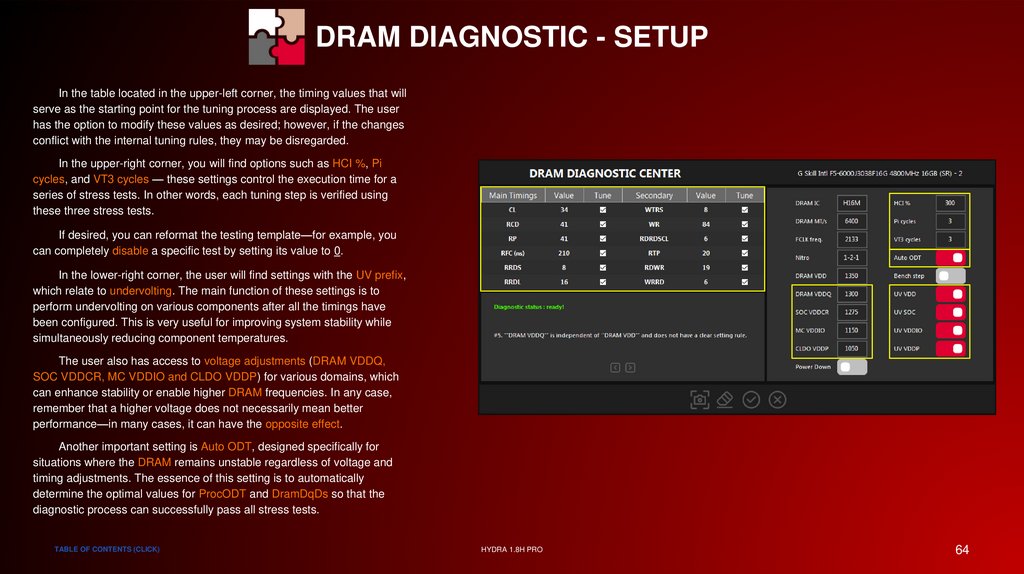
SPECIAL THANKSDRAM DIAGNOSTIC - SETUP
If you have followed the previous step for preparing DRAM for
diagnostics (tuning), you will see a green message that reads "Diagnostic
status: ready". If the message is red, it means that something was done
incorrectly.
The menu displayed on this slide is the main window for configuring
the DRAM tuning process. Most of the settings presented here are
interdependent, so don’t be surprised if changing one setting causes
another to adjust as well.
In 99% of cases, everything HYDRA proposes on this page is already
optimal and does not require further action. However, there are a few
things that the user must do:
Select the DRAM IC: Choose the specific memory chips that make up
your DRAM.
Set the Target Performance: Specify the desired DRAM speed (in
MT/s).
Choose the Initial DRAM VDD Voltage: This voltage determines both
the starting timing values and the final targets that the tuning process
will attempt to achieve.
Next, the user has two options:
1. Start the diagnostic process by clicking the check-mark button, or
2. Fine-tune additional important settings that may be useful in certain
scenarios.
If you're interested in learning more about these additional settings,
the next slide will provide a detailed explanation.
TABLE OF CONTENTS (CLICK)
HYDRA 1.8H PRO
63
64.
SPECIAL THANKSDRAM DIAGNOSTIC - SETUP
In the table located in the upper-left corner, the timing values that will
serve as the starting point for the tuning process are displayed. The user
has the option to modify these values as desired; however, if the changes
conflict with the internal tuning rules, they may be disregarded.
In the upper-right corner, you will find options such as HCI %, Pi
cycles, and VT3 cycles — these settings control the execution time for a
series of stress tests. In other words, each tuning step is verified using
these three stress tests.
If desired, you can reformat the testing template—for example, you
can completely disable a specific test by setting its value to 0.
In the lower-right corner, the user will find settings with the UV prefix,
which relate to undervolting. The main function of these settings is to
perform undervolting on various components after all the timings have
been configured. This is very useful for improving system stability while
simultaneously reducing component temperatures.
The user also has access to voltage adjustments (DRAM VDDQ,
SOC VDDCR, MC VDDIO and CLDO VDDP) for various domains, which
can enhance stability or enable higher DRAM frequencies. In any case,
remember that a higher voltage does not necessarily mean better
performance—in many cases, it can have the opposite effect.
Another important setting is Auto ODT, designed specifically for
situations where the DRAM remains unstable regardless of voltage and
timing adjustments. The essence of this setting is to automatically
determine the optimal values for ProcODT and DramDqDs so that the
diagnostic process can successfully pass all stress tests.
TABLE OF CONTENTS (CLICK)
HYDRA 1.8H PRO
64
65.
SPECIAL THANKSDRAM DIAGNOSTIC - SETUP
The final settings I want to discuss are Power Down and Nitro. The
first option primarily reduces latency by disabling various power-saving
systems. The second option is responsible for tuning the data bus. This is
a very important setting that can either boost performance—albeit at the
cost of reduced headroom—or enhance stability while only slightly
affecting performance; it’s a bit like a seesaw. In most cases, HYDRA will
automatically recommend the optimal configuration for the selected
DRAM MT/s. If you wish to create an additional safety margin, choose a
Nitro value that is higher than the recommended setting (i.e., larger
numbers).
In the lower-left corner, there is a mini-assistant that provides various
tips which the user can scroll through.
If you have altered the settings beyond recognition and wish to revert
to the default configuration, simply click the button with the eraser icon.
This button resets all settings to their default values as determined optimal
by HYDRA.
Important note:
Since DDR4 is a simpler type of memory, the number of settings
available in HYDRA is significantly fewer. Therefore, do not try to find
options that are intended for DDR5.
Important note 2:
The user only has access to the key timings. All other timings that are
not directly presented are calculated based on these key timings to
enhance both stability and performance.
TABLE OF CONTENTS (CLICK)
HYDRA 1.8H PRO
65
66.
SPECIAL THANKSDRAM DIAGNOSTIC - TUNING PROCESS
After the user confirms the start of the DRAM diagnostic (tuning)
process, the system will reboot to apply all settings and begin stress
testing. On this slide, you can view the log that displays the current DRAM
settings. All information regarding the progress of the tests or any errors
will be recorded in this log.
Please note that the process may take a long time, as HYDRA
sequentially verifies the stability of timing groups and other settings—it can
last 5 hours or more.
The key point is: do not interact with the system, do not run any
applications, and even avoid using your browser during this process.
Otherwise, if there is insufficient memory, you may compromise the entire
test result.
Also, don't worry if HYDRA reboots the system after every step—this
is completely normal, as the system needs to restart to properly apply the
settings.
If you urgently need to use your computer, you can press the PAUSE
button to temporarily suspend the process.
Pressing the STOP button completely halts the diagnostic process;
however, it does not reset the memory settings to their default values.
Important note:
When the diagnostic process is completed, the user will be informed
via the log. The optimization results will remain in effect and will not
require reactivation.
TABLE OF CONTENTS (CLICK)
HYDRA 1.8H PRO
66
67.
SPECIAL THANKSDRAM CALCULATOR FOR RYZEN (DCFR)
DCFR is an evolutionary step beyond the DRAM Calculator for
Ryzen. The new version offers advanced DRAM monitoring, automatic
detection of memory ranks and module count, and the ability to apply
either preset or custom values with a single click. It also supports DDR5
memory.
The primary goal of this module is to help users optimize their
memory settings to achieve additional performance gains in various
scenarios or to correct misconfigurations from previous setups. One of the
simplest methods for memory tuning is to use the built-in presets. Users
have access to two options: FAST PRESET and OPTIMAL PRESET. The
only difference between them is that the OPTIMAL PRESET provides
improved stability (with minimal loss of performance).
To receive a preset suggestion from HYDRA, the user must first
select the DRAM IC (chip type) and the desired Memory Speed (MT/s),
and then click on either the GET OPTIMAL PRESET or GET FAST
PRESET button. After this action, the columns labeled "Preset" will display
the recommended values.
At this stage, the user has the option to activate the preset by clicking
the APPLY SETTINGS button, or to manually adjust some values and then
press APPLY SETTINGS.
Important Note:
The APPLY SETTINGS button only becomes active when the user
modifies at least one value in the table column labeled "Preset."
TABLE OF CONTENTS (CLICK)
HYDRA 1.8H PRO
67
68.
SPECIAL THANKSDRAM CALCULATOR FOR RYZEN (DCFR)
Presets cannot guarantee that your DRAM will operate exactly as
specified due to a number of technical reasons. That’s why there is an
alternative tool to help you fine-tune your settings more efficiently –
manual tuning. Changing individual parameters is straightforward, thanks
to an intuitive interface and built-in assistants that guide you through the
proper sequence.
The voltage input fields are equipped with protective safeguards to
prevent any damage to the processor or DRAM.
The CHECK / UNCHECK TIMINGS function allows you to verify the
user-defined timings in the system for any inconsistencies or calculation
errors. The status is displayed using three colors – green, yellow, and
red.In other words, if the value is displayed in green, it means you are
using the optimal setting; if it is yellow, there is still room to lower the
value; and if it appears in red, the value is set incorrectly. Please note that
the accuracy of this check depends on the selected chip type; in my case,
it is Hynix M-die.
Important note:
For the presets to be applied correctly in UEFI (BIOS), all DRAM
settings must be set to Auto mode. If any DRAM setting is not in Auto
mode, HYDRA may be unable to modify it. Additionally, some
motherboards might restrict voltage adjustments—in such cases, the
user will need to make the necessary changes manually (only applies
to DDR4).
TABLE OF CONTENTS (CLICK)
HYDRA 1.8H PRO
68
69.
SPECIAL THANKSDRAM CALCULATOR FOR RYZEN (DCFR)
Regarding manual adjustments instead of using the provided presets,
it’s very simple: you simply change the value in the "Preset" column of any
table to your desired value, and that's it. Once the APPLY SETTINGS
button becomes active, you can apply these changes.
For example, I modified several settings: VDIMM (DRAM VDD),
VDDQ, CL, and Nitro.
Important Note:
For all the modified settings to take effect, HYDRA will reboot the
system. This reboot process always takes some time—for example,
with DDR5 memory, it can take several minutes.
Important Note 2:
If you notice that the system becomes unstable after toggling the
settings, disable the Memory Context Restore function in UEFI
(BIOS). This will allow the system to properly “train” itself on every
startup.
Important Note 3:
You might be wondering where all these settings are "sent." You can
find everything in the UEFI (BIOS) menu under the label AMD
Overclocking.
Important Note 4:
Additionally, it is possible that your system may fail to boot. This issue
is not always due to a problem with the DRAM or the memory
controller located on the CPU; it is more likely caused by an issue
with AGESA (microcode).
TABLE OF CONTENTS (CLICK)
HYDRA 1.8H PRO
69
70.
SPECIAL THANKSDRAM BENCH
Have you completed DRAM diagnostics or found a new preset on the
forum? Great, then let's test its effectiveness. To do this, I have updated
the built-in benchmark called DRAM BENCH. Unlike AIDA and other
benchmarks we are accustomed to using, the set of tests in
DRAM BENCH is capable of assessing real performance, not just
theoretical.
During the development of this test suite, special attention was paid
to ensuring that the results are highly sensitive to even the smallest
changes in timings.
The test suite consists of:
MemBench – Measures the speed of executing a series of tasks.
The results are expressed in seconds.
Random Access Rd/Wr – Evaluates the performance of random
accesses to DRAM when handling data volumes that exceed the
cache capacity.
DRAM Latency – Provides a realistic assessment of latency (true
random access) by disabling hardware prefetchers. It shows the
delay from the moment of a "cold call," without assembler
optimizations and without the use of complex instructions such as
"prefetch" or "streaming store." In addition to the numerical result
displayed in the table, a graph is provided that illustrates latency
relative to the size of the data packet.
CORE DRAM Rd/Wr/Cp – Measures the actual throughput between
an individual CPU core and DRAM.
CCD DRAM Rd/Wr/Cp – Measures the actual throughput between
an entire CCD and DRAM.
TABLE OF CONTENTS (CLICK)
HYDRA 1.8H PRO
70
71.
SPECIAL THANKSDRAM BENCH
To simply test your current DRAM settings, just press the
DRAM BENCH button located on the TESTS page. Once pressed, the
testing process will begin and take approximately 10 minutes. All changes
and the progress of the test will be displayed on the LOGGING page, and
when the test is complete, HYDRA will automatically display a window with
graphs and tables.
Additionally, the user can compare the results of their experiments.
To do this, simply run a few experiments and then select from the
dropdown list the experiment against which you want to compare the
current (or the most recent) result.
For example, I performed a test using the EXPO preset, and then,
after modifying the RDWR and WRRD timings, I conducted another
experiment and selected the date of the first experiment for comparison.
As you can see in the upper-right corner, the timings have changed –
they are displayed in green along with a negative number indicating how
much they have changed. In this context, green is a positive sign.
In the table at the bottom, you can also see green values, numbers,
and percentages showing how much the result has improved merely by
adjusting two timings.
On the graph, the colors represent the memory regions: yellow
indicates L2 cache, orange represents L3 cache, and red corresponds to
DRAM.
TABLE OF CONTENTS (CLICK)
HYDRA 1.8H PRO
71
72.
SPECIAL THANKSDRAM BENCH
Additional features available in the results viewing mode include the
ability to scroll through experiment results using buttons with arrow icons,
as well as the option to delete the currently displayed experiment by
clicking the button with the trash bin icon.
Important note:
In comparison mode, if the color in the results table is white, it means
that the fluctuation does not exceed 0.25%—which is considered to
be within the measurement error.
Important note 2:
Keep in mind that DRAM performance is measured not only by
latency; there are many metrics presented on this slide. Good latency
does not necessarily guarantee the highest FPS or overall
performance. A comprehensive approach is required for proper
evaluation.
Important note 3:
If the preset being tested is unstable, no results will be generated for
the user.
Important note 4:
In most cases, the percentage change in the MemBench value
accurately reflects the actual change in FPS in games.
Important note 5:
Processors that do not support AVX2 instructions are not supported.
TABLE OF CONTENTS (CLICK)
HYDRA 1.8H PRO
72
73.
SPECIAL THANKSPING PONG BENCH
Another equally interesting test suite introduced in this update is
PING PONG. It is designed to evaluate inter-core communication,
specifically how quickly a core from one CCD can communicate with a
neighboring core or with a core residing on another CCD. This test suite
can highlight architectural weaknesses that affect the utilization of all cores
under high-intensity workloads or simply the quality of FCLK-CPU
overclocking.
After you press PING PONG BENCH (TESTS tab), a relatively long
benchmarking process will begin. After several minutes of waiting, the test
results will automatically appear in front of you as a colorful table filled with
numbers. It’s easy to deduce that the redder the color, the poorer the
result, and the greener the color, the better the result.
The control interface is very simple: in the upper-left corner, you will
find buttons to scroll through the experiments, while in the upper-right
corner there is a dropdown list of metrics. Changing these metrics will
update the visualization of the experiment results.
Perhaps the most interesting metric enabled in my example is MED
(median), as it best reflects the actual state of performance.
Important note:
Overclocking the CPU cores or FCLK can dramatically alter the
results. Additionally, other system tweaks—such as adjustments to
the C6 state—may also impact the outcomes.
Important note 2:
The new BIOS can also have a profound impact on the results,
potentially even causing issues.
TABLE OF CONTENTS (CLICK)
HYDRA 1.8H PRO
73
74.
PROJECT HYDRAOC-SANDBOX FOR AMD & NVIDIA ECO-SYSTEM
NEW FEATURES EVERY MONTH
1USMUS 2021-2025
75.
HYBRID OC - WORKING WITH PROFILESEach of the profiles you see in the table is designed to work
with a certain number of threads and a certain load. Each profile
has its own individual voltages, a so-called “base” frequency for
each CCD and the ability to work in dynamic or static mode. Of
course, all of the above can be set by the user himself.
If the user wants to change a value or a dynamic state, simply
edit the value. When you start editing the profile, HYBRID OC will
automatically turn off to avoid problems.
To help the user adjust the voltage, there is a color indication.
My recommendation is orange for low-threaded profiles and green
for multi-threaded profiles.
The frequencies for CCD1 and CCD2 are the start
frequencies through which the profiles are switched so that the
system is stable in all conditions. If the Dynamic state is enabled,
it means that the profile is able to ramp up and down frequency in
real time, depending on the load. Unlike AMD boost, HYBRID OC
technology is able to control the frequencies of each CCD
individually.
An important note. I recommend to run a profile rebuild after
each manual change of voltages in the profiles. To do this, run the
diagnostics with only one item enabled - PROFILE CREATION.
This procedure will not take more than a minute.
TABLE OF CONTENTS (CLICK)
HYDRA 1.8H PRO
75
76.
HYBRID OC - WORKING WITH PROFILESIt is also possible to disable the use of the profile. In this case
instead of this profile the standard AMD boost will be used, with or
without PBO2, depending on whether Using PBO2 is enabled in
the AMD PBO2 tab.
I suggest that you consider the following example, which you
see on the picture:
● I disabled the 1T-4T profile because I like the way the AMD
boost works on my CPU for tasks that don't use more than 4
threads (the name of the profile describes the number of
threads for which it exists). Note that the boost will be limited
by the temperature value - 82 degrees.
● I also disabled dynamic mode for the
ALL (GAME) profile, I don't want the CPU frequency to
change while playing.
That is, the user has the ability to build something of his own
from “LEGO”.
The CUSTOM#1 and CUSTOM#2 profiles assignment implies
that you attach your own profile to one of the applications, which
will be activated when you run the corresponding application. I will
talk about them in more detail on the next page.
TABLE OF CONTENTS (CLICK)
HYDRA 1.8H PRO
76
77.
HYBRID OC - HOC CO TABLEAs mentioned earlier, the Auxiliary CO Table is a table that is
essentially a correction table for AMD Curve Optimizer. Also this
table also contains the maximum allowable stable frequency for
each core.
All values here are the “heart” of control for all HYBRID OC
profiles. The user can manipulate data in real time without
disabling HYBRID OC. A CO change within ten milliseconds will
be accepted and the user can see the frequency change (or not).
Increasing CO will increase the frequency, decreasing CO will
decrease the frequency. It's simple here. Step size ? My
recommendation is a step of 5-10 units. If you enter a too high
value, the system will reboot and the settings will return to the
state of the previous save.
CO LT - controls the HYBRID OC boost for low-threaded
profiles. For Ryzen 9 - 1T-6T(8T), for Ryzen 5 and Ryzen 7 - 1T4T.
CO MT - controls the HYBRID OC boost for multithreaded profiles, i.e. for all other profiles that are not listed in the
paragraph above.
Max - defines the maximum frequency of which the active
core is not allowed to exceed. Roughly speaking, it is an
“emergency brake” on frequency increases in low-threaded loads.
Otherwise, the boost under no-load conditions may cause the
system to reboot.
TABLE OF CONTENTS (CLICK)
HYDRA 1.8H PRO
77
78.
HYBRID OC - STATUS INDICATORSThe data tables are also able to show the user which profile is
currently active, as well as CO values that are the “bottleneck” of
the system.
In my example, core 2 and core 9 prevent further frequency
ramp of the current profile (if dynamic mode is enabled). It is not
worth fighting this phenomenon because changing the CO values
will not improve the quality of the cores.
This indication can also help you to debug profiles if you
observe stability problems. It is enough to reduce the highlighted
value step by step (step 5 - 10) or to reduce the CO value for the
core number that is causing the failure (HYDRA ASSISTANT will
tell you after reboot).
In any case, you are free to conduct your own experiments.
You may also notice that the numbering of the cores has a
scarlet background - this means that all those cores are doing
some work.
TABLE OF CONTENTS (CLICK)
HYDRA 1.8H PRO
78
79.
HYBRID OC - CRASH THE SYSTEMSudden system reboots are among the most unsettling and
mysterious events. HYDRA ASSISTANT was introduced to
simplify troubleshooting, but before we review its suggestions, let's
consider the possible causes:
● An excessively high CO value in the AMD PBO2 tab or in the
HOC CO Table (within the HYBRID OC tab).
● The user manually set the maximum core frequency too high
in the HOC CO Table (found in the HYBRID OC tab).
● The user did not recreate the profiles after changing the
profile voltage (VID) or CO values.
● The base frequency for some profiles is set too high.
● The enabled Dynamic profile VID for LT (or MT) is not
capable of handling the current user scenario.
TABLE OF CONTENTS (CLICK)
HYDRA 1.8H PRO
79
80.
HYDRA ASSISTANTI think many of you may have been frightened by the list of
possible causes, so in this regard all changes will be done by
HYDRA ASSISTANT instead of you (you can too, if you give an
answer - ignore help). The user is still required to give a correct
answer, as before, which describes what the user was doing
before the failure occurred. As a result, HYDRA ASSISTANT will
automatically change the parameters for the core or cores that
caused the failure (this information is provided by the OS) and
saves changes. All the changes HYDRA ASSISTANT will make
can be seen on the LOGGING tab, a kind of "cheat sheet" for you.
As optional steps, the user may be prompted to:
● Re-create the profiles because the CO has changed.
● Clean the log of the operating system from the error records,
so that in the future when you restart HYDRA you will not be
prompted to corrected errors again, that have been recently
corrected.
I would like to note that the HYDRA ASSISTANT is quite
flexible and allows you to solve problems for:
● HYBRID OC
● AMD PBO2
TABLE OF CONTENTS (CLICK)
HYDRA 1.8H PRO
80