


 Менеджмент
Похожие презентации:


© 2010 W. W. Norton & Company, Inc. Preferences
1.
3© 2010 W. W. Norton & Company, Inc.
Preferences
2.
In this chapter,look for the answers to these questions
• What is “the best things”?
• What are preferences? How to describe?
• What are indifference curves?
• What are well-behaved preferences?
• What is Marginal rate of substitution?
How to calculate?
2015 Cengage
Learning.
All Rights
Reserved. MayInc.
not be copied, scanned, or duplicated, in whole or in part, except for use as
© ©2010
W. W.
Norton
& Company,
permitted in a license distributed with a certain product or service or otherwise on a password-protected website for classroom use.
2
3.
Rationality in EconomicsBehavioral Postulate:
A decisionmaker always chooses its
most preferred alternative from its
set of available alternatives.
So to model choice we must model
decisionmakers’ preferences.
© 2010 W. W. Norton & Company, Inc.
3
4.
My consumption choice set© 2010 W. W. Norton & Company, Inc.
4
5.
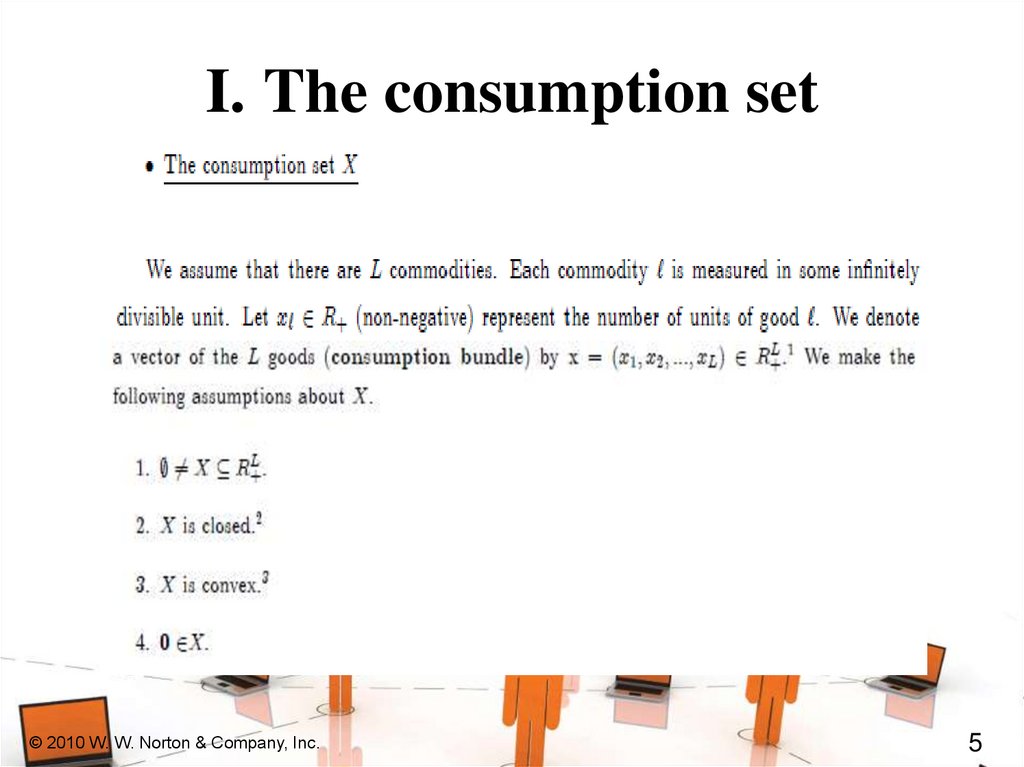
I. The consumption set© 2010 W. W. Norton & Company, Inc.
5
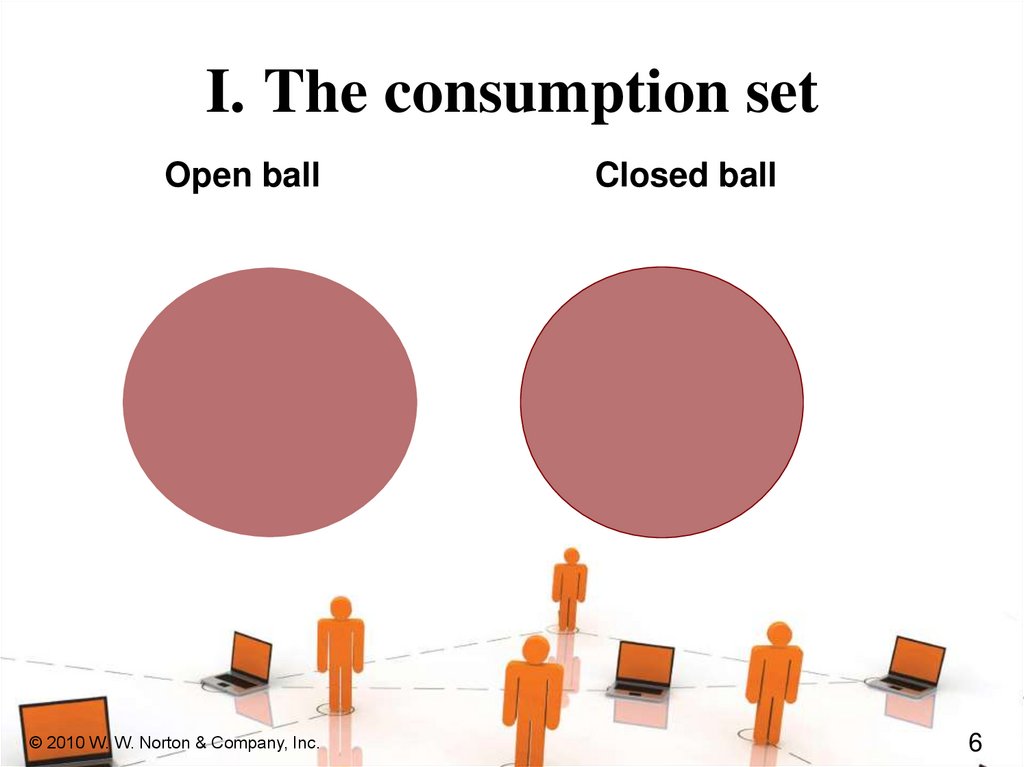
6.
I. The consumption setOpen ball
© 2010 W. W. Norton & Company, Inc.
Closed ball
6
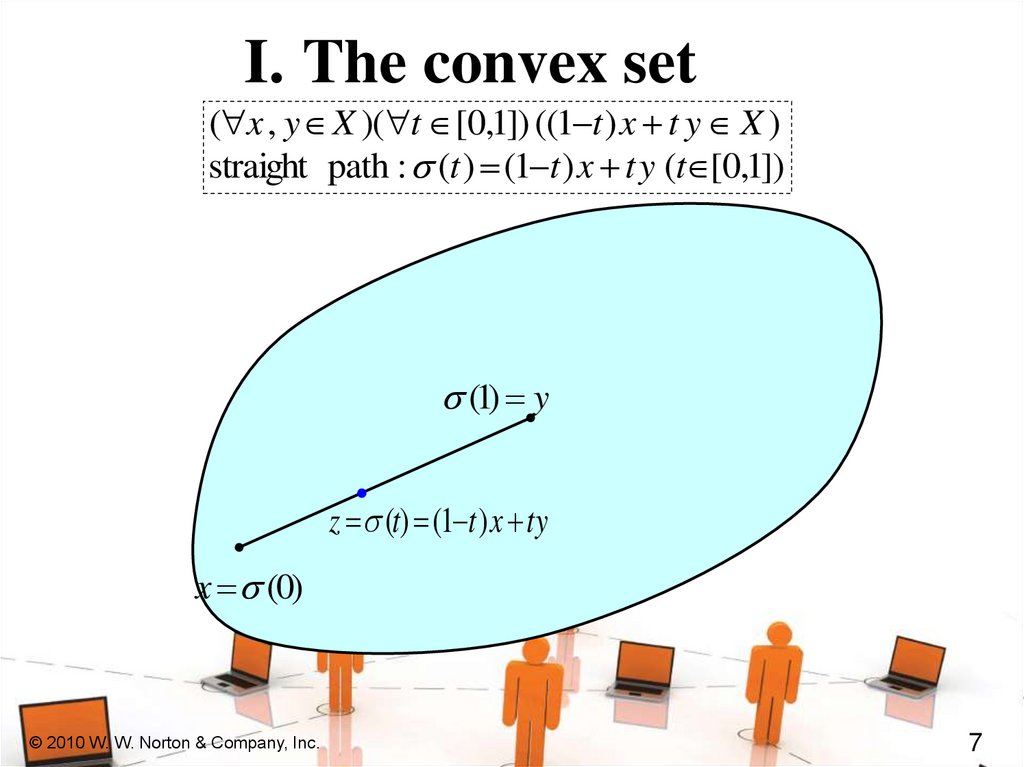
7.
I. The convex set( x , y X )( t [0,1]) ((1 t ) x t y X )
straight path : (t ) (1 t ) x t y (t [0,1])
(1) y
z (t) (1 t ) x ty
x (0)
© 2010 W. W. Norton & Company, Inc.
7
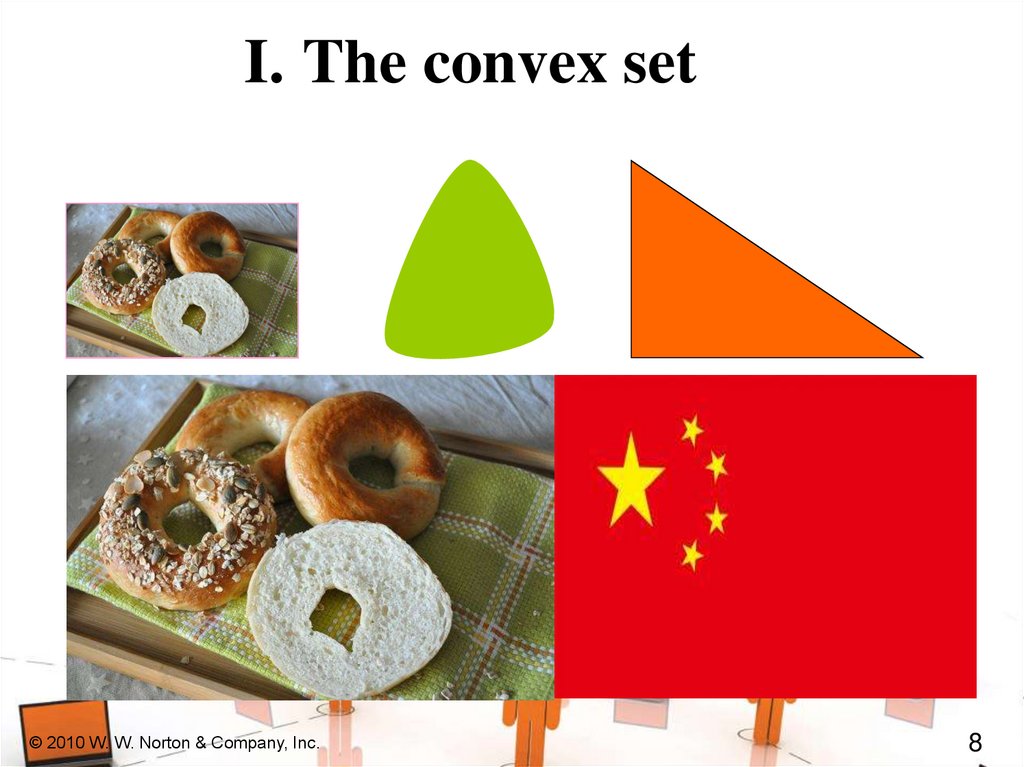
8.
I. The convex set© 2010 W. W. Norton & Company, Inc.
8
9.
II.The preference relation© 2010 W. W. Norton & Company, Inc.
9
10.
Preference RelationsComparing two different consumption
bundles, x and y:
– strict preference: x is more preferred
than is y.
– weak preference: x is as at least as
preferred as is y.
– indifference: x is exactly as preferred
as is y.
© 2010 W. W. Norton & Company, Inc.
10
11.
Preference RelationsStrict preference, weak preference
and indifference are all preference
relations.
Particularly, they are ordinal
relations; i.e. they state only the
order in which bundles are preferred.
© 2010 W. W. Norton & Company, Inc.
11
12.
Preference Relationsdenotes strict preference;
x y means that bundle x is preferred
strictly to bundle y.
© 2010 W. W. Norton & Company, Inc.
12
13.
Preference Relationsdenotes strict preference;
x y means bundle x is preferred
strictly to bundle y.
~ denotes indifference; x ~ y means x
and y are equally preferred.
© 2010 W. W. Norton & Company, Inc.
13
14.
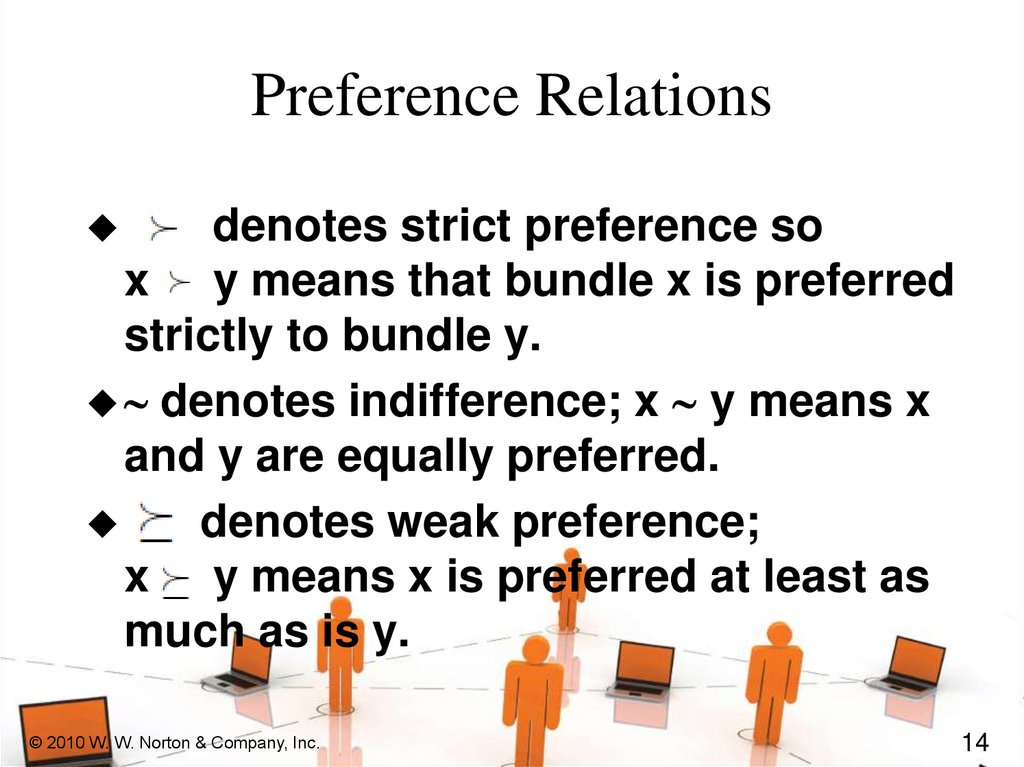
Preference Relationsdenotes strict preference so
x y means that bundle x is preferred
strictly to bundle y.
~ denotes indifference; x ~ y means x
and y are equally preferred.
denotes weak preference;
x y means x is preferred at least as
much as is y.
© 2010 W. W. Norton & Company, Inc.
14
15.
Preference Relationsx
y and y
© 2010 W. W. Norton & Company, Inc.
x imply x ~ y.
15
16.
Preference Relationsx imply x ~ y.
x
y and y
x
y and (not y
© 2010 W. W. Norton & Company, Inc.
x) imply x
y.
16
17.
Assumptions about PreferenceRelations
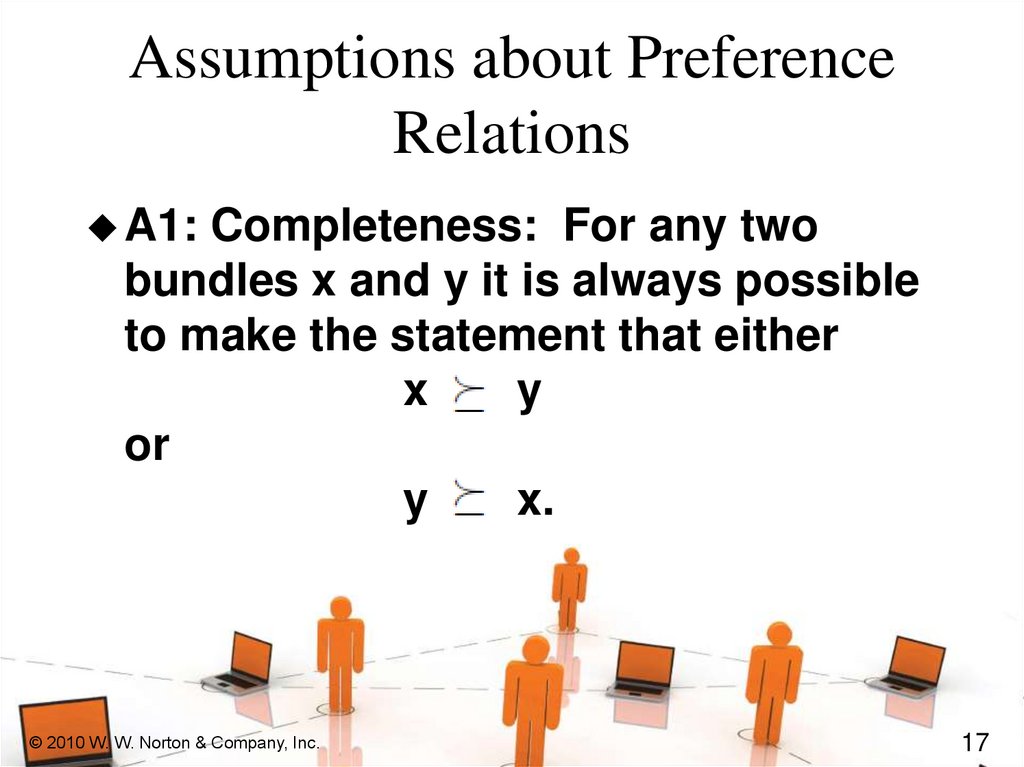
A1: Completeness:
For any two
bundles x and y it is always possible
to make the statement that either
x
y
or
y
x.
© 2010 W. W. Norton & Company, Inc.
17
18.
Assumptions about PreferenceRelations
A1’ :Reflexivity:
Any bundle x is
always at least as preferred as itself;
i.e.
x
© 2010 W. W. Norton & Company, Inc.
x.
18
19.
Assumptions about PreferenceRelations
A2: Transitivity:
If
x is at least as preferred as y, and
y is at least as preferred as z, then
x is at least as preferred as z; i.e.
x
y and y
© 2010 W. W. Norton & Company, Inc.
z
x
z.
19
20.
II.The preference relation© 2010 W. W. Norton & Company, Inc.
20
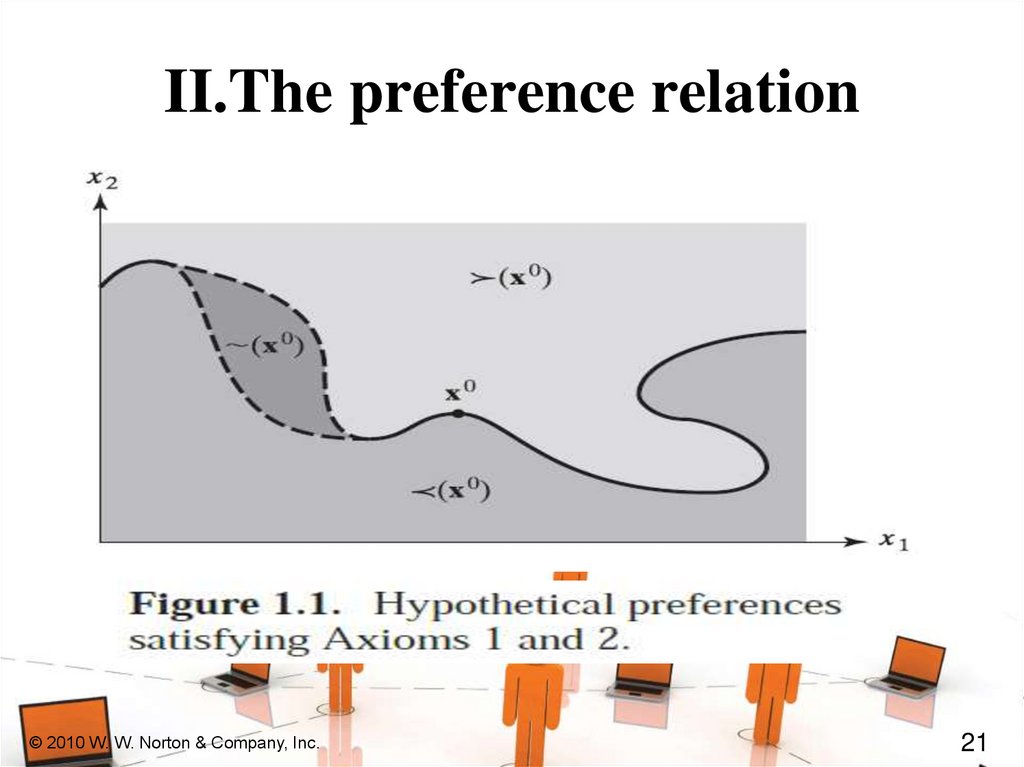
21.
II.The preference relation© 2010 W. W. Norton & Company, Inc.
21
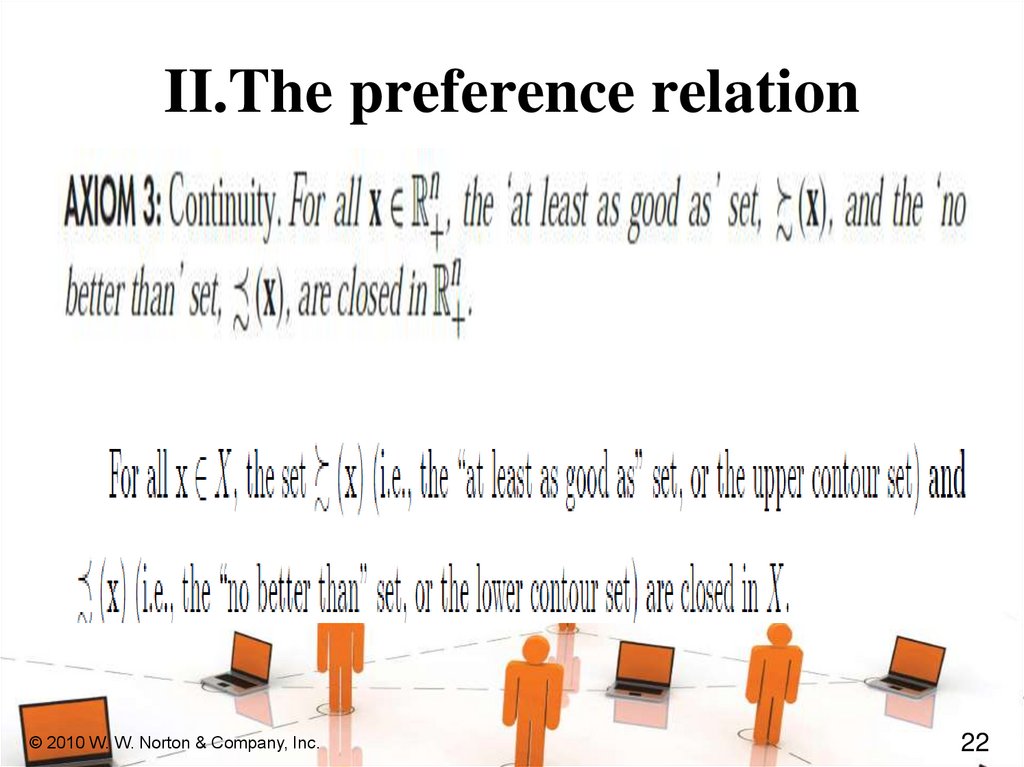
22.
II.The preference relation© 2010 W. W. Norton & Company, Inc.
22
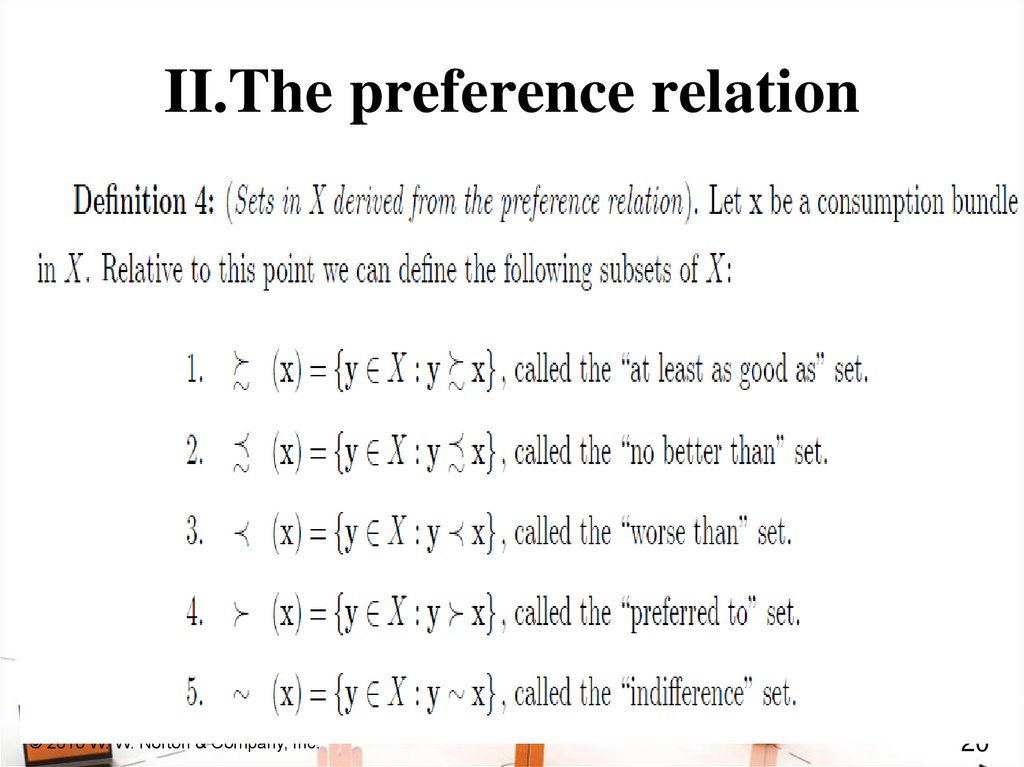
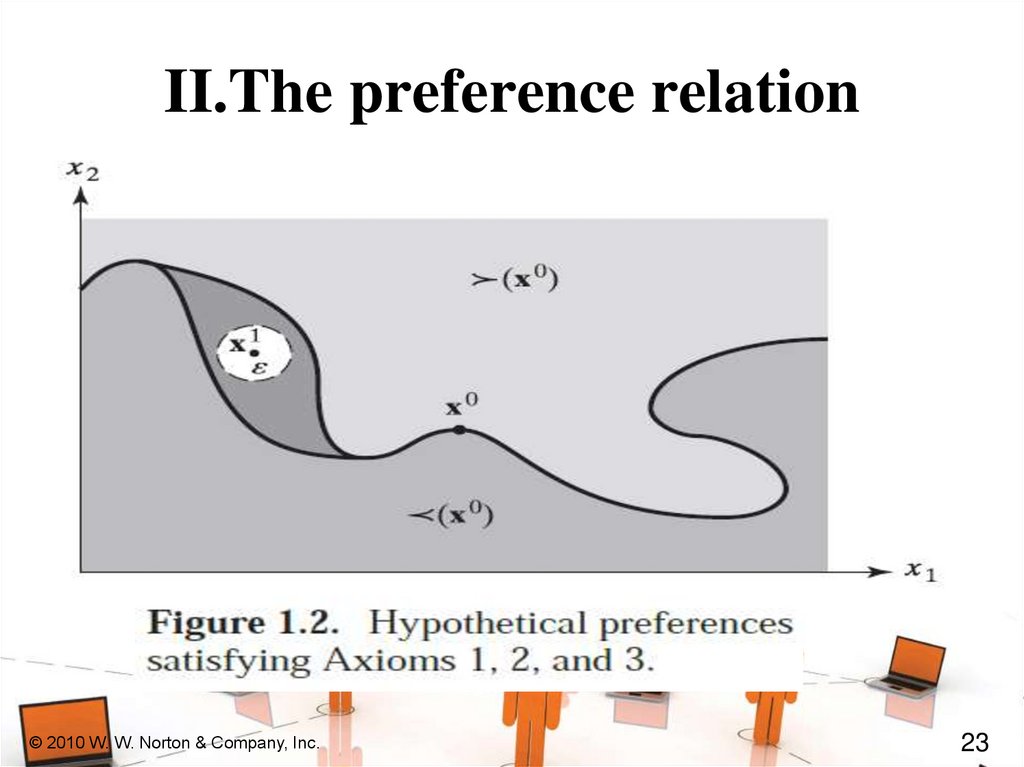
23.
II.The preference relation© 2010 W. W. Norton & Company, Inc.
23
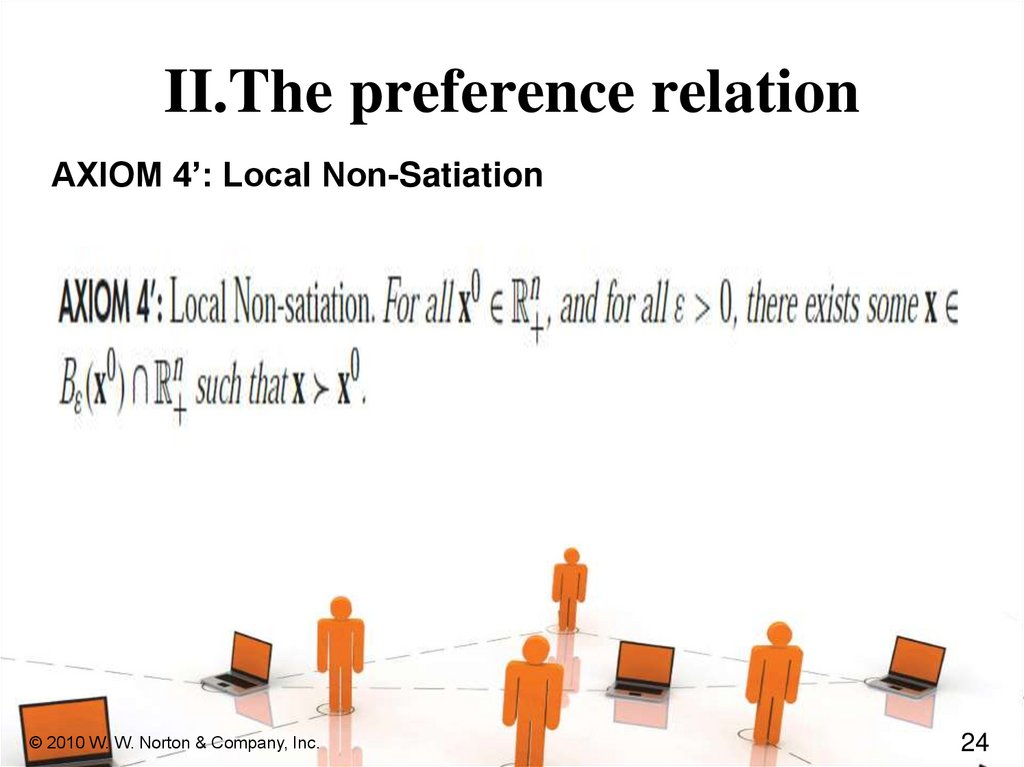
24.
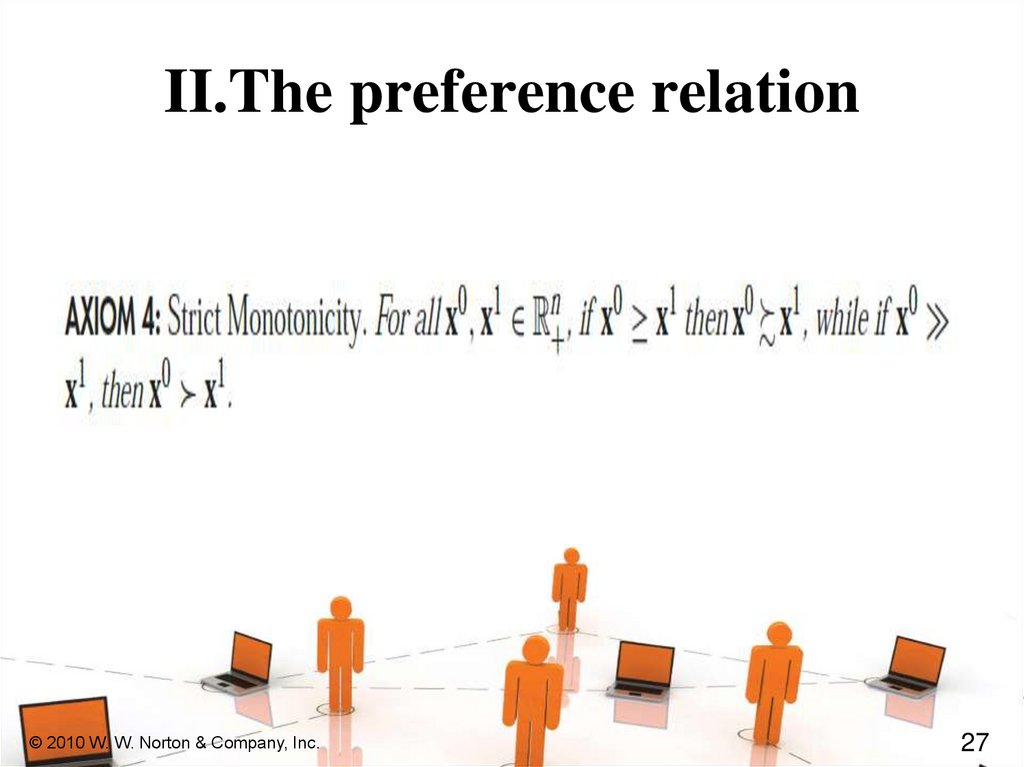
II.The preference relationAXIOM 4’: Local Non-Satiation
© 2010 W. W. Norton & Company, Inc.
24
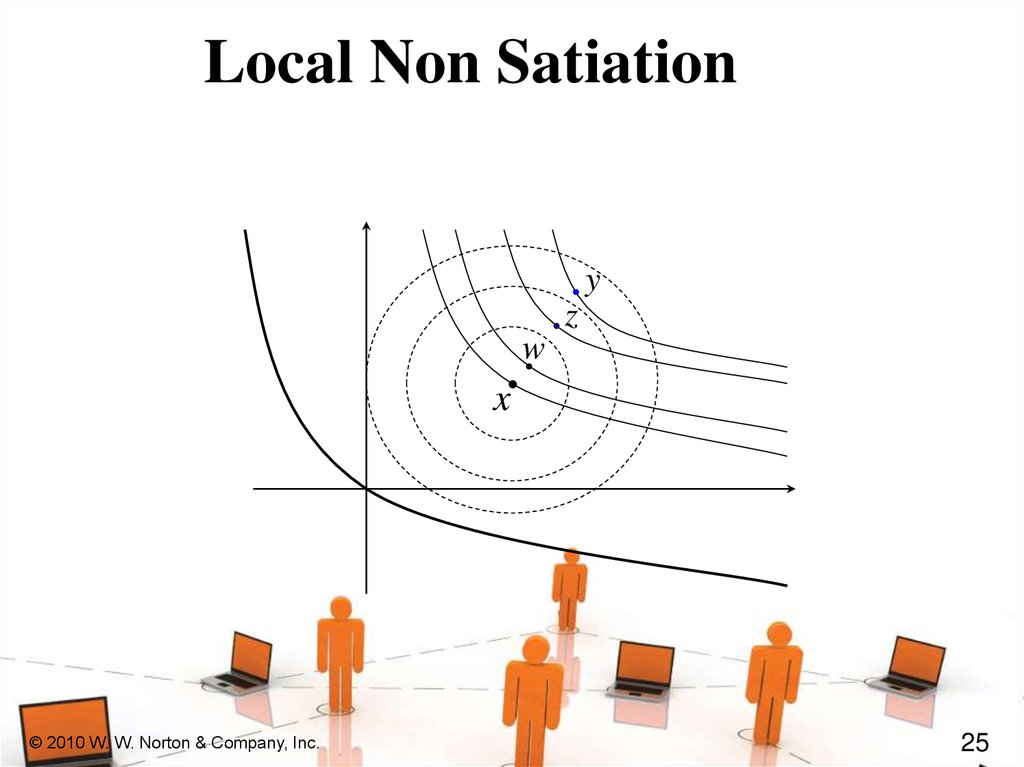
25.
Local Non Satiationy
z
w
x
© 2010 W. W. Norton & Company, Inc.
25
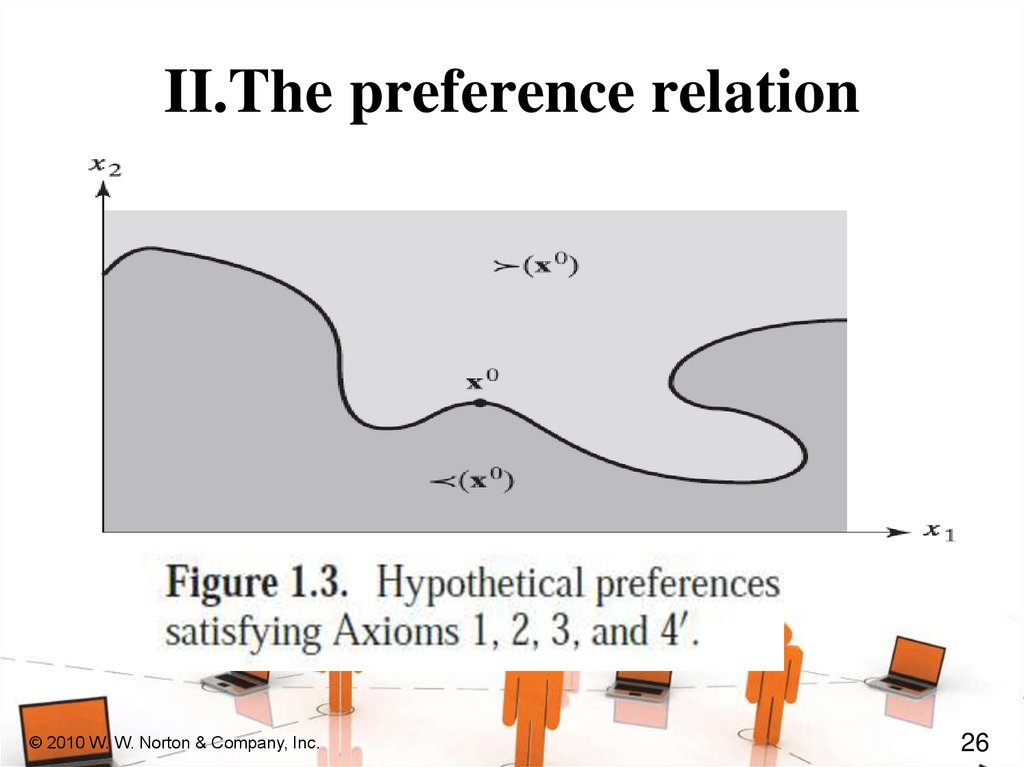
26.
II.The preference relation© 2010 W. W. Norton & Company, Inc.
26
27.
II.The preference relation© 2010 W. W. Norton & Company, Inc.
27
28.
II.The preference relation© 2010 W. W. Norton & Company, Inc.
28
29.
II.The preference relation© 2010 W. W. Norton & Company, Inc.
29
30.
II.The preference relation© 2010 W. W. Norton & Company, Inc.
30
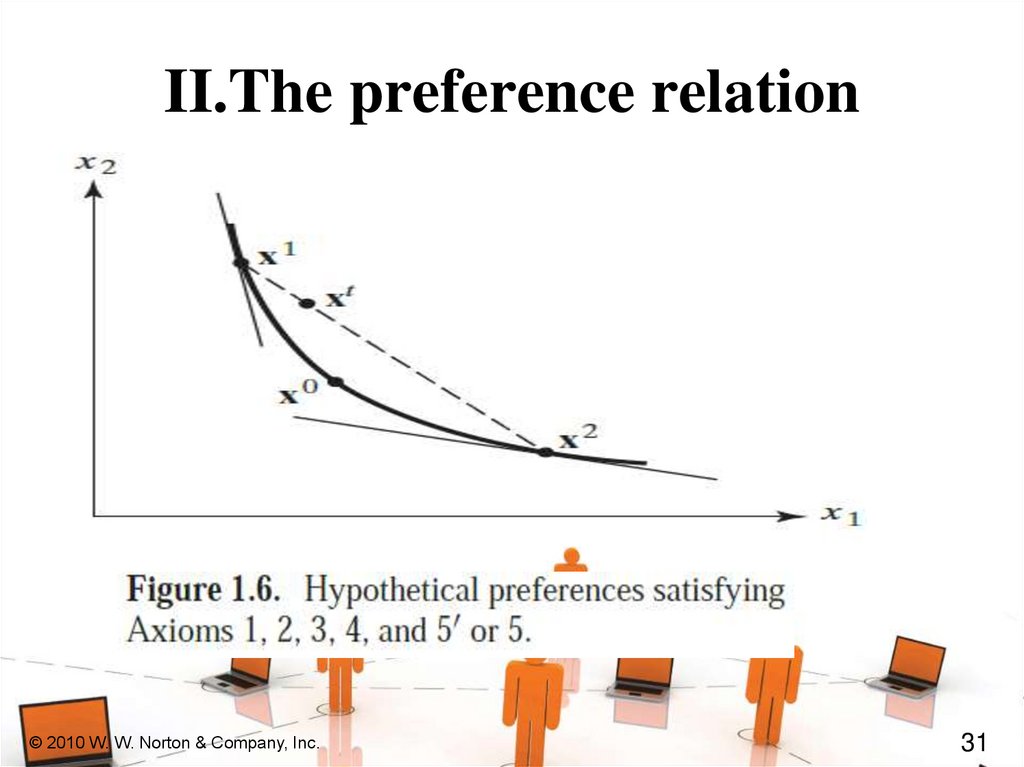
31.
II.The preference relation© 2010 W. W. Norton & Company, Inc.
31
32.
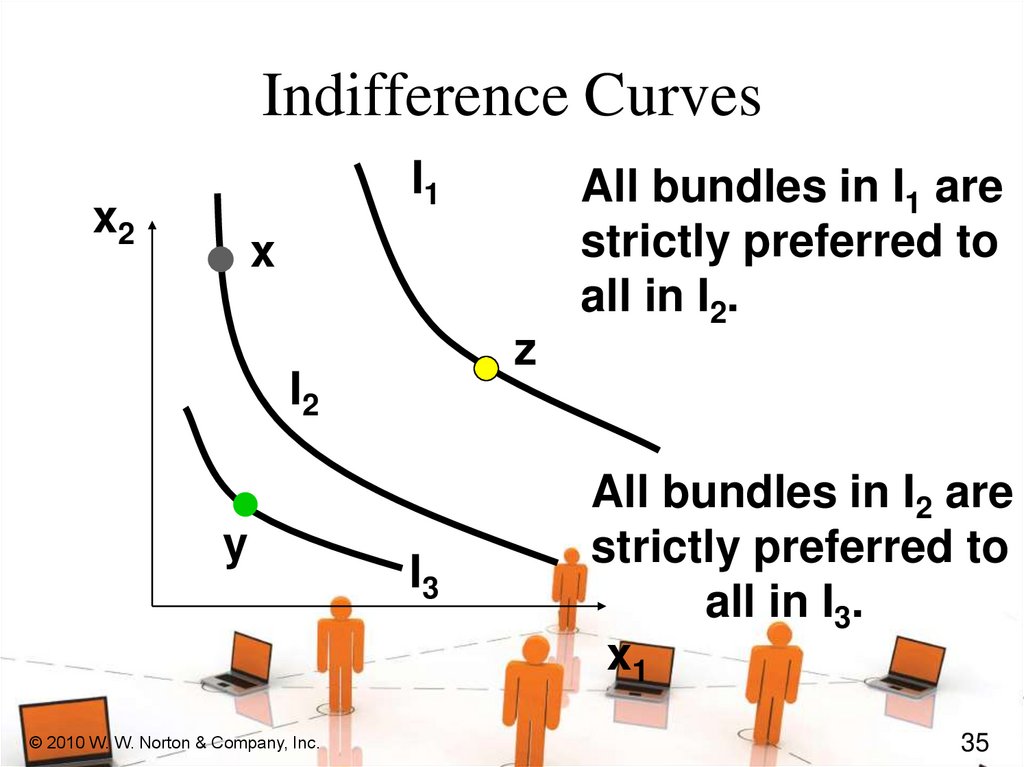
Indifference CurvesTake a reference bundle x’.
The set
of all bundles equally preferred to x’
is the indifference curve containing
x’; the set of all bundles y ~ x’.
Since an indifference “curve” is not
always a curve a better name might
be an indifference “set”.
© 2010 W. W. Norton & Company, Inc.
32
33.
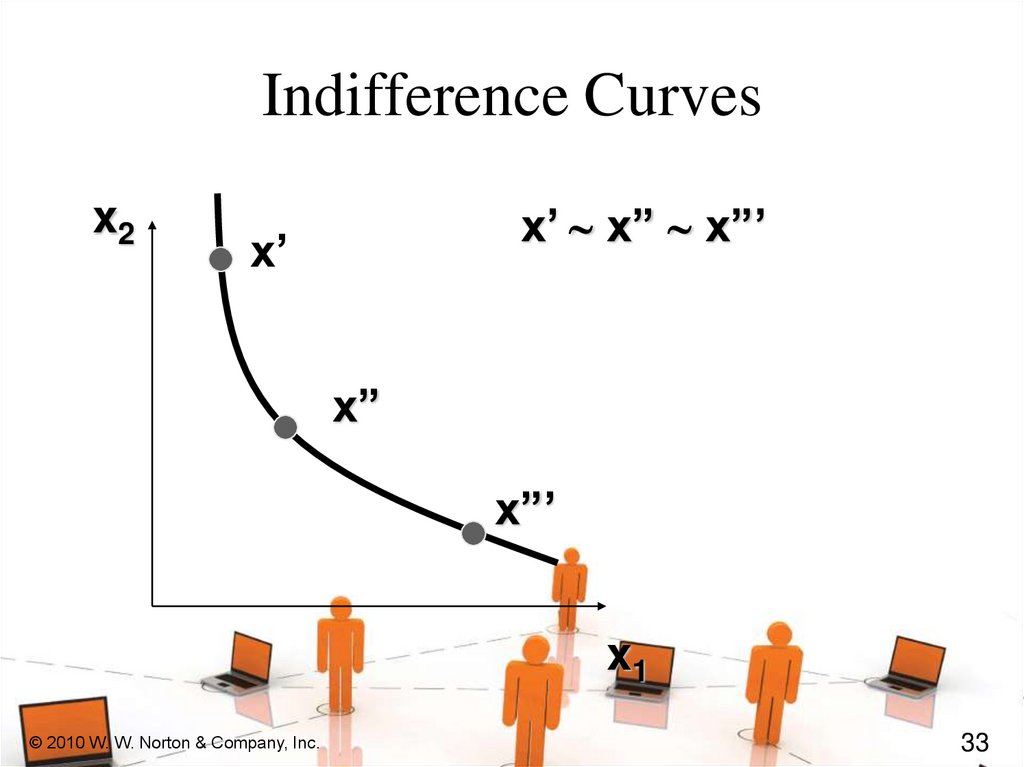
Indifference Curvesx2
x’ ~ x” ~ x”’
x’
x”
x”’
x1
© 2010 W. W. Norton & Company, Inc.
33
34.
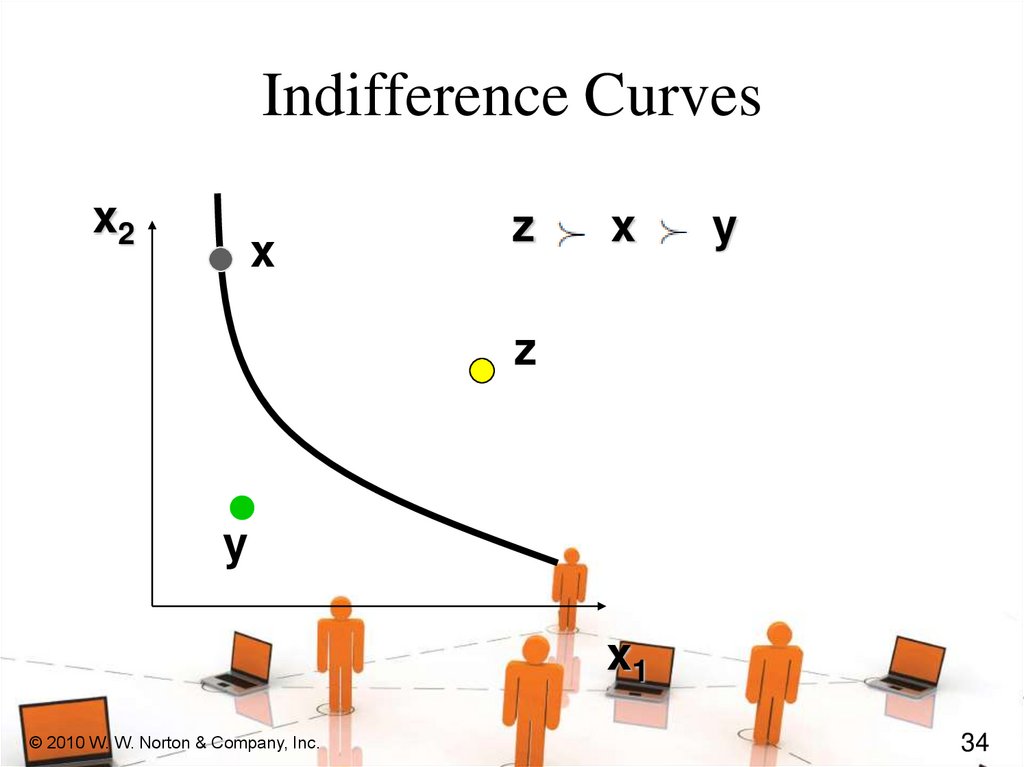
Indifference Curvesx2
x
z
x
y
z
y
x1
© 2010 W. W. Norton & Company, Inc.
34
35.
Indifference CurvesI1
x2
All bundles in I1 are
strictly preferred to
all in I2.
x
z
I2
y
© 2010 W. W. Norton & Company, Inc.
I3
All bundles in I2 are
strictly preferred to
all in I3.
x1
35
36.
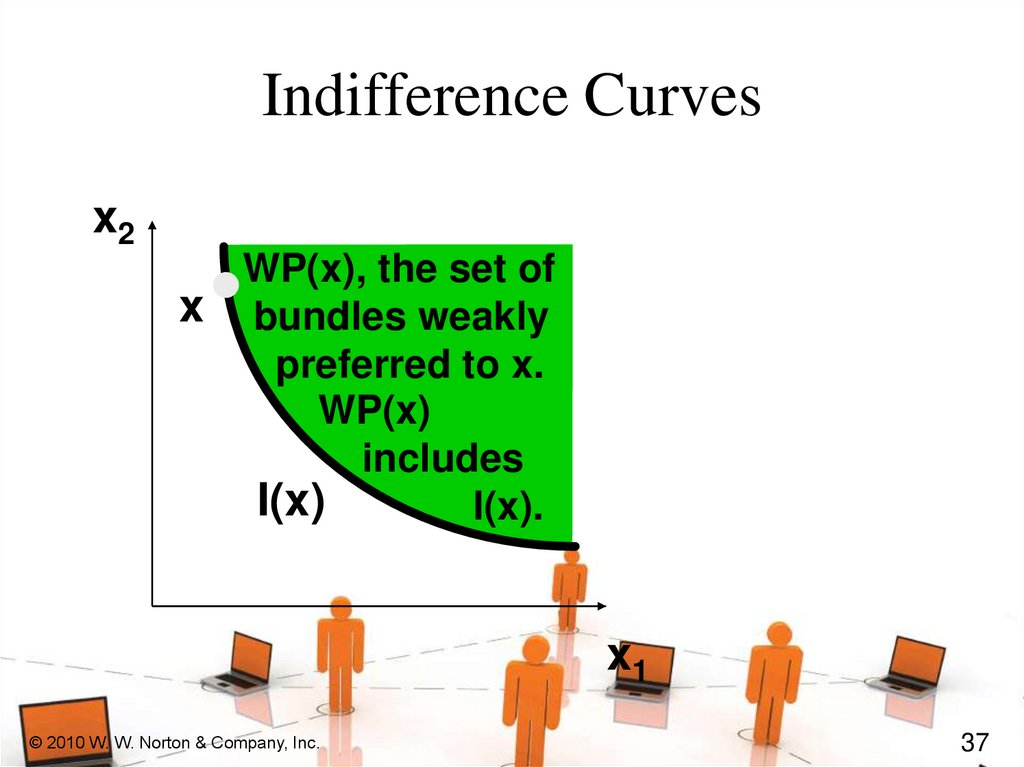
Indifference Curvesx2
WP(x), the set of
x bundles weakly
preferred to x.
I(x)
I(x’)
x1
© 2010 W. W. Norton & Company, Inc.
36
37.
Indifference Curvesx2
WP(x), the set of
x bundles weakly
preferred to x.
WP(x)
includes
I(x)
I(x).
x1
© 2010 W. W. Norton & Company, Inc.
37
38.
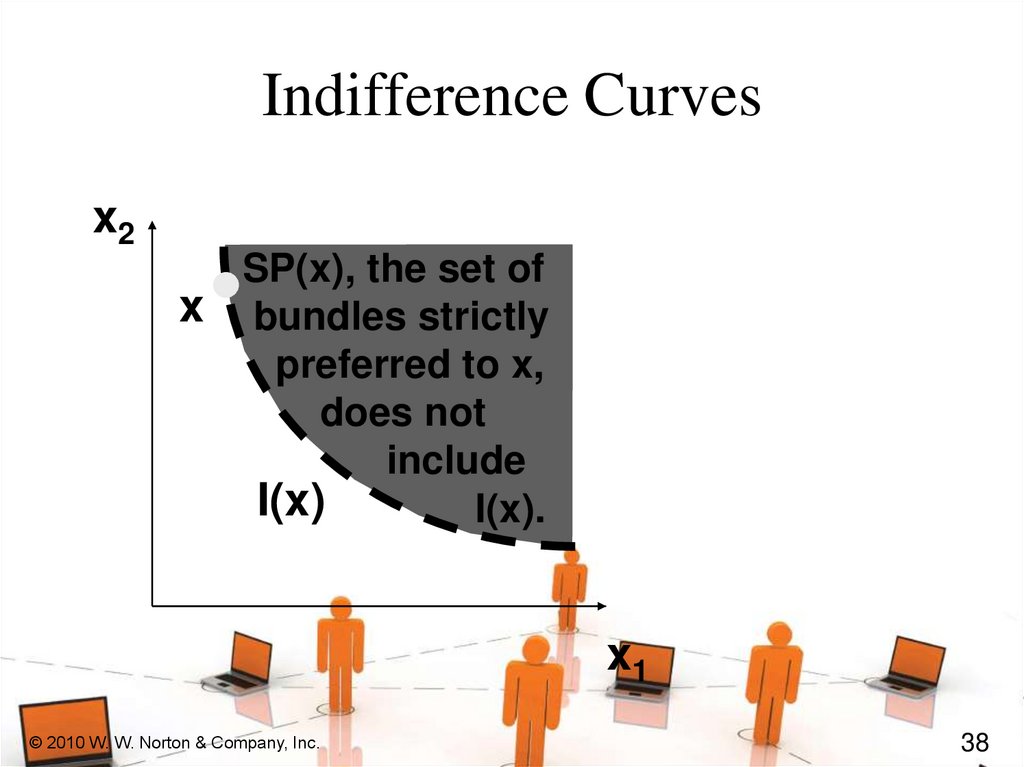
Indifference Curvesx2
SP(x), the set of
x bundles strictly
preferred to x,
does not
include
I(x)
I(x).
x1
© 2010 W. W. Norton & Company, Inc.
38
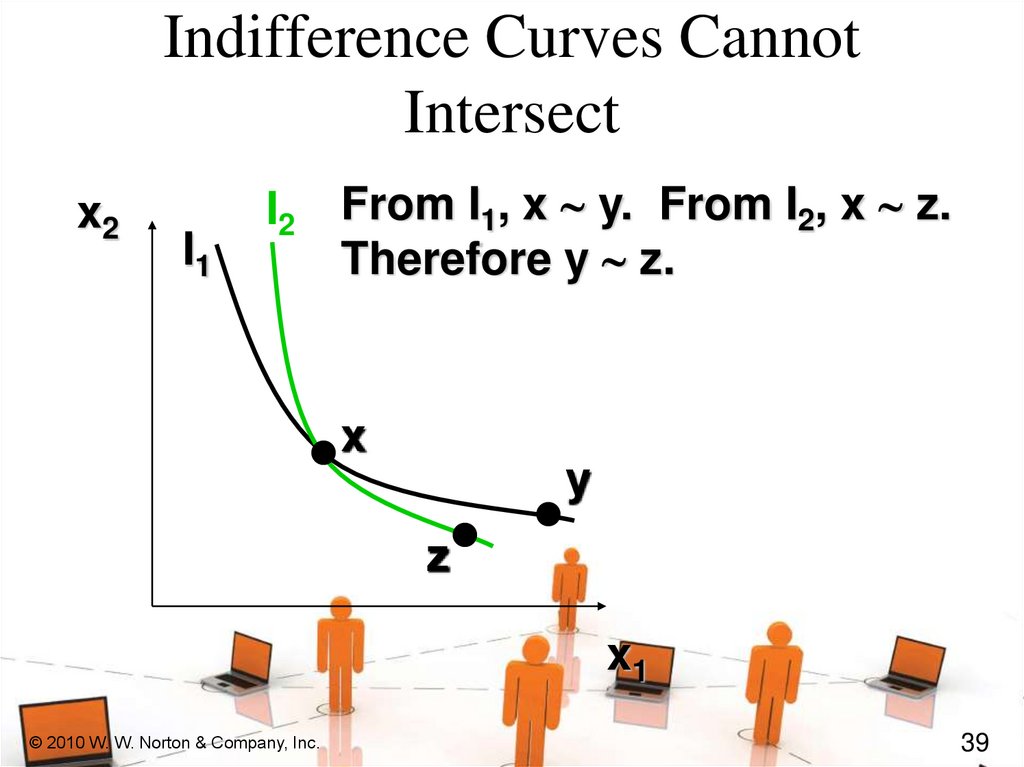
39.
Indifference Curves CannotIntersect
x2
I1
I2 From I1, x ~ y. From I2, x ~ z.
Therefore y ~ z.
x
y
z
x1
© 2010 W. W. Norton & Company, Inc.
39
40.
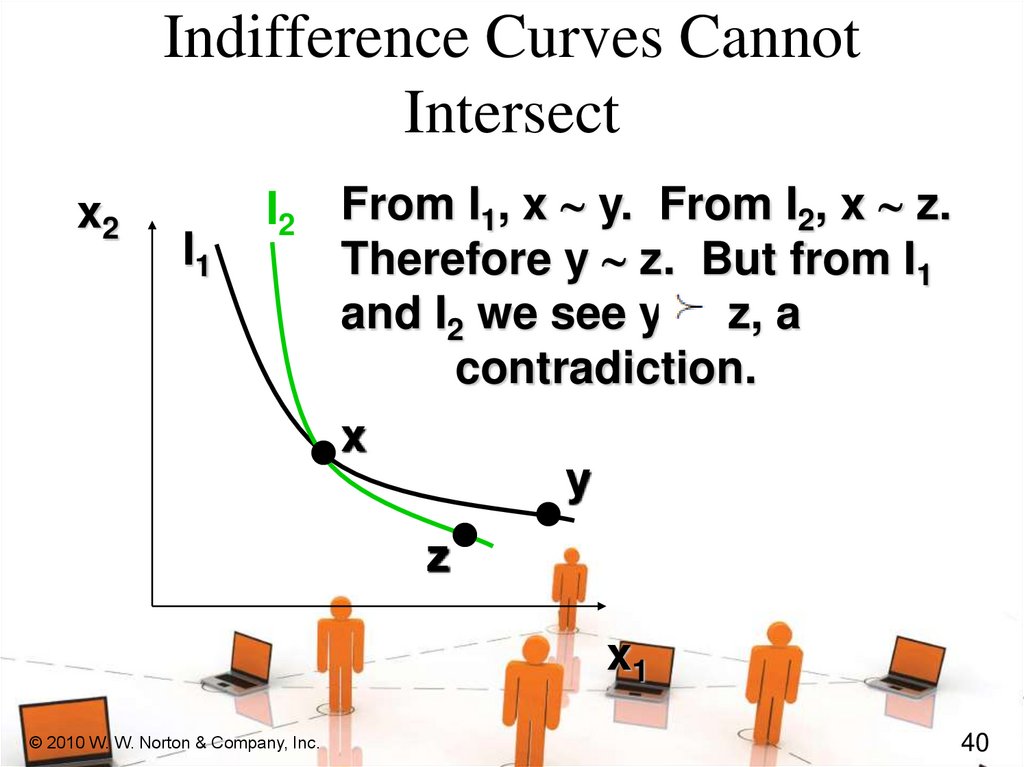
Indifference Curves CannotIntersect
x2
I1
I2 From I1, x ~ y. From I2, x ~ z.
Therefore y ~ z. But from I1
and I2 we see y z, a
contradiction.
x
y
z
x1
© 2010 W. W. Norton & Company, Inc.
40
41.
Slopes of Indifference CurvesWhen more of a commodity is always
preferred, the commodity is a good.
If every commodity is a good then
indifference curves are negatively
sloped.
© 2010 W. W. Norton & Company, Inc.
41
42.
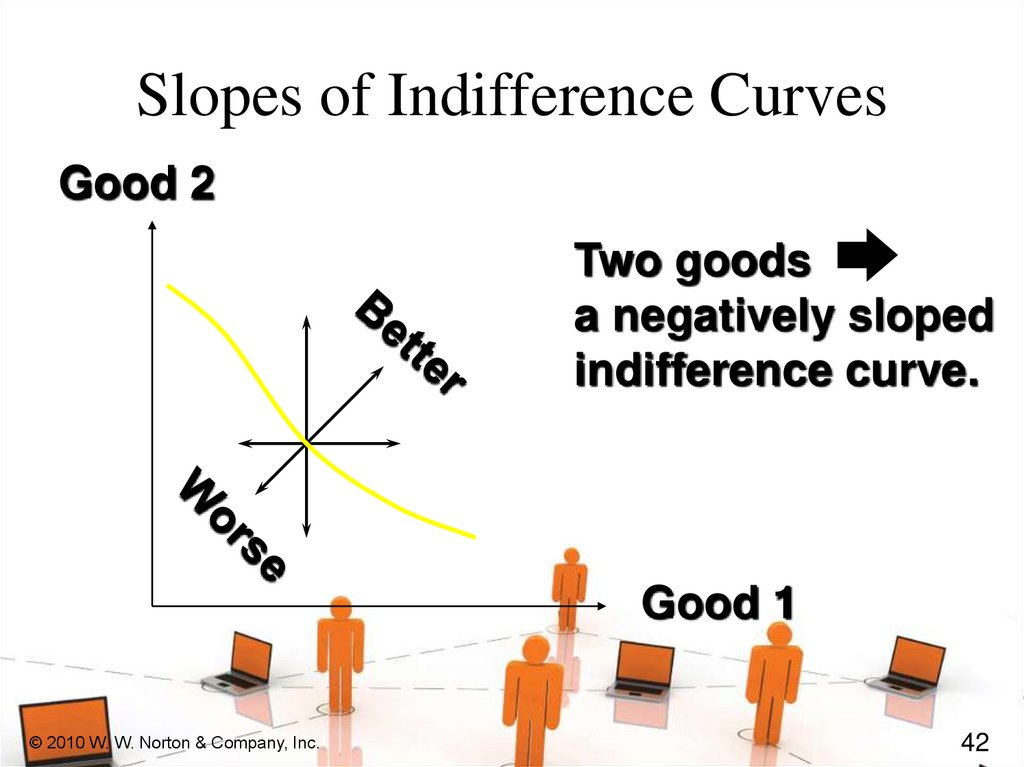
Slopes of Indifference CurvesGood 2
Two goods
a negatively sloped
indifference curve.
Good 1
© 2010 W. W. Norton & Company, Inc.
42
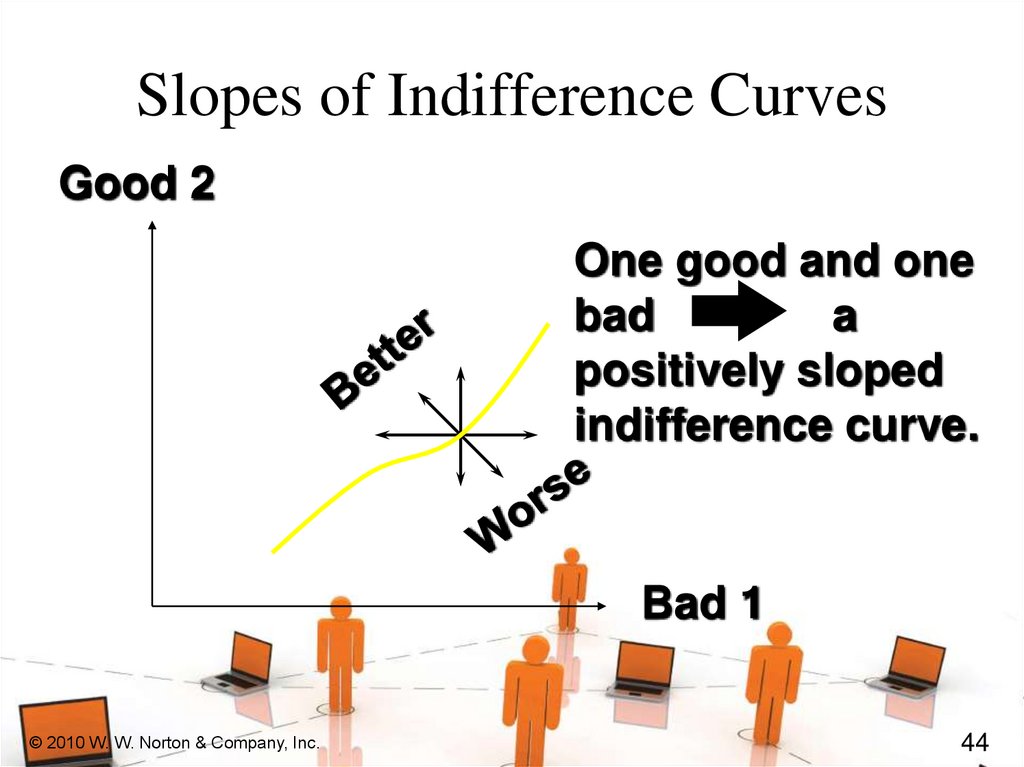
43.
Slopes of Indifference CurvesIf less of a commodity is always
preferred then the commodity is a
bad.
© 2010 W. W. Norton & Company, Inc.
43
44.
Slopes of Indifference CurvesGood 2
One good and one
bad
a
positively sloped
indifference curve.
Bad 1
© 2010 W. W. Norton & Company, Inc.
44
45.
Extreme Cases of IndifferenceCurves
Perfect substitutes
Perfect complements
Satiation
Discrete goods
© 2010 W. W. Norton & Company, Inc.
45
46.
Extreme Cases of IndifferenceCurves; Perfect Substitutes
If a consumer always regards units
of commodities 1 and 2 as equivalent,
then the commodities are perfect
substitutes and only the total amount
of the two commodities in bundles
determines their preference rankorder.
© 2010 W. W. Norton & Company, Inc.
46
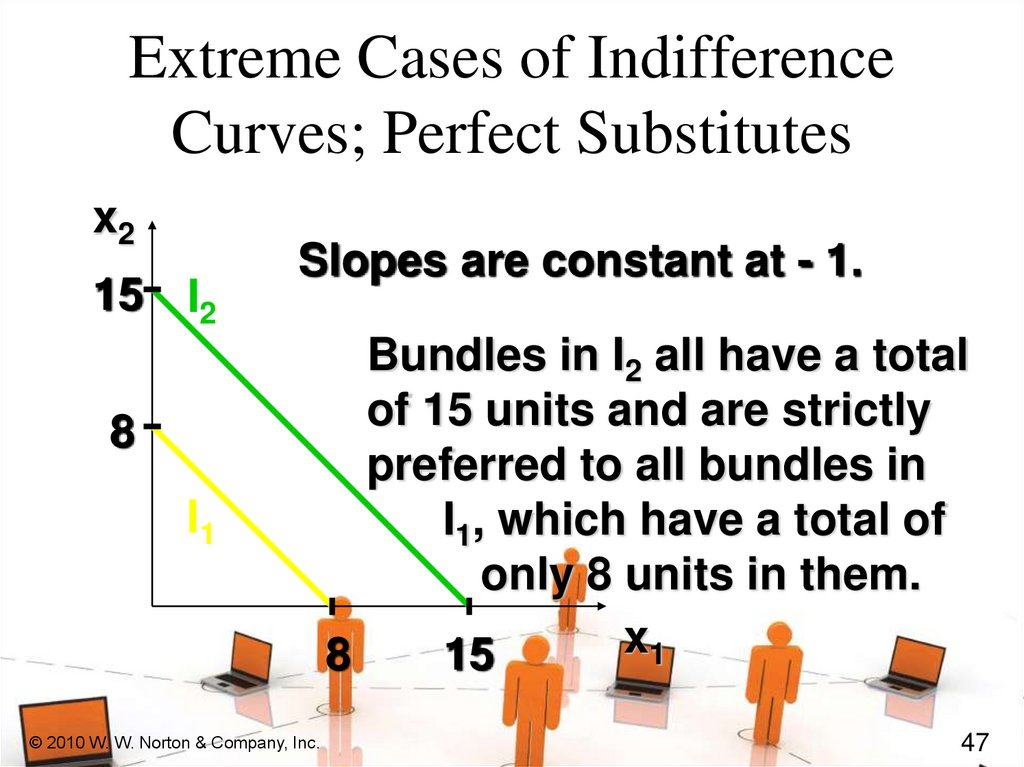
47.
Extreme Cases of IndifferenceCurves; Perfect Substitutes
x2
15 I2
Slopes are constant at - 1.
8
I1
© 2010 W. W. Norton & Company, Inc.
Bundles in I2 all have a total
of 15 units and are strictly
preferred to all bundles in
I1, which have a total of
only 8 units in them.
x1
8
15
47
48.
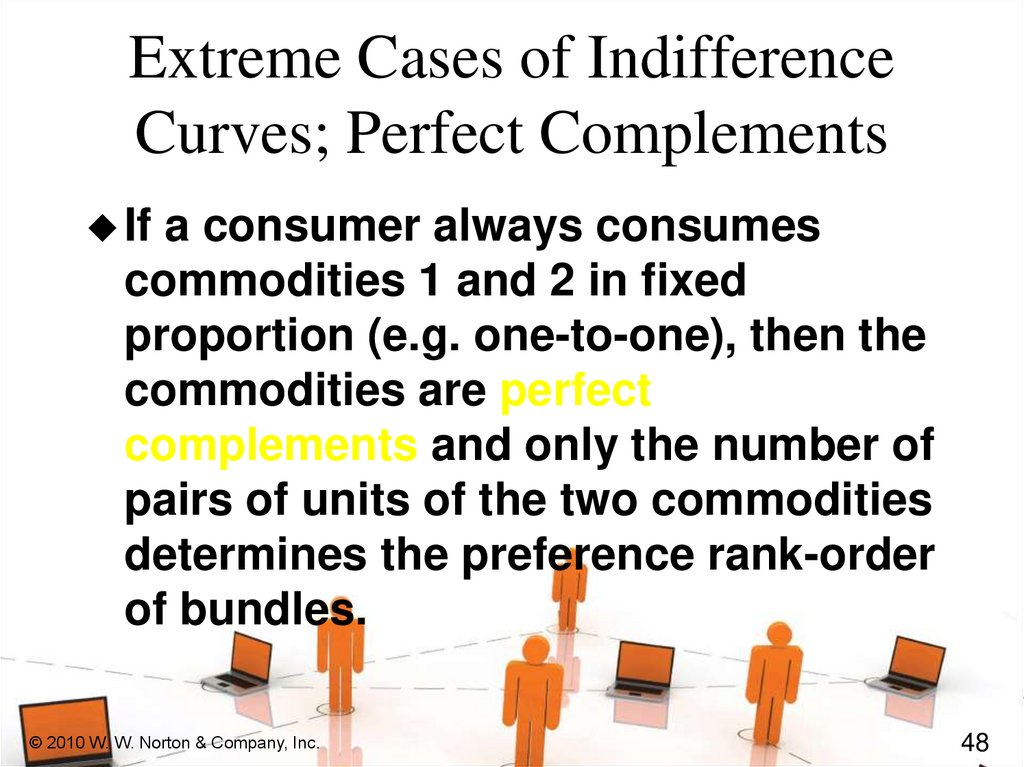
Extreme Cases of IndifferenceCurves; Perfect Complements
If a consumer always consumes
commodities 1 and 2 in fixed
proportion (e.g. one-to-one), then the
commodities are perfect
complements and only the number of
pairs of units of the two commodities
determines the preference rank-order
of bundles.
© 2010 W. W. Norton & Company, Inc.
48
49.
Extreme Cases of IndifferenceCurves; Perfect Complements
SAMLA box, pink
¥ 5.90
© 2010 W. W. Norton & Company, Inc.
SAMLA box cover, pink
¥ 4.00
49
50.
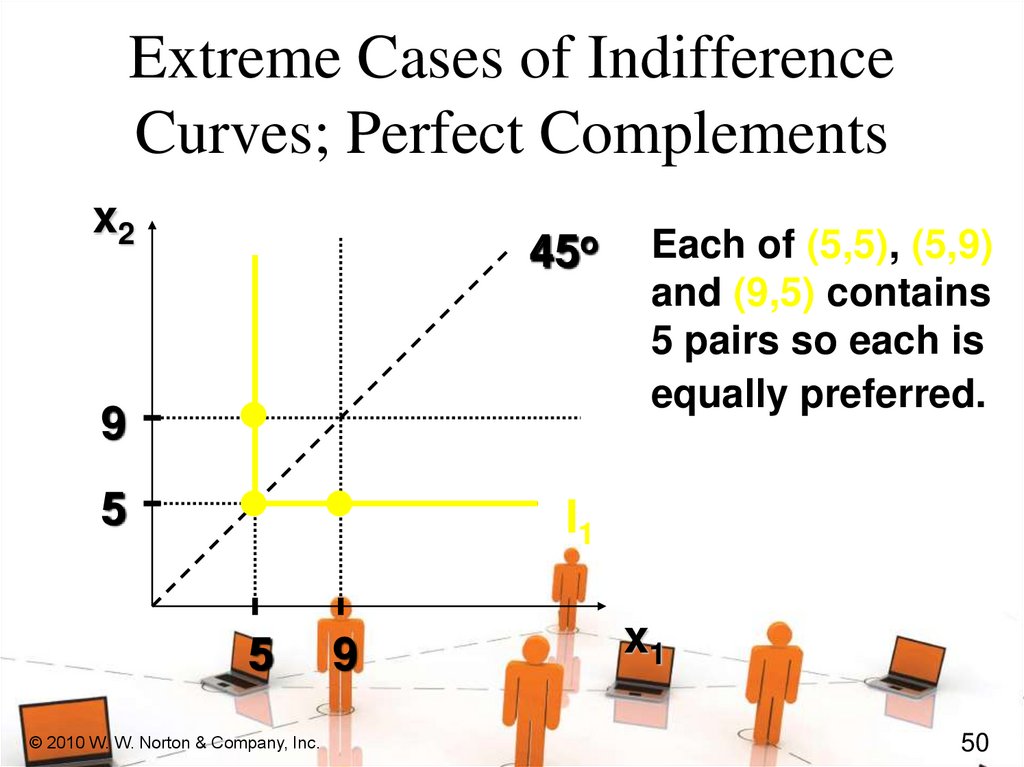
Extreme Cases of IndifferenceCurves; Perfect Complements
x2
45o
9
5
Each of (5,5), (5,9)
and (9,5) contains
5 pairs so each is
equally preferred.
I1
5
© 2010 W. W. Norton & Company, Inc.
9
x1
50
51.
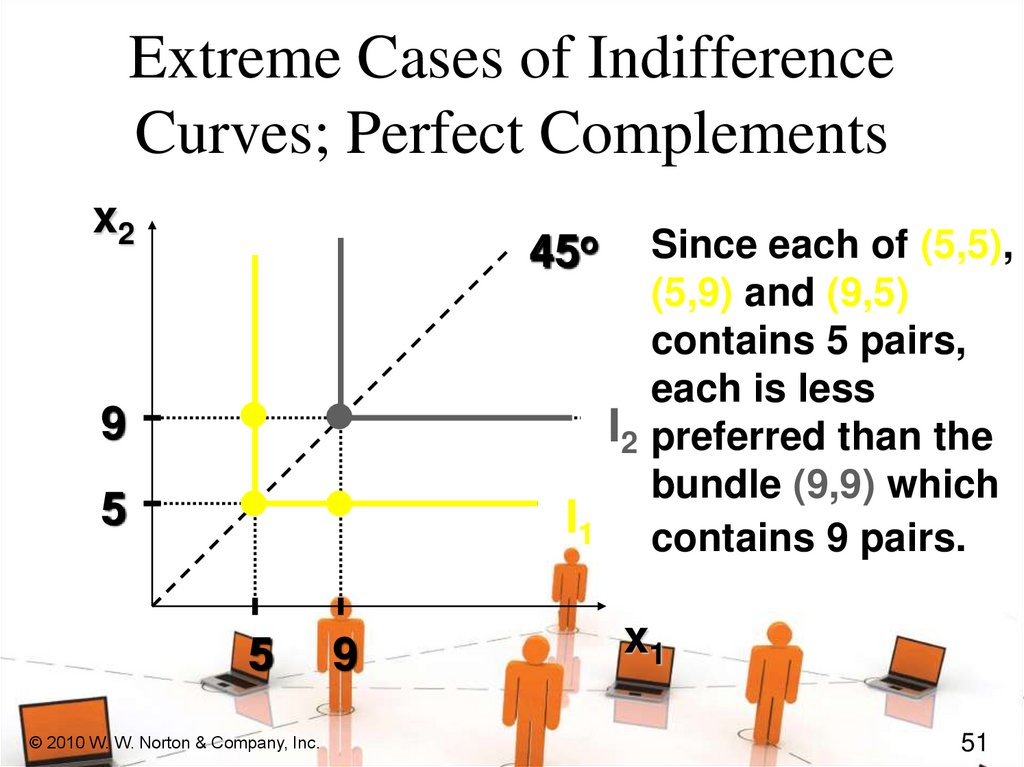
Extreme Cases of IndifferenceCurves; Perfect Complements
x2
Since each of (5,5),
(5,9) and (9,5)
contains 5 pairs,
each is less
I2 preferred than the
bundle (9,9) which
I1 contains 9 pairs.
45o
9
5
5
© 2010 W. W. Norton & Company, Inc.
9
x1
51
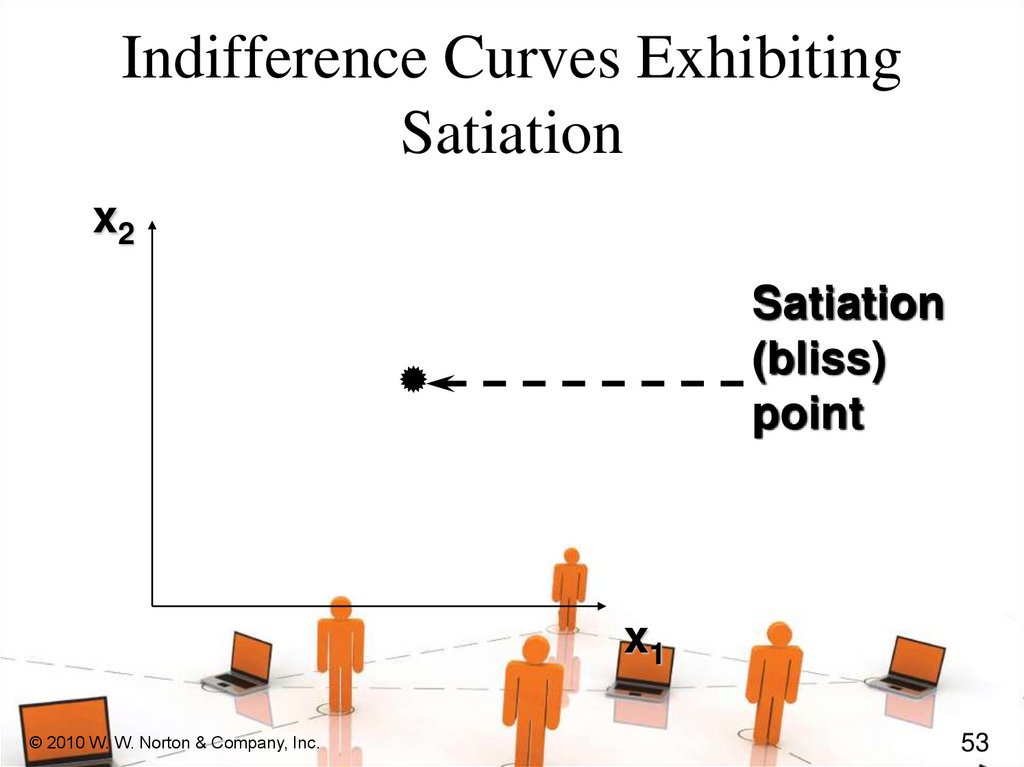
52.
Preferences Exhibiting SatiationA bundle strictly preferred to any
other is a satiation point or a bliss
point.
What do indifference curves look like
for preferences exhibiting satiation?
© 2010 W. W. Norton & Company, Inc.
52
53.
Indifference Curves ExhibitingSatiation
x2
Satiation
(bliss)
point
x1
© 2010 W. W. Norton & Company, Inc.
53
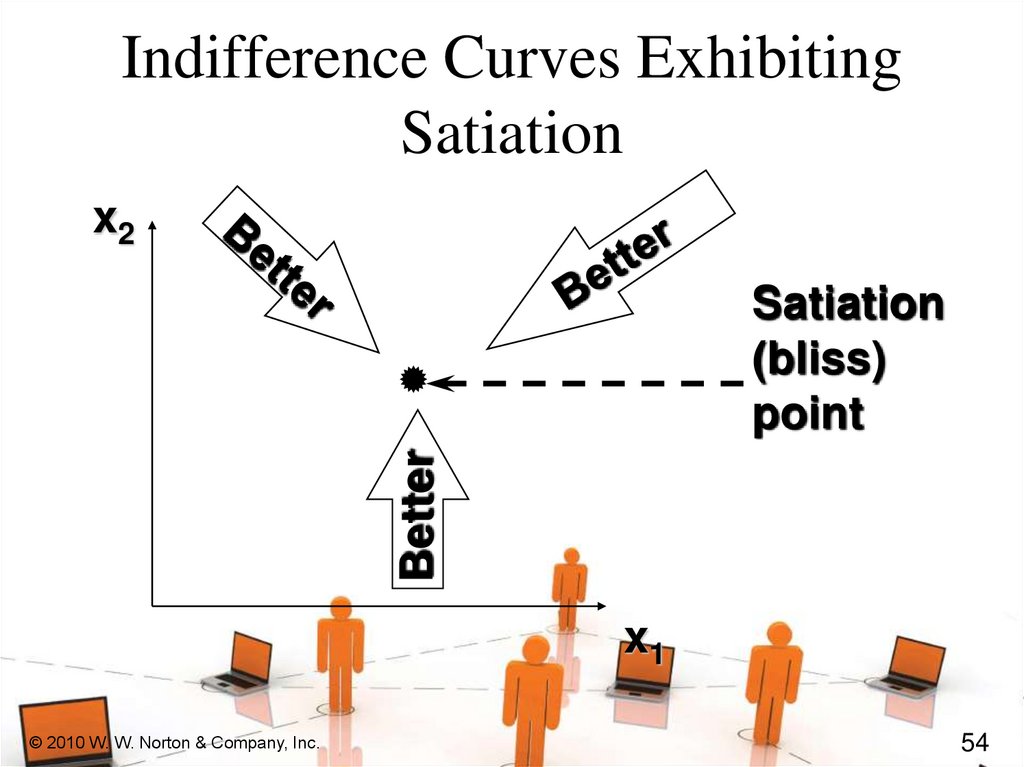
54.
Indifference Curves ExhibitingSatiation
x2
Better
Satiation
(bliss)
point
x1
© 2010 W. W. Norton & Company, Inc.
54
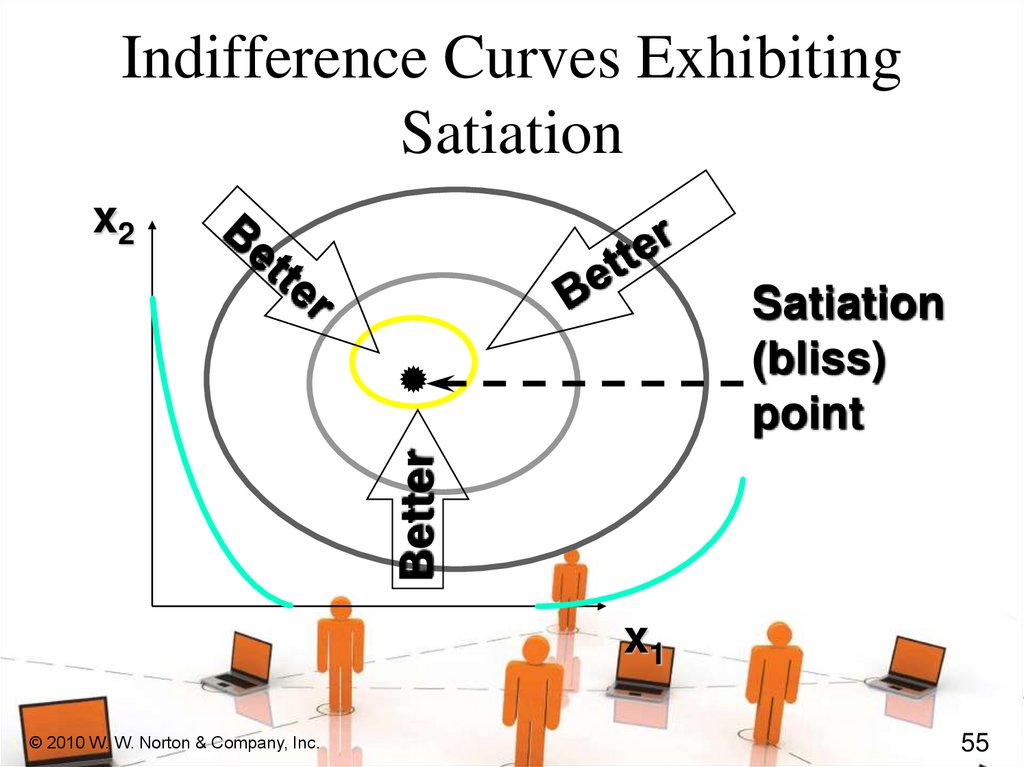
55.
Indifference Curves ExhibitingSatiation
x2
Better
Satiation
(bliss)
point
x1
© 2010 W. W. Norton & Company, Inc.
55
56.
Indifference Curves for DiscreteCommodities
A commodity is infinitely divisible if
it can be acquired in any quantity;
e.g. water or cheese.
A commodity is discrete if it comes
in unit lumps of 1, 2, 3, … and so on;
e.g. aircraft, ships and refrigerators.
© 2010 W. W. Norton & Company, Inc.
56
57.
Indifference Curves for DiscreteCommodities
Suppose commodity 2 is an infinitely
divisible good (gasoline) while
commodity 1 is a discrete good
(aircraft). What do indifference
“curves” look like?
© 2010 W. W. Norton & Company, Inc.
57
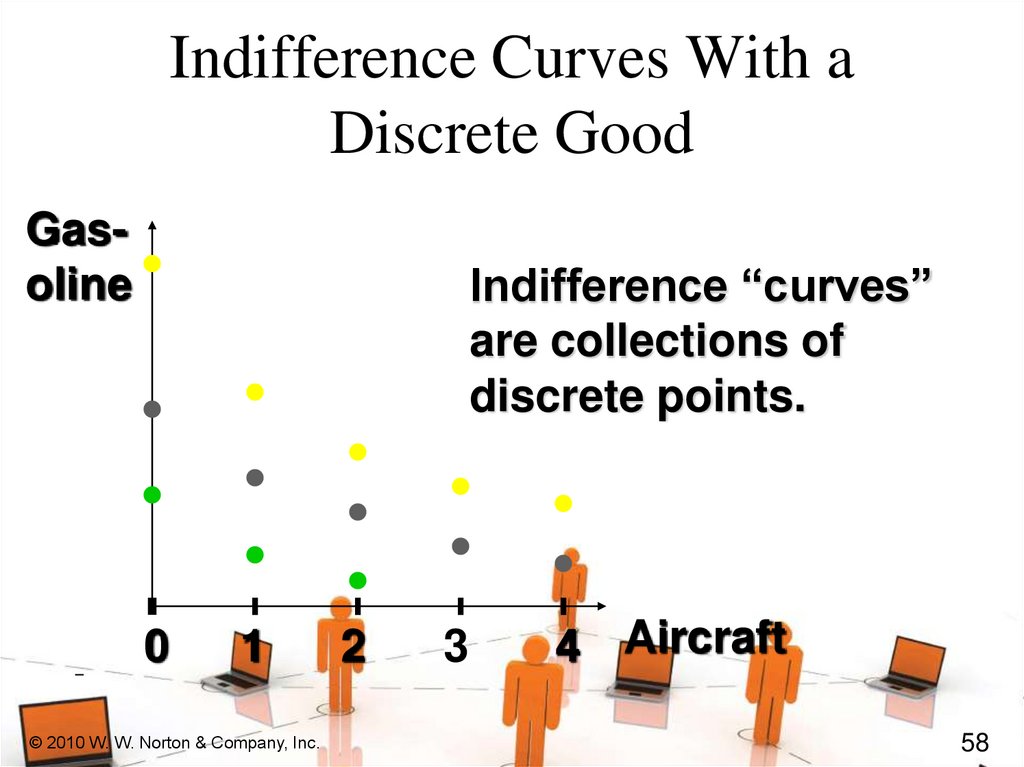
58.
Indifference Curves With aDiscrete Good
Gasoline
Indifference “curves”
are collections of
discrete points.
0
1
© 2010 W. W. Norton & Company, Inc.
2
3
4 Aircraft
58
59.
Well-Behaved PreferencesA preference relation is “well-
behaved” if it is
– monotonic and convex.
Monotonicity: More of any
commodity is always preferred (i.e.
no satiation and every commodity is
a good).
© 2010 W. W. Norton & Company, Inc.
59
60.
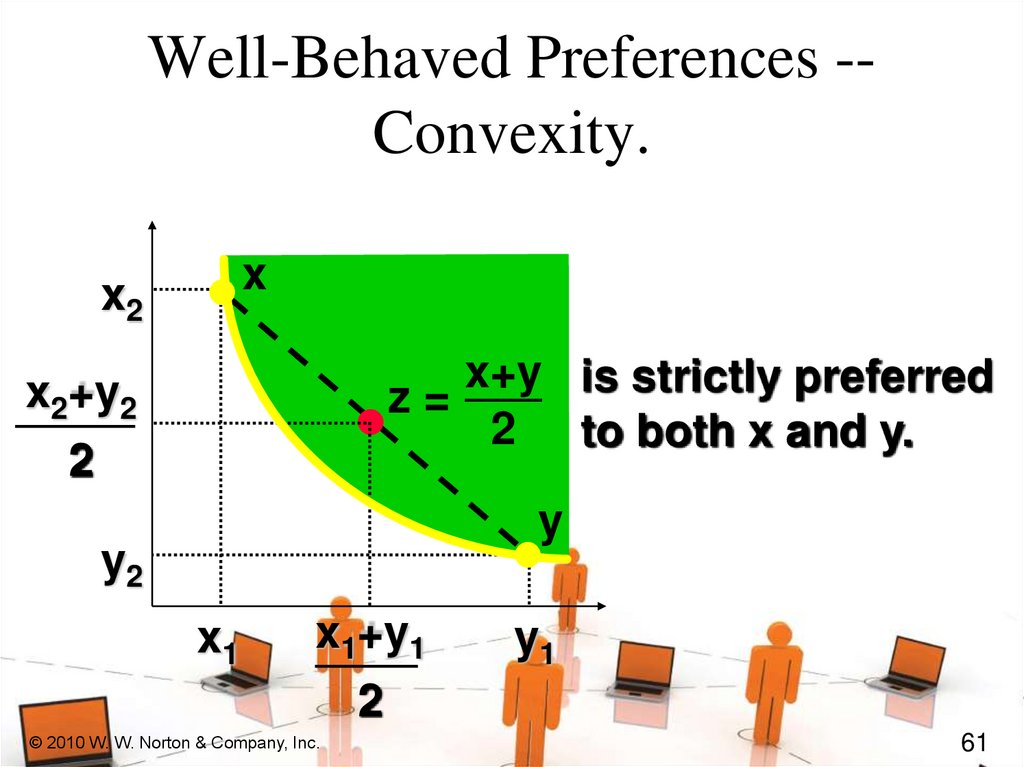
Well-Behaved PreferencesConvexity: Mixtures of bundles are
(at least weakly) preferred to the
bundles themselves. E.g., the 50-50
mixture of the bundles x and y is
z = (0.5)x + (0.5)y.
z is at least as preferred as x or y.
© 2010 W. W. Norton & Company, Inc.
60
61.
Well-Behaved Preferences -Convexity.x
x2
x+y is strictly preferred
z=
2 to both x and y.
x2+y2
2
y
y2
x1
x1+y1
2
© 2010 W. W. Norton & Company, Inc.
y1
61
62.
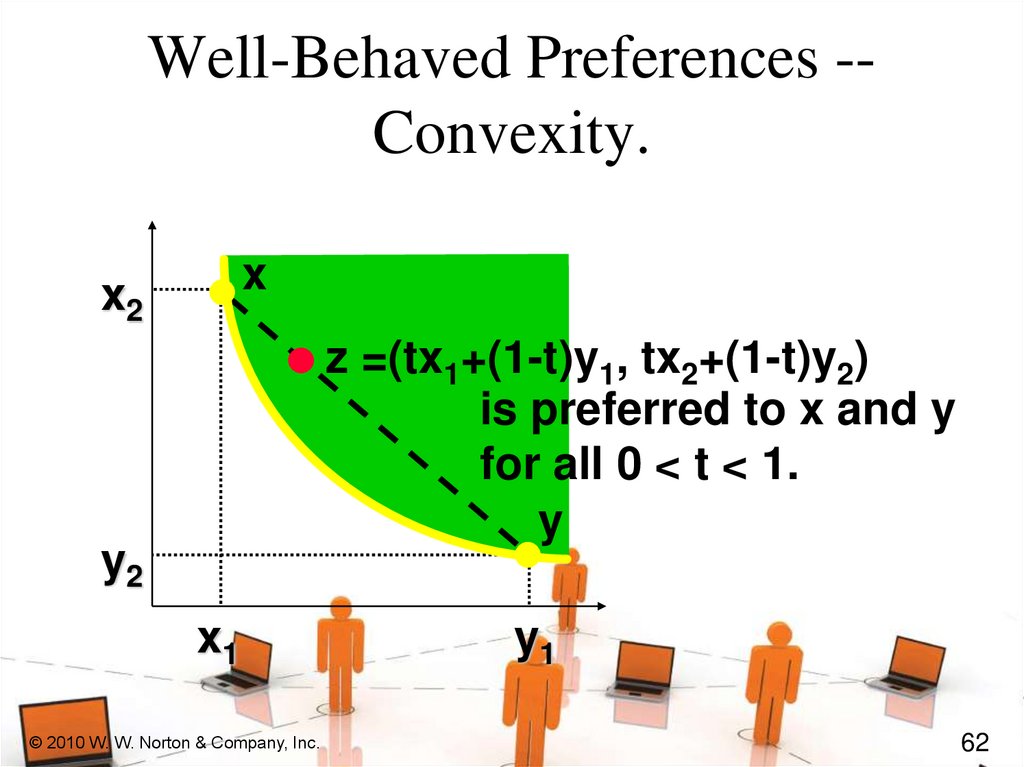
Well-Behaved Preferences -Convexity.x
x2
z =(tx1+(1-t)y1, tx2+(1-t)y2)
is preferred to x and y
for all 0 < t < 1.
y
y2
x1
© 2010 W. W. Norton & Company, Inc.
y1
62
63.
Well-Behaved Preferences -Convexity.x
x2
y2
x1
© 2010 W. W. Norton & Company, Inc.
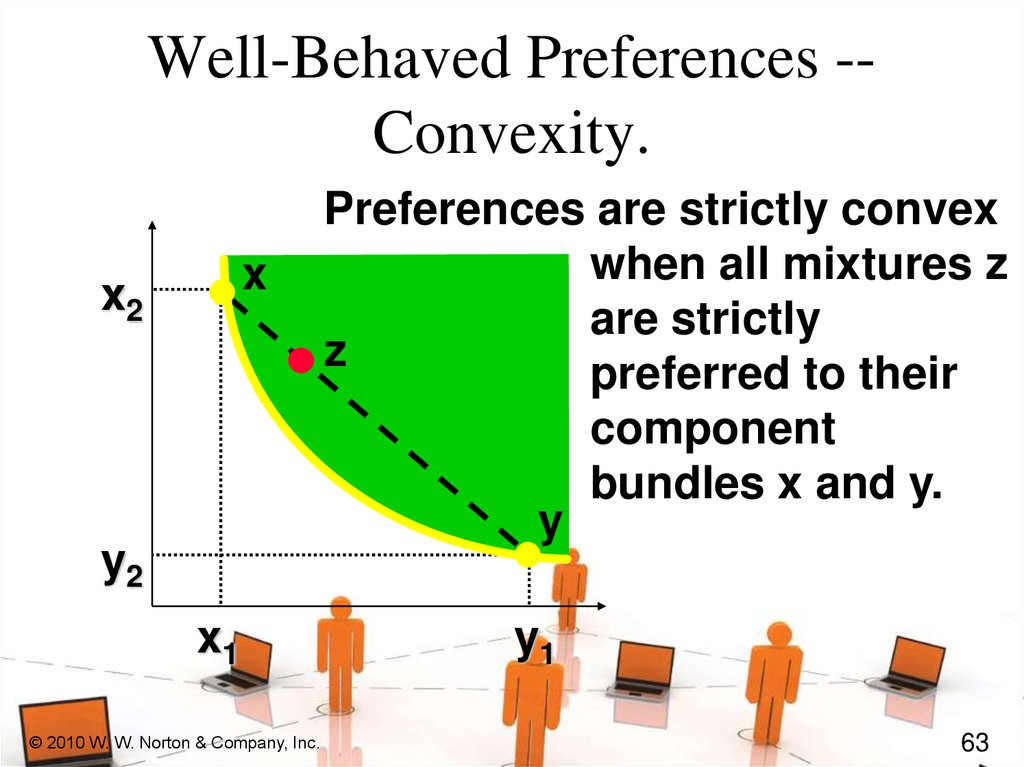
Preferences are strictly convex
when all mixtures z
are strictly
z
preferred to their
component
bundles x and y.
y
y1
63
64.
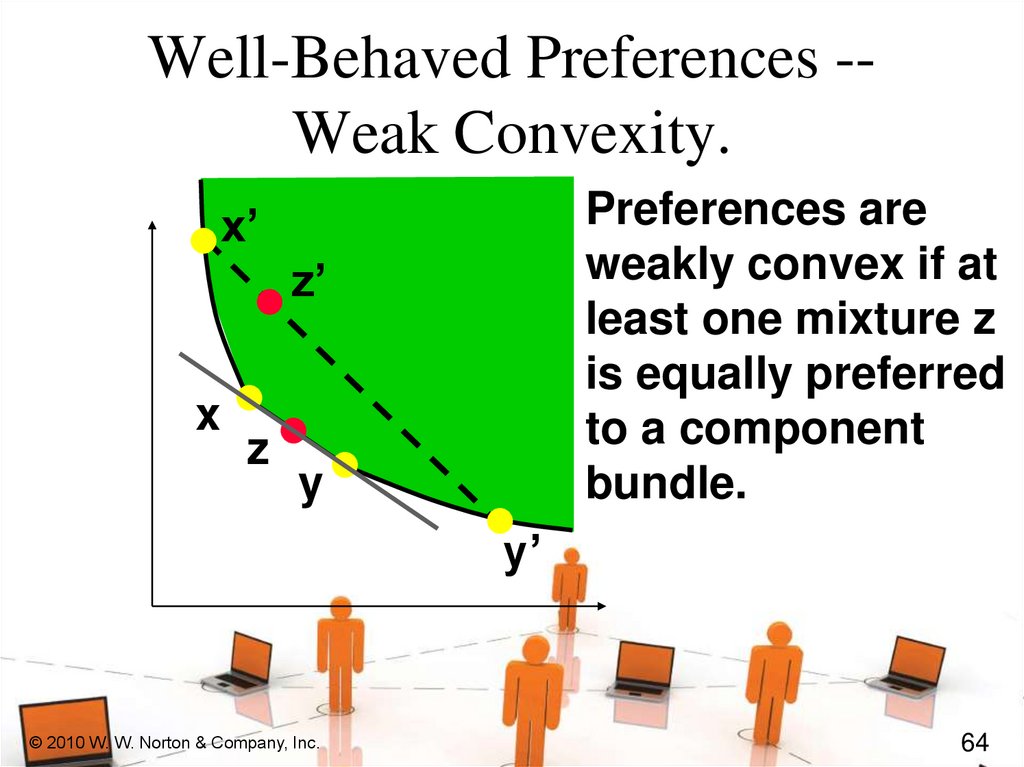
Well-Behaved Preferences -Weak Convexity.Preferences are
weakly convex if at
least one mixture z
is equally preferred
to a component
bundle.
x’
z’
x
z
y
y’
© 2010 W. W. Norton & Company, Inc.
64
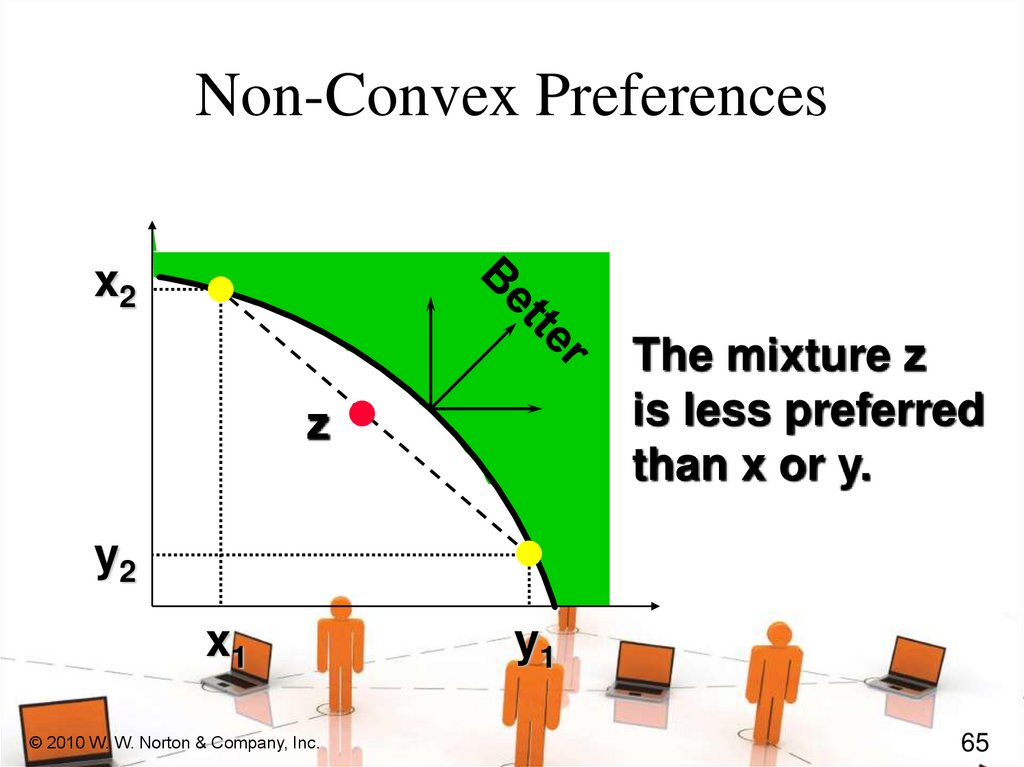
65.
Non-Convex Preferencesx2
The mixture z
is less preferred
than x or y.
z
y2
x1
© 2010 W. W. Norton & Company, Inc.
y1
65
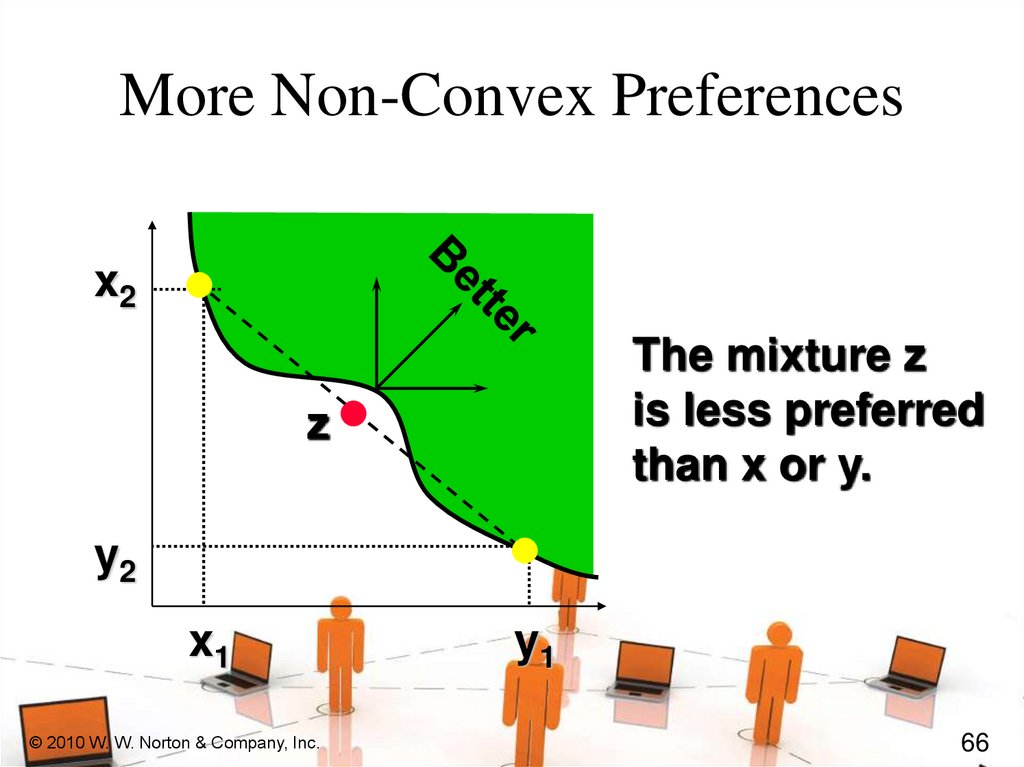
66.
More Non-Convex Preferencesx2
The mixture z
is less preferred
than x or y.
z
y2
x1
© 2010 W. W. Norton & Company, Inc.
y1
66
67.
Slopes of Indifference CurvesThe slope of an indifference curve is
its marginal rate-of-substitution
(MRS).
How can a MRS be calculated?
© 2010 W. W. Norton & Company, Inc.
67
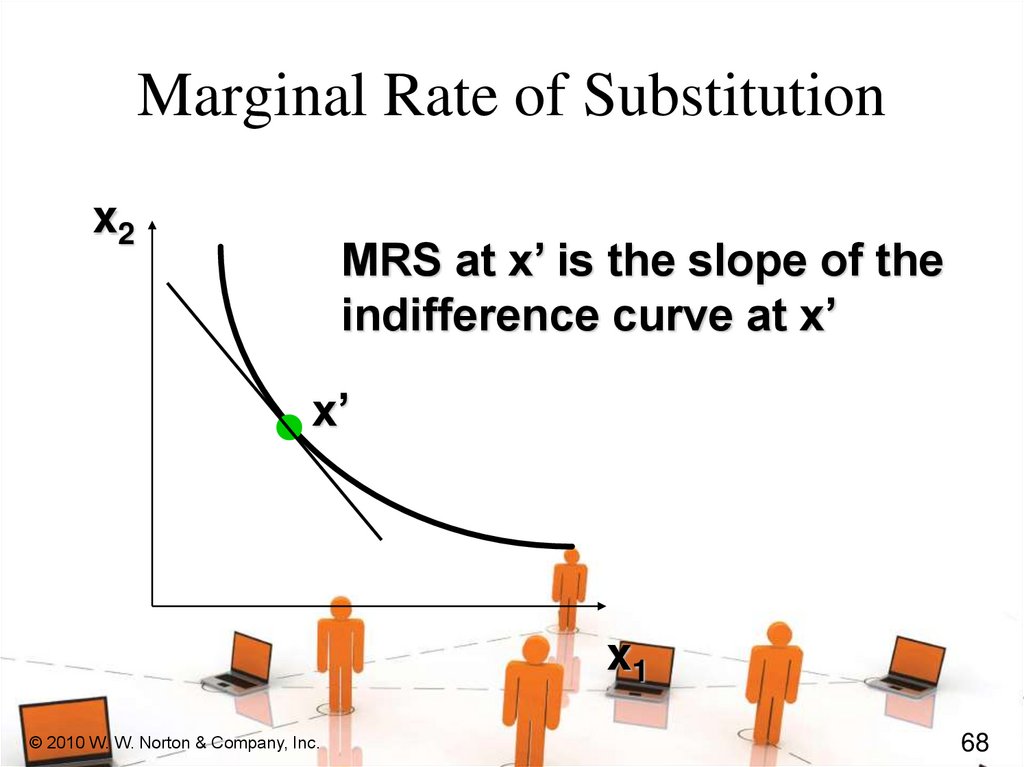
68.
Marginal Rate of Substitutionx2
MRS at x’ is the slope of the
indifference curve at x’
x’
x1
© 2010 W. W. Norton & Company, Inc.
68
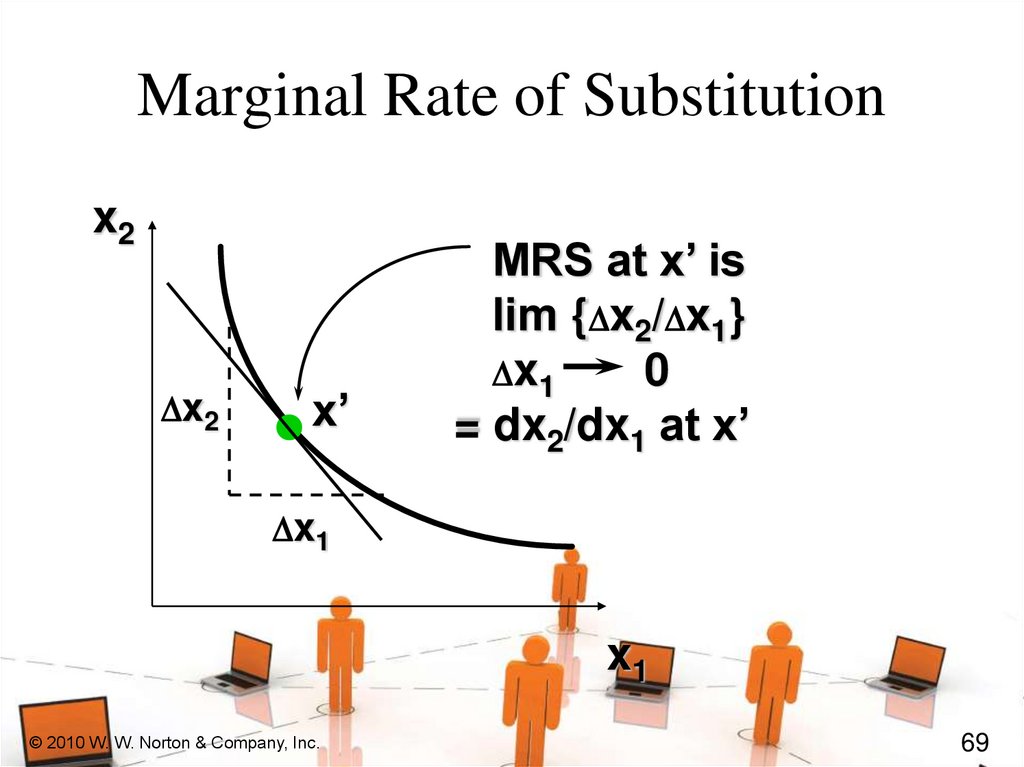
69.
Marginal Rate of Substitutionx2
D x2
x’
MRS at x’ is
lim {Dx2/Dx1}
Dx1
0
= dx2/dx1 at x’
Dx1
x1
© 2010 W. W. Norton & Company, Inc.
69
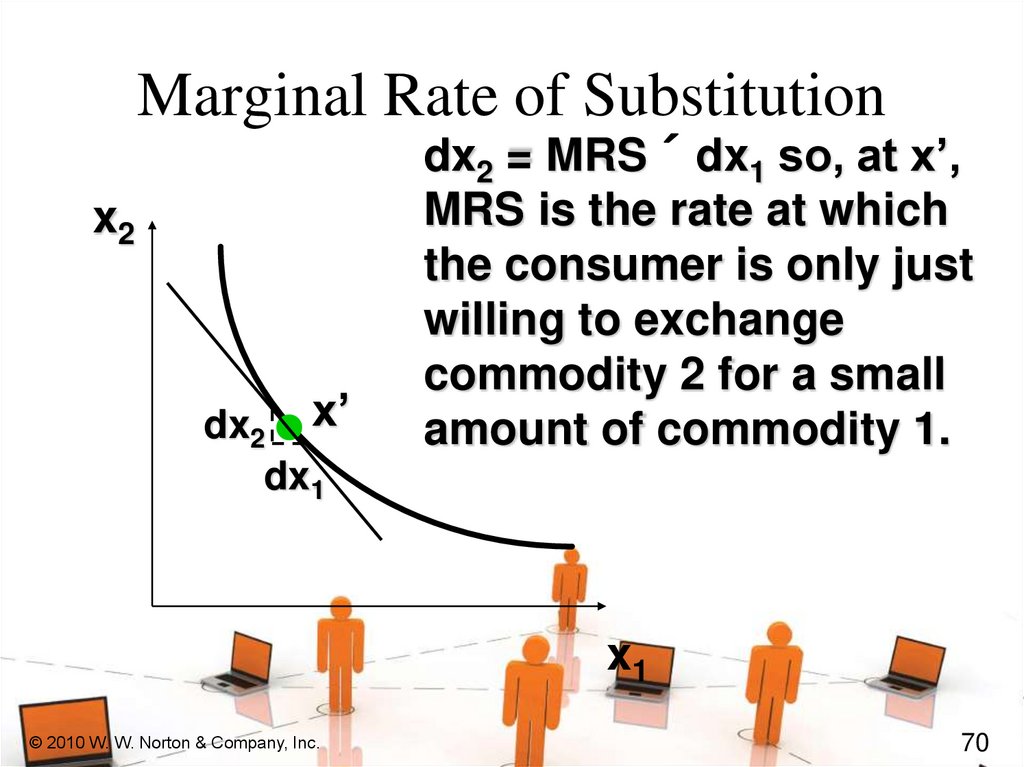
70.
Marginal Rate of Substitutionx2
dx2 x’
dx1
dx2 = MRS ´ dx1 so, at x’,
MRS is the rate at which
the consumer is only just
willing to exchange
commodity 2 for a small
amount of commodity 1.
x1
© 2010 W. W. Norton & Company, Inc.
70
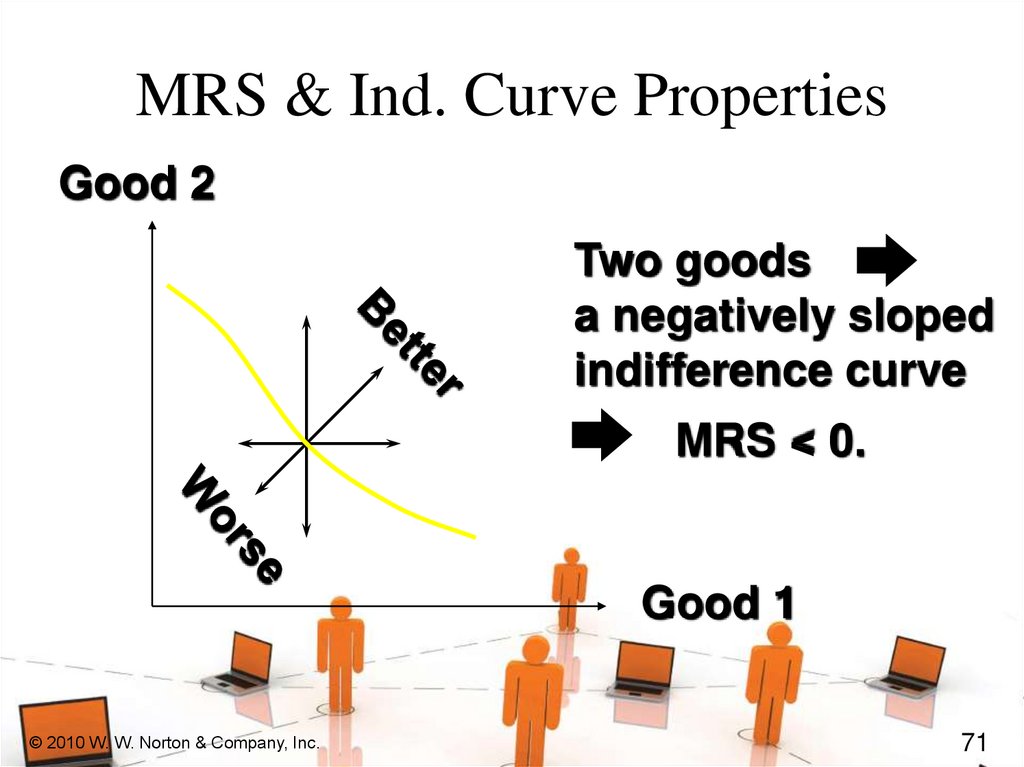
71.
MRS & Ind. Curve PropertiesGood 2
Two goods
a negatively sloped
indifference curve
MRS < 0.
Good 1
© 2010 W. W. Norton & Company, Inc.
71
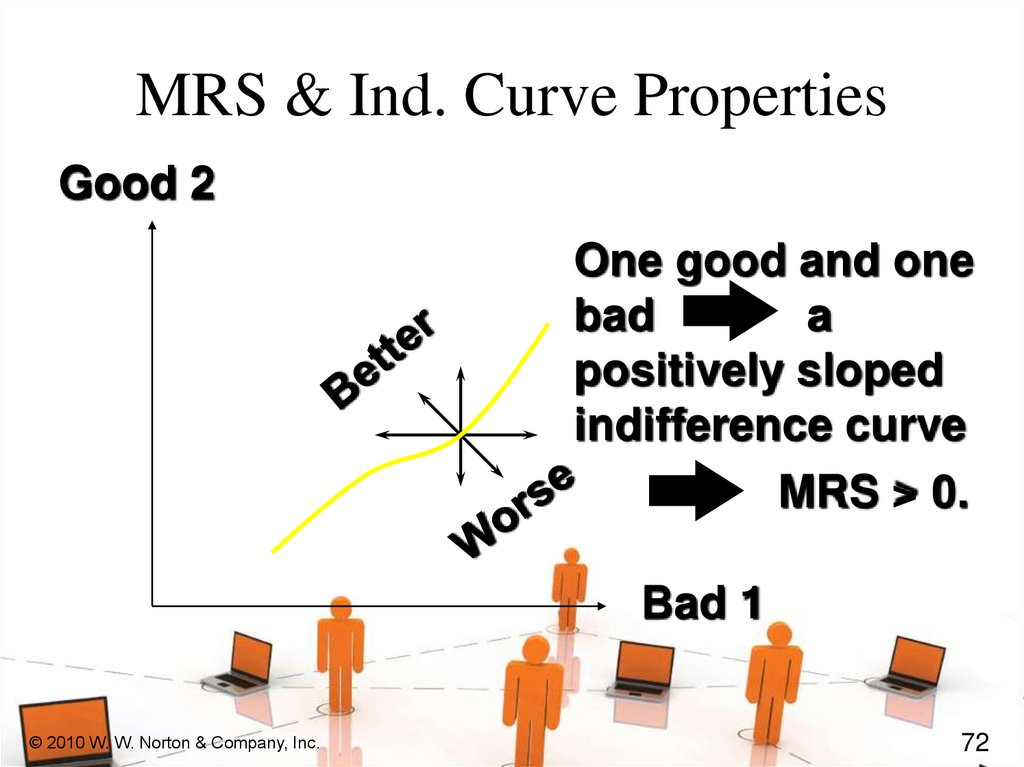
72.
MRS & Ind. Curve PropertiesGood 2
One good and one
bad
a
positively sloped
indifference curve
MRS > 0.
Bad 1
© 2010 W. W. Norton & Company, Inc.
72
73.
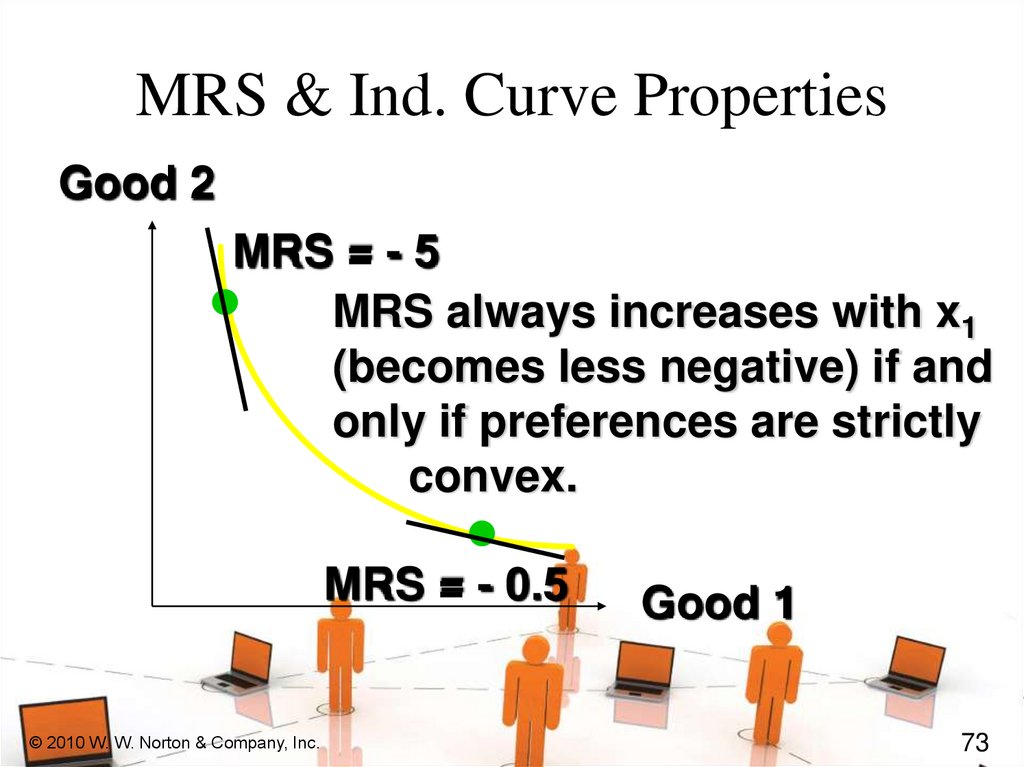
MRS & Ind. Curve PropertiesGood 2
MRS = - 5
MRS always increases with x1
(becomes less negative) if and
only if preferences are strictly
convex.
MRS = - 0.5
© 2010 W. W. Norton & Company, Inc.
Good 1
73
74.
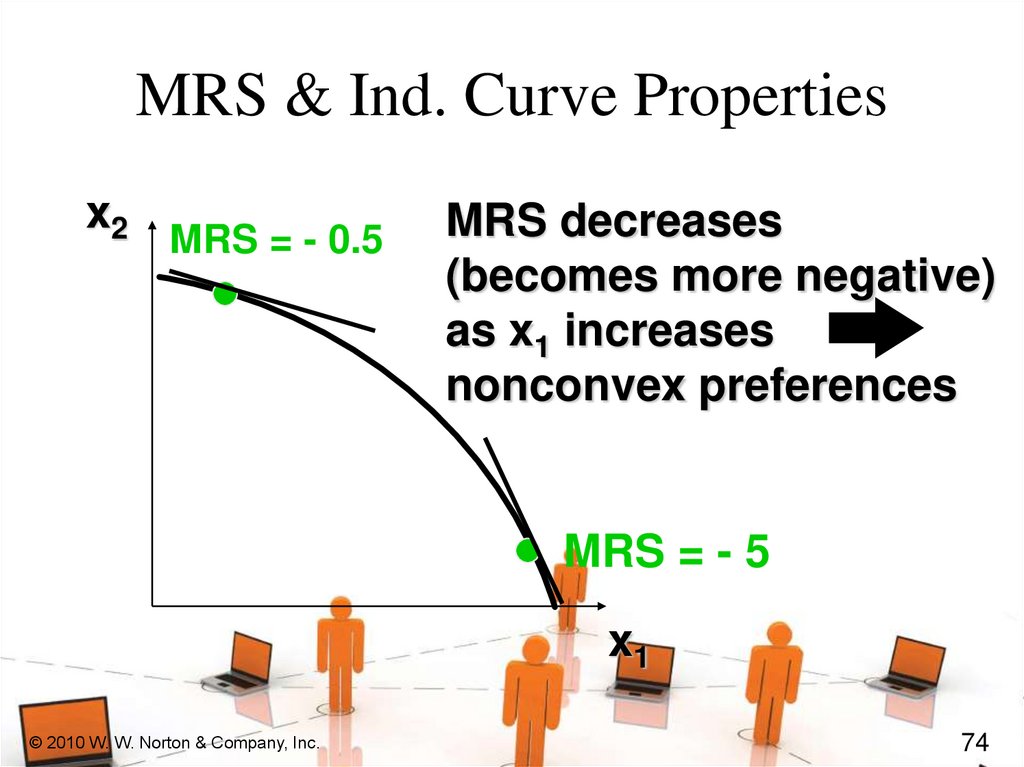
MRS & Ind. Curve Propertiesx2
MRS = - 0.5
MRS decreases
(becomes more negative)
as x1 increases
nonconvex preferences
MRS = - 5
x1
© 2010 W. W. Norton & Company, Inc.
74
75.
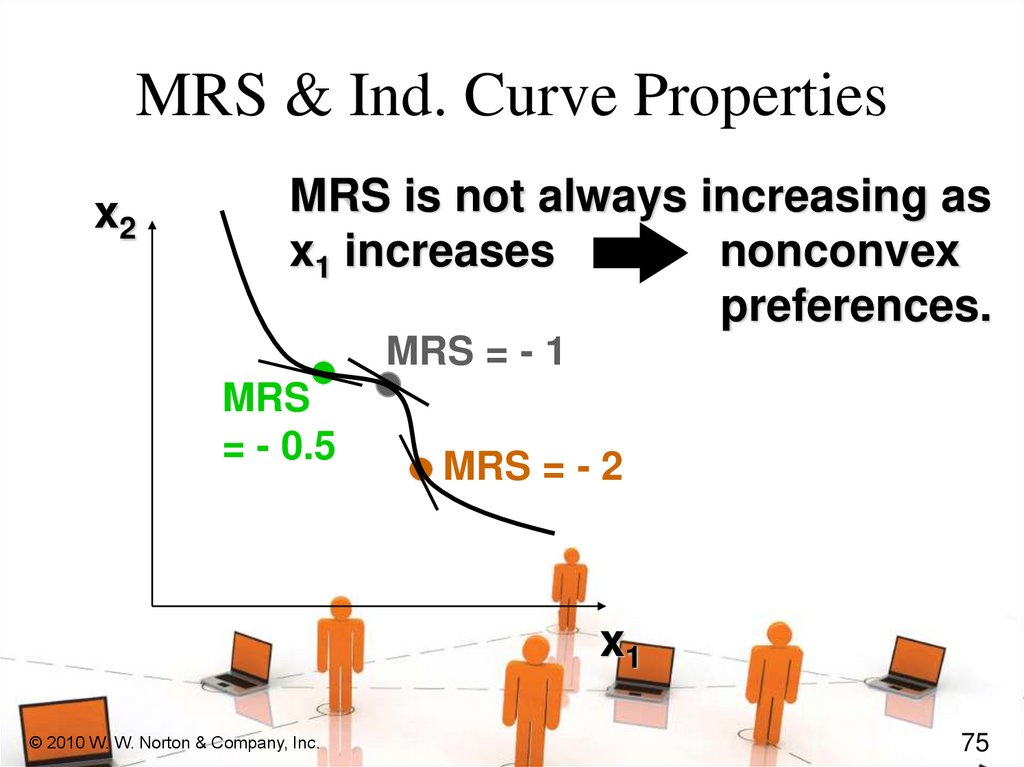
MRS & Ind. Curve Propertiesx2
MRS is not always increasing as
x1 increases
nonconvex
preferences.
MRS = - 1
MRS
= - 0.5
MRS = - 2
x1
© 2010 W. W. Norton & Company, Inc.
75
76.
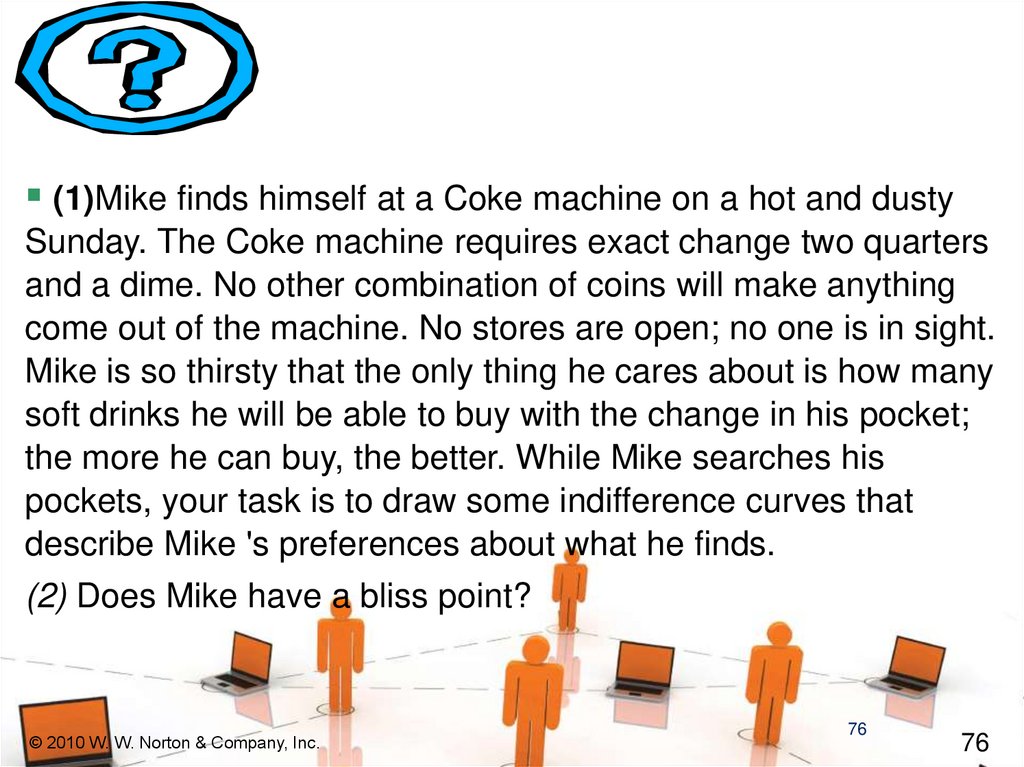
(1)Mike finds himself at a Coke machine on a hot and dustySunday. The Coke machine requires exact change two quarters
and a dime. No other combination of coins will make anything
come out of the machine. No stores are open; no one is in sight.
Mike is so thirsty that the only thing he cares about is how many
soft drinks he will be able to buy with the change in his pocket;
the more he can buy, the better. While Mike searches his
pockets, your task is to draw some indifference curves that
describe Mike 's preferences about what he finds.
(2) Does Mike have a bliss point?
© 2010 W. W. Norton & Company, Inc.
76
76
77.
© 2010 W. W. Norton & Company, Inc.77
77
78.
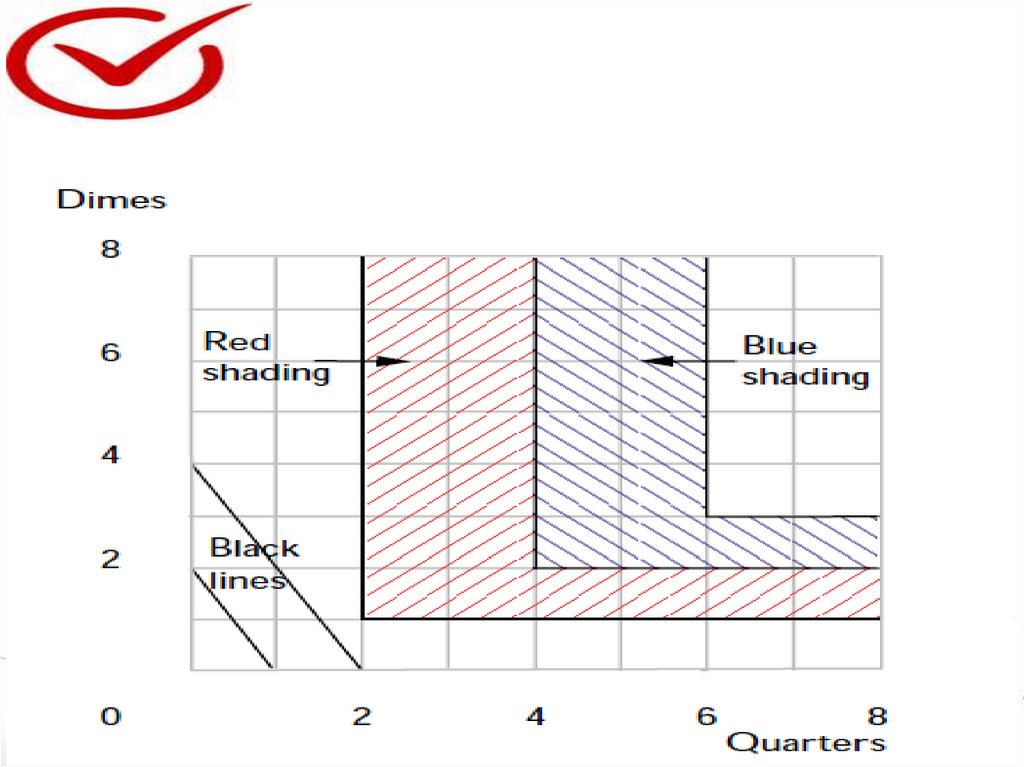
(3) If Mike had arrived at the Coke machine on a Saturday, thedrugstore across the street would have been open. This
drugstore has a soda fountain that will sell you as much Coke as
you want at a price of 4 cents an ounce. The salesperson will
take any combination of dimes and quarters in payment.
Suppose that Mike plans to spend all of the money in his pocket
on Coke at the drugstore on Saturday. On the graph above, use
pencil or black ink to draw one or two of Mike 's indifference
curves between quarters and dimes in his pocket. (For simplicity,
draw your graph as if Mike 's fractional quarters and fractional
dimes are accepted at the corresponding fraction of their value.)
© 2010 W. W. Norton & Company, Inc.
78
78
79.
© 2010 W. W. Norton & Company, Inc.79
79
80.
a© 2010 W. W. Norton & Company, Inc.
80
80
81.
© 2010 W. W. Norton & Company, Inc.81
81
82.
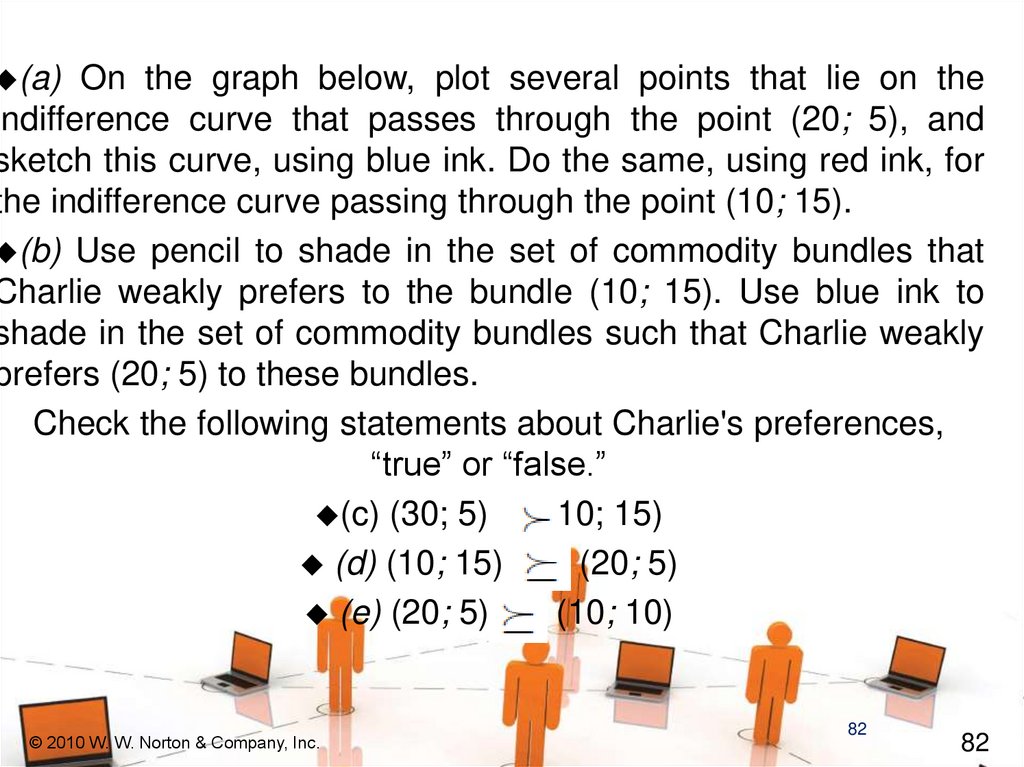
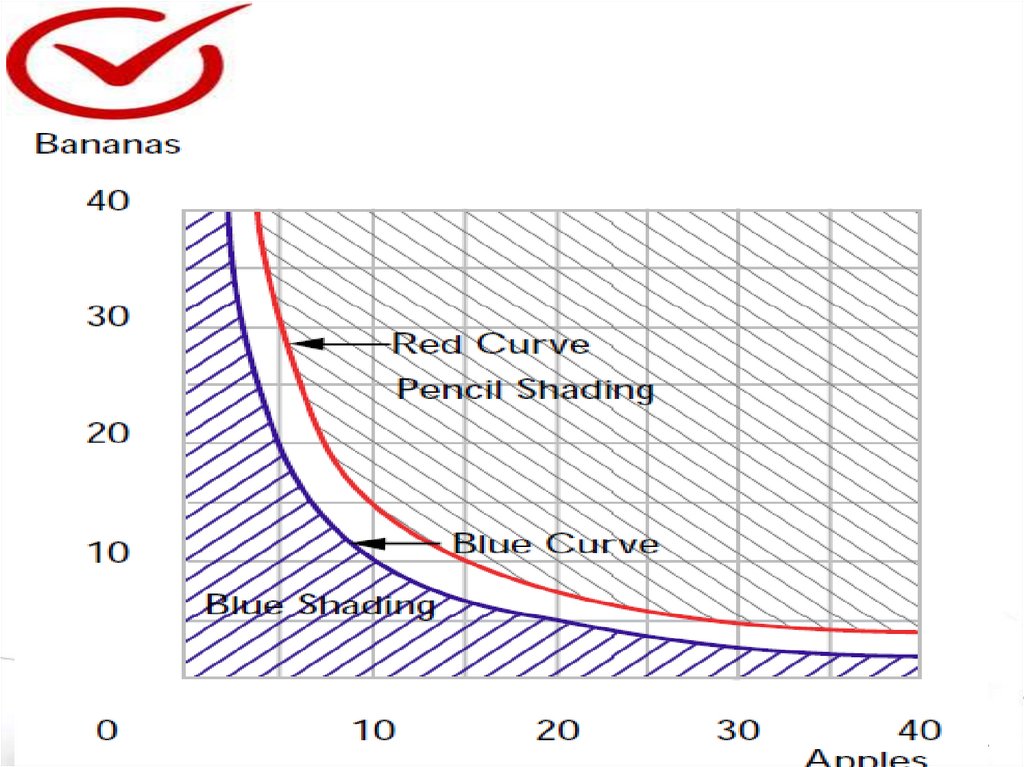
(a)On the graph below, plot several points that lie on the
indifference curve that passes through the point (20; 5), and
sketch this curve, using blue ink. Do the same, using red ink, for
the indifference curve passing through the point (10; 15).
(b) Use pencil to shade in the set of commodity bundles that
Charlie weakly prefers to the bundle (10; 15). Use blue ink to
shade in the set of commodity bundles such that Charlie weakly
prefers (20; 5) to these bundles.
Check the following statements about Charlie's preferences,
“true” or “false.”
(c) (30; 5) ~ (10; 15)
(d) (10; 15)
(20; 5)
(e) (20; 5)
(10; 10)
© 2010 W. W. Norton & Company, Inc.
82
82
83.
© 2010 W. W. Norton & Company, Inc.83
83
84.
a© 2010 W. W. Norton & Company, Inc.
84
84
85.
© 2010 W. W. Norton & Company, Inc.85
85
86.
© 2010 W. W. Norton & Company, Inc.86
86
87.
© 2010 W. W. Norton & Company, Inc.87
87