


 Информатика
Похожие презентации:


Processing and analysis of scientific data. Collection, storage, and visualization of experimental data
1. Processing and analysis of scientific data. Collection, storage, and visualization of experimental data. Use of Google Colab,
Excel, and GoogleSheets for statistical processing and
data analysis in Power BI.
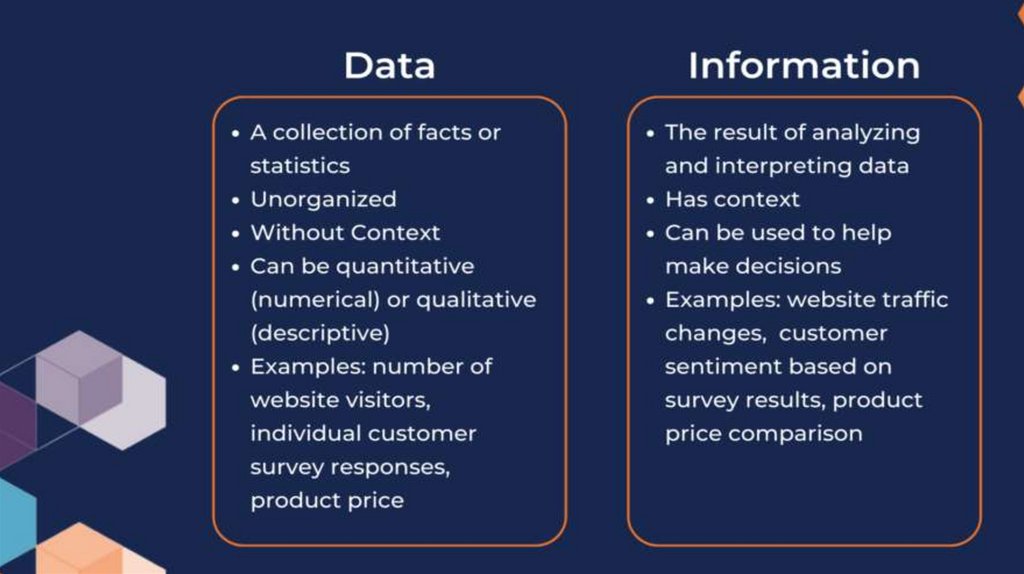
2. What is Data?
Data is a collection of raw, factual information,which can be in the form of numbers, words,
observations, or images, gathered through
measurement, counting, or observation of an
object or phenomenon. Unlike information, data
is unprocessed; it becomes useful "information"
when analyzed, organized, and interpreted to
provide meaning, context, and insights for
decision-making.
3.
4.
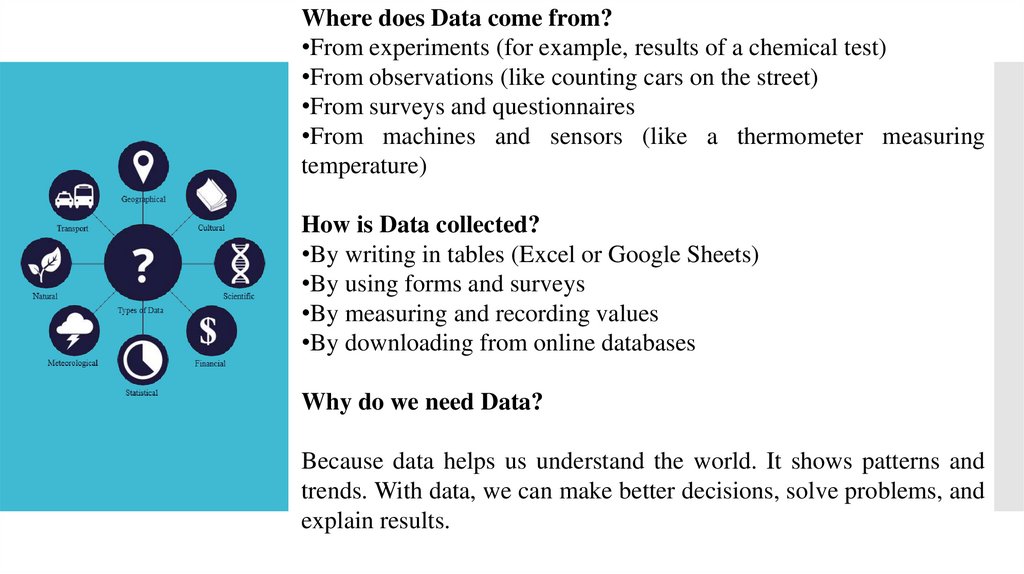
Where does Data come from?•From experiments (for example, results of a chemical test)
•From observations (like counting cars on the street)
•From surveys and questionnaires
•From machines and sensors (like a thermometer measuring
temperature)
How is Data collected?
•By writing in tables (Excel or Google Sheets)
•By using forms and surveys
•By measuring and recording values
•By downloading from online databases
Why do we need Data?
Because data helps us understand the world. It shows patterns and
trends. With data, we can make better decisions, solve problems, and
explain results.
5. Data Collection
Data Collection means finding and writing down information.It is the first step when we work with data.
Data collection is the process of collecting and evaluating
information or data from multiple sources to find answers to
research problems
We can collect data in different ways. We can ask questions
(surveys), we can count things (like how many cars pass a
street), or we can measure (like the temperature every day).
So, data collection is simply getting information from people,
nature, or experiments and saving it.
6. Data Storage
Data Storage means keeping information in a safeplace so we can use it later. Data storage is the
process of recording and retaining digital information
on various media for ongoing or future use
For example, when we write exam results in a
notebook, that is storage. When we save the same
results in Excel or Google Sheets on a computer, that
is also storage.
Data can be stored on paper, on a computer, on a
USB, or in online services like Google Drive.
So, data storage is simply saving information in a
way that we can find and use it again when we need
it.
7. Data processing
Data processing is the conversion of raw,unstructured data into a structured,
meaningful, and usable format, such as charts,
graphs, or reports
8. Data Visualization
Data visualization is the practice of representingcomplex information and data in a graphical format,
such as charts, graphs, and maps, to make it easier
for the human brain to understand patterns, trends,
and outliers.
Data
Visualization
9. Started with Google Colab
1) What you need•A Google account (Gmail).
•A web browser (Chrome or Edge works best).
•Internet connection.
Started with
Google Colab
2) Open Google Colab
Option A (direct):
Type colab.research.google.com in your browser and sign in.
Option B (from Google Drive):
1.Go to drive.google.com → sign in.
2.Click New → More → Google Colaboratory.
1. If you don’t see “Google Colaboratory”: click New → More → Connect
more apps, search “Colaboratory”, click Install, then try again.
3) Create a new notebook
•In Colab, click File → New notebook.
•Rename it: click Untitled.ipynb at the top and type a name (e.g., My First Colab).
4) Connect to a runtime
•Click the Connect button (top-right).
•Wait until it shows RAM / Disk (this means it’s ready).
10. Task 1
Explanation:This is the simplest task. You will learn how to run a Python command in
Colab.
Steps:
1.Open Colab → New Notebook
2.In the first cell, type this code and run with Shift + Enter:
Task 1
11. Task 2
Explanation:Now let’s try simple calculations in Colab, like a calculator. No extra libraries
are needed.
Steps:
Type this code and run it:
Task 2
12. Task 3
Create a table with PandasExplanation:
To work with data (tables), we use a special library called pandas.
If pandas is not installed, type this line first:
Steps:
Then type this code:
Task 3
13. Task 4
Make a simple chartExplanation:
To show data as a picture, we use matplotlib (a library for charts).
First, install it (if not installed):
Steps:
Now try this code:
Task 4
14. Task 5
Change the chart typeExplanation:
Now take the same student scores from Task 4, but show them as a pie chart
instead of a bar chart.
Task 5
15. Task 6
Create a line chart of temperaturesExplanation:
In this task, you will make a line chart instead of a bar chart. The data will be
about the average temperature of 5 days.
Task 6