


 Промышленность
Похожие презентации:


Utilization of seismic and infrasound signals for characterizing mining explosions
1. UTILIZATION OF SEISMIC AND INFRASOUND SIGNALS FOR CHARACTERIZING MINING EXPLOSIONS
Pawlenko M.2.
3.
Microseismic System1.Sensors: Uniaxial and triaxial
accelerometers and/or geophones.
2.Junction Box - (JB): A NEMA-4
enclosure that houses essential acquisition
and communications equipment including
the Paladin® digital seismic recorder
which serves as the backbone of ESG’s
microseismic data acquisition system.
3.Ethernet communication: Fiber
(underground) or radio (surface) for
reliable, full waveform data transfer.
4.Acquisition PC: Acquisition Server,
watchdog, optional large external storage
drive and uninterruptable power supply
(UPS).
5.Processing PC: Fast multi-core
Processor and powerful dedicated video
card.
4.
Figure 1: Peak Pg amplitudes observed at array element 03 of PDAR (360 kmrange) from contained singlefired explosions, delay-fired cast blasts and delayfired coal shots
5.
Figure 2: Peak P and Rg amplitudes observed at EYMN (Ely,Minnesota) from taconite fragmentation
explosions approximately 110 km to the southwest of the station.
6.
Figure 3: Peak amplitudes of in-mine recordings at Morenci are compared to total amount ofexplosives used in copper fragmentation blasts (left). Peak Pg, Lg and Rg amplitudes observed at
the regional station TUC plotted against total amount of explosives used in the Morenci copper
fragmentation explosions (right).
7.
Figure 4: The three components of the equivalent mining explosion source model are representedpictorially. They consist of (a) the directly coupled energy from the contained explosion modeled
as a Mueller-Murphy source function, (b) vertical spall due to the tensile failure of near-surface
materials and (c) horizontal spall accompanying cast blasting when overburden is cast horizontally
into a pit.
8.
Figure 5: Spall mass (per hole) for the taconite hard rock explosions (open diamonds) and asingle coal cast blast (star) was estimated from blasting logs. These empirical estimates from
mining explosions are compared to the Viecelli and Sobel spall mass scaling relations
developed for underground nuclear explosions.
9.
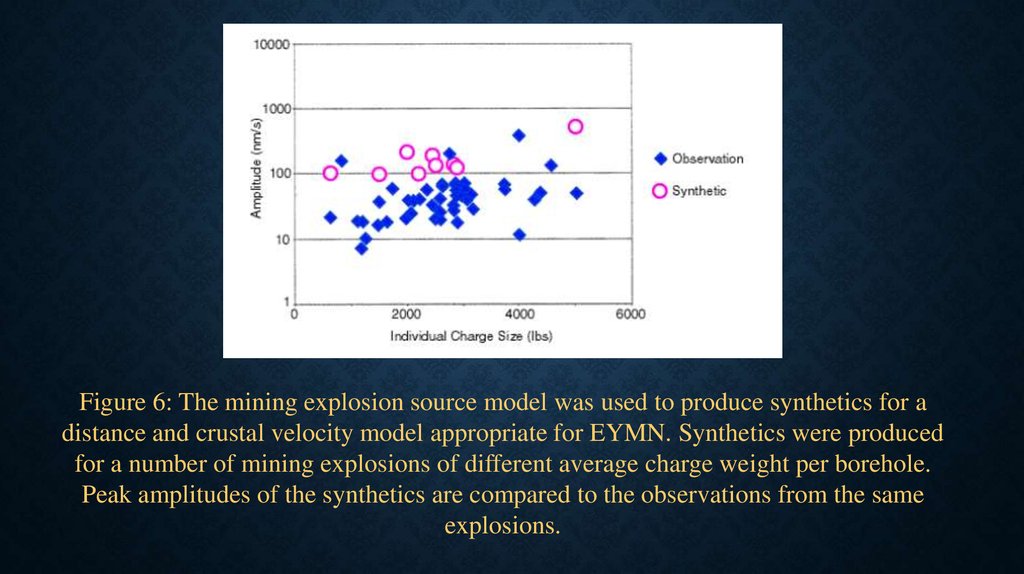
Figure 6: The mining explosion source model was used to produce synthetics for adistance and crustal velocity model appropriate for EYMN. Synthetics were produced
for a number of mining explosions of different average charge weight per borehole.
Peak amplitudes of the synthetics are compared to the observations from the same
explosions.
10.
Figure 7: The mining explosion source model was also used to compute synthetics for thelarge-scale cast blasts. The focus in this modeling exercise is on the long period surface
waves.
11.
Figure 8: Mining explosions from the hard rock copper mines in southeastern Arizona generateinfrasound signals as exemplified by the records from DLIAR in Los Alamos (left). Ground truth
for this event was provided by close-in seismic and acoustic records of the blast (left, inset).
Frequency wave number estimates were used to make the back azimuth estimate shown to the
right.
12.
Figure 9: Infrasound (channels 1,2, 3) and seismic data (channel 4) from a seismo-acoustic stationinstalled outside El Paso, Texas (Ft. Hancock). Each horizontal section represents 10 minutes of
data. This seismo-acoustic signal that extends for over 30 minutes represents the explosion and
burning of a natural gas line in New Mexico
13.
Figure 10: The details of the infrasound (channels 1-3) and seismic (channel 4) signals from the gasexplosion are shown to the left. These signals are compared to close-in seismic signals of the blast
shown to the right (courtesy of T. Wallace). Both the close-in seismic and the infrasound signals
suggest a complex source function for the initial explosion. The seismo-acoustic station at Ft.
Hancock has porous and slow velocity alluvium at the surface that may be responsible for the
strong coupling between the infrasound and seismic channels.
14.
CONCLUSIONS AND RECOMMENDATIONSSeismic
1. Peak seismic amplitudes from delay-fired mining explosions show little relation to explosive yield.
2. Single-fired, contained explosions generate regional seismic waves with an amplitude scaled by
explosive weight, W0.84.
3. Source models for mining explosions replicate the insensitivity of peak amplitude of regional phases to
total explosive weight although there is some indication that the peak regional amplitudes may be
related to the weight of the simultaneously detonated explosives, possibly a single borehole.
4. Mid-period (2-12 s) surface waves are observed from large scale cast blasts and reflect the large source
duration of such explosions.
5. Blasting practice varies greatly between mines and within mines and in-mine instrumentation may be
required to provide ground truth for regional seismogram interpretation.
Infrasound
1. A small percentage of mining explosions are observed to have infrasound signals.
2. The presence or absence of regional infrasound signals is related to event size and propagation path
effects.
3. Shallow explosions may produce infrasound signals but no regional seismic signals.
4. Infrasound signals may document source duration.