


 Промышленность
Похожие презентации:


Testing and design of buckling restrained braces for Canadian application
1.
See discussions, stats, and author profiles for this publication at: https://www.researchgate.net/publication/265319734Testing and design of buckling restrained braces for Canadian application
Article · January 2004
CITATIONS
READS
17
1,395
3 authors, including:
Robert Tremblay
Polytechnique Montréal
239 PUBLICATIONS 4,343 CITATIONS
SEE PROFILE
Some of the authors of this publication are also working on these related projects:
Investigation and behavior of coupled steel plate shear wall with simple beam connections View project
Seismic Stability of Multi-tiered Braced Frames View project
All content following this page was uploaded by Robert Tremblay on 24 January 2017.
The user has requested enhancement of the downloaded file.
2.
13th World Conference on Earthquake EngineeringVancouver, B.C., Canada
August 1-6, 2004
Paper No. 2893
TESTING AND DESIGN OF BUCKLING RESTRAINED BRACES
FOR CANADIAN APPLICATION
Tremblay, R.1, Poncet, L.2, Bolduc, P.3, Neville, R.4 and DeVall, R.5
SUMMARY
This paper presents qualifying tests performed on two Buckling Restrained Brace (BRB) members and
describes an analytical study carried out to evaluate the seismic performance of structures equipped with
these members. The test program examined the possibility of reducing the brace core length in order to
increase brace axial stiffness. In the analytical study, the seismic performance of a 3-storey structure with
buckling restrained braces is evaluated and compared to that of the same building designed with
conventional steel braces. The results indicate that buckling restrained braced frames designed according
to the 2005 National Building Code of Canada with an Rd factor of 4.0 would provide a level of
performance comparable to that offered by Type MD concentrically braced steel frames. One main
advantage of using buckling restrained braces is the reduction in the forces imposed on the foundations
and surrounding structural elements.
INTRODUCTION
The use of Buckling Restrained Braced (BRB) frames in lieu of conventional concentrically braced steel
frames (CBFs) is gaining popularity both for new construction or rehabilitation projects. BRB frames have
the advantages of exhibiting a more stable hysteretic response and to impose reduced forces on the
foundations and the adjacent structural elements that must be capacity protected. Compared to
conventional tension-compression CBFs, the BRB system typically is laterally more flexible due to higher
brace axial design stresses but this shortcoming can be overcome by reducing the length of the yielding
core segment of the braces, Lc, to increase the brace axial stiffness, as shown in Fig. 1. Brace cores so
designed are expected to experience higher strain demand, which could lead to premature fracture due to
low-cycle fatigue under repeated inelastic cycles. Peak strains in the range of 1-2% are anticipated under
severe ground motions and such amplitude has been considered in most test programs performed to date
on BBR members (e.g., Watanabe et al. [1]; Saeki et al. [2]; Maeda et al. [3]; Ko et al. 2002 [4]). Recent
tests by Iwata et al. [5], Tsai and Huang [6], and SIE [7] on braces made of structural steel grades used in
1
Professor, 2Research Associate, Dept. of Civil, Geological and Mining Eng., Ecole Polytechnique, P.O.
Box 6079, St. Centre-ville, Montreal, Canada H3C 3A7
3
Graduate Research Assistant, Dept. of Civil Eng., Laval University, Quebec, Canada, G1K 7P4.
4
Associate, 5Principal, Read Jones Christoffersen, 1285 West Broadway, Vancouver, Canada V6H 1X8
3.
Japan indicate that such braces can sustain loading histories with strains in the range of up to 3-6%, asanticipated under near-field earthquake events.
Steel core, A c
Lt 2
Lw
Lc
Lt 2
/2
Lt
Lc
/2
Lt
Steel Brace
(typ.)
Outer Steel Tube
Figure 1: Typical buckling restrained braced frame and buckling restrained brace.
The first part of the paper summarizes the findings of a sub-assemblage test program that was conducted
on concrete filled tube buckling restrained braces to assess their potential to withstand high seismic
induced strain demand when fabricated with structural steel currently in use in Canada. In the second part
of the paper, an analytical study is carried out to examine the seismic performance of adjacent three-storey
building structures constructed with three different braced frame systems: buckling restrained braces with
long and short core segments, respectively, and a tension-compression conventional CBF system. The
structures are located in Vancouver, B.C. and are designed according to the seismic provisions of the
upcoming 2005 edition of the National Building Code of Canada (NBCC) (Heidebrecht [8]). Design
aspects such as the prediction of the strain demand on brace cores in the BRB frames and the design
forces to be considered for the foundations are discussed. Peak storey drifts, minimum building
separation, inelastic demand on brace elements, and peak forces that develop in the foundations are
examined for each system. Modeling techniques for buckling restrained braces are also discussed.
TEST PROGRAM
Test specimens
Sub-assemblage testing of buckling restrained braces was performed in a 4.877 m width x 3.658 m tall
steel frame mounted horizontally in the Structural Engineering Laboratory at Ecole Polytechnique of
Montreal (Fig. 2). The test frame was truly pinned at its four corners and the load was applied by means of
a 1.5 MN actuator. The experimental program included two brace specimens that were each composed of
a steel core element inserted in a cold formed (Type C) circular HSS 273x6.4 tube made of G40.21-350W
steel filled with 20 MPa flowable pea gravel concrete. The core was made of G40.21-350WT steel with
enhanced thoughness properties. The measured yield and tensile properties of the core steel material were
Fy = 370 MPa and Fu = 492 MPa, and the core cross-section was 12.7 mm x 125 mm, resulting in a brace
yield load, Py, of 587 kN. The only difference between the two braces was the length of the core segment:
Lc = 2483 (Specimen C1-1) and 1001 mm (Specimen C2-1).
The brace ends were stiffened to ensure stable elastic response outside of the tube, and the connections to
the test frame were done with high-strength bolts and splice plates (see Fig. 2). The stiffeners extended a
minimum of 256 mm into the tubes. The core plates were flame cut from single plate elements (no splices
permitted) using a numerically controlled equipment. Transitions between the core and the end segments
were sloped at 1:4 with 102 mm radius. The edges of the core and transition segments were ground to
4.
achieve a smooth finish with no visible notching. After fabrication of the core plates, trapezoidal 12.7 mmthick blocks made of flexible (Styrofoam) material were placed against the interior edges of the core end
stiffeners as well as against the interior side of the transition zones to allow the brace cores to deform
freely in compression without direct bearing against the concrete fill. A 3 mm thick flexible material (Dow
Ethafoam 222) was placed on both edges of the plates along the middle core segment to permit lateral
expansion of the core due to Poisson’s effects. The brace plates were then wrapped with 4 layers of 0.2
mm polyethylene film secured with tape to break the bond between the concrete and the core.
Figure 2: Brace specimen in the test frame.
Test protocol
The qualifying quasi-static cyclic test sequence that was considered at the time of testing for inclusion in
future NEHRP provisions for Buckling Restrained Braces was adopted for the test program (Sabelli [9]).
This test protocol starts with 6 cycles at ∆ = ∆y and the amplitudes in the subsequent cycles are based on
the design storey drift, ∆m, for the frame studied: 4 cycles at ± 0.5 ∆m, 4 cycles at ± 1.0 ∆m, and 2 cycles at
± 1.5 ∆m. In the NEHRP draft provisions, the value of ∆m must not be taken lower than 0.01 hs but need
not exceed 5.0 ∆y. For buildings of the normal importance category designed according to the 2005
NBCC, it is expected that the anticipated total storey drift, including inelastic deformations, be equal to or
greater than 5.0 ∆y and, therefore, ∆m = 5.0 ∆y was adopted for the test sequence. Under the large
amplitude cycles at ± 7.5 ∆y (1.5 ∆m), the maximum strain demand on the brace cores were expected to
reach respectively 1.9% and 3.7% for the long and short brace core specimens.
Test results
Both specimens could withstand the total displacement history and it was decided to apply four extra
cycles with displacements varying from 0 to +10.0 ∆y (+ = tension in the brace) to assess the reserve in
fracture life. Figure 3 shows the measured brace axial load-core strain relationship for both specimens, the
brace load P being obtained assuming truss response of the system and normalized to the yield load Py =
587 kN. Table 1 gives the normalized peak storey shear in the frame, V/Vy, as measured in the first and
second cycles at each displacement level (V+ induce tension in the brace specimen). During the six elastic
cycles, the lateral stiffness of the frame was determined from measurements and compared to theoretical
predictions. The test-to-predicted ratios are equal to 1.00 and 1.04 for Specimens C1-1 and C2-1,
respectively, indicating that the method that was used, and which is discussed later in the next section, can
be employed to accurately evaluate the lateral stiffness of BRB frames.
The plots in Fig. 3 show that both specimens exhibited a stable and repeatable response with steadily
increasing resistance over the entire qualifying test protocol and the four additional tension loading cycles.
5.
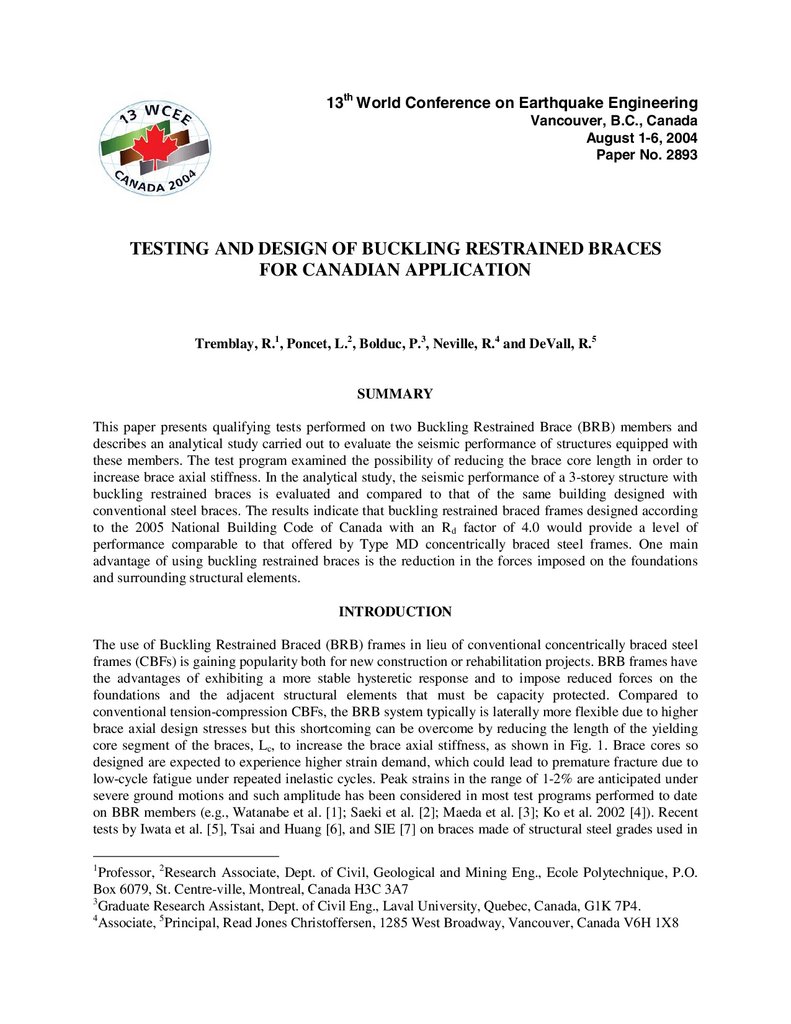
No damage could be observed except small concrete debris coming out of the tube end plates during theadditional tension displacement cycles at 10 ∆y. After the first inelastic excursion at -2.5∆y, the transition
from elastic to inelastic behavior became more progressive due to the Baushinger effect on the steel core.
The transition is smoother on the compression side, probably because the core developed limited local
buckling prior to yielding due to the clearance left between the core and the concrete fill. As larger
deformation amplitudes and further cycles were applied, both kinematic and isotropic strain hardening
responses in the steel core material resulted in a gradual increase of the brace resistance upon yielding.
The brace stiffness in the inelastic range is generally higher in compression, and the difference is more
pronounced towards the end of the large 5.0 ∆y and 7.5 ∆y compression excursions. The second slope in
tension can be mainly attributed to strain hardening whereas friction developing between the locally
buckled steel core and the buckling restraining mechanism likely also contributed to the increase in
strength upon yielding in compression. Frictional response between the core and the concrete fill is
supported by strain gauge readings on the steel tube which indicate that axial compression developed in
the tube when approaching peak maximum compression displacements, immediately followed by tube
tension forces when the imposed displacement was reversed. In Test C2-1, slippage of one of the end
bolted connections occurred in tension and compression during the last two cycles at 7.5 ∆y, which
produced the sudden drops in capacity that can be noticed in Fig. 3b. However, that phenomenon had no
consequences on the brace response.
a)
b)
2.0
Lc = 2483 mm
2.0
Lc = 1001 mm
P / Py
P / Py
1.0
0.0
0.0
.
-1.0
-2.0
-2.0
-0.04
-0.02
0.00
0.02
0.04
-0.04
εc
-0.02
0
0.02
0.04
εc
Figure 3: Measured axial load-core deformation in Tests: a) C1-1; b) C2-1.
Table 1: Measured peak loads in first two cycles at each deformation amplitude
Cycle
1
2
7
8
11
12
15
16
17
18
εc –
(%)
-0.19
-0.20
-0.61
-0.61
-1.3
-1.3
-2.0
-2.0
-
Specimen C1-1
V/Vy
εc +
( )
(%)
-1.00
0.20
-1.05
0.21
-1.18
0.62
-1.18
0.62
-1.46
1.3
-1.52
1.3
-1.77
2.0
-1.78
2.0
2.7
2.7
V/Vy
( )
0.99
0.94
1.06
1.06
1.25
1.29
1.39
1.42
1.45
1.41
εc –
(%)
-0.18
-0.19
-0.92
-0.92
-2.1
-2.1
-3.3
-3.4
-
Specimen C2-1
V/Vy
εc +
( )
(%)
-1.00
0.19
-1.01
0.20
-1.13
0.92
-1.25
0.94
-1.44
2.2
-1.54
2.2
-1.75
3.5
-1.88
3.3
4.5
4.8
V/Vy
( )
0.95
0.94
1.11
1.18
1.34
1.37
1.47
1.52
1.60
1.54
6.
In Table 1, the measured peak loads with the brace acting in tension in the first cycles are slightly lessthan Py, in both tests, even if εc reached εy of the steel material (εy = 0.185%). This is due to the gradual
transition between elastic and yielding responses, after inelasticity had developed in previous cycles
(cycles started with compression). In the subsequent cycles at larger amplitude, the peak tension loads
amplified to eventually reach forces corresponding to the attainment of the steel tensile stress (Fu / Fy =
1.33) at peak core strains of approximately 2%. Under larger positive deformations, the apparent core
stress exceeded Fu, probably as a result of small secondary forces developing in the test frame at large
deformations. In compression, the peak applied load reached approximately 1.5 Vy in the cycles at ∆m =
5.0 ∆y (Cycles nos. 11 and 12) and 1.8 Vy in the cycles at 7.5 ∆y. As indicated earlier, such larger forces in
compression are the consequence of the friction between the core and the concrete, and the composite
action of the exterior tube and the concrete fill. In tension, similar tension loads were observed at similar
strain levels for the two specimens. Conversely, in compression, the peak compression forces seem to be
dependant upon the number of cycles, rather than the core strain amplitude, as both specimens developed
the same brace loads in the same cycles during the tests.
ANALYTICAL STUDY
Buildings studied
The influence of specifying different brace core lengths on the seismic performance of BRB frames is
examined through nonlinear dynamic analysis of a hypothetical 3-storey building located in Vancouver,
B.C., along the Pacific west coast of Canada (Fig. 4). The structure comprised a 13970 sq. m storage area
and a 7010 sq. m. retail area. Both structures are separated by a construction joint and behave individually.
Gravity loads are given in the figure. The design floor live load is the same for both structures except that
100% of that load must be considered as acting concomitantly with the seismic loads for the storage area,
which results in larger seismic weight and higher P-delta effects than in the retail area where 50% of the
live loads is combined with earthquake effects.
Storage Area: 144.6 m x 96.6 m
Retail Area: 72.6 m x 96.6 m
Design Loads:
Roof: D = 1.2 kPa
L = 1.93 kPa
Floors: D = 3.5 kPa + 1.0 kPa (Partitions)
L = 4.8 kPa (Storage & Retail)
Roof: W = 12 610 kN
Floors: W = 98 420 kN
Floors: W = 29 680 kN
3 @ 4.8 m
= 14.4 m
Exterior Cladding : D = 1.0 kPa
Roof: W = 24 660 kN
4 @ 6.0 m = 24.0 m
Vertical Bracing (typ.)
ELEVATION - TYPICAL BRACED FRAME
PLAN
Figure 4: Buildings studied.
In each principal direction, the seismic force resisting system of the storage building consisted of four 24
m, 4-bay long concentrically braced steel frames located along the exterior walls. Two such bracing bents
were used in each orthogonal direction for the retail building. Rigid diaphragm behavior was assumed and
structural steel with Fy = 345 MPa was used throughout. Three different bracing members were
considered: buckling restrained braces with long core segments (BRB-L), buckling restrained braces with
7.
short core segments (BRB-S), and conventional tension-compression braces (CBF system). The latter wasincluded for comparison purposes and the braces were assumed to be made of square HSS sections acting
in tension and compression. The center-to-center dimension of the braces, Lw, was equal to 7684 mm and
it was assumed that the total transition zone, Lt (see Fig. 1), would be 500 mm long and that the
connections would require a minimum length of 1300 mm, thus leading to a maximum core length, Lc of
5884 mm for the BRB-L system. For the BRB-S frame, the core segment dimension was reduced to 1300
mm and Lt was increased to 5084 mm, as discussed next. Note that the same core length was used for the
two buildings as would typically be the case in practice. For modeling the structures, the BRB members
were considered as bar elements with equivalent cross-sectional area, Ae, given by (Chen et al. [11]):
[1]
Ae =
Lw
Ac L w
=
L
A
A
Lc L t
j
Lc + L t c + L j c
+
+
At
Aj
Ac A t A j
The ratios Ac/Aj = 0.3 and Ac/At = 0.5 were assumed for both structures (Aj and At = cross-sectional area
of the joint and transition portions of the braces, respectively). This resulted in Ae/Ac = 1.18 and 1.82 for
the long and short brace core lengths, respectively.
Design of the braced frames
The design of the structure was performed according to the 2005 NBCC and the CSA-S16 Standard for
the design of steel structures [12]. The seismic loads were determined according to the static equivalent
force procedure with the lateral force at the base of the structure, V, given by:
[2]
V = S(Ta) Mv IE W / (Ro Rd) < (2/3) S(0.2) IE W / (Ro Rd)
where S(Ta) is the design response spectral acceleration at the design fundamental period, Ta, taken as
FaSa(0.2) for Ta<0.2 s, the smaller of FvSa(0.5) and FaSa(0.2) at Ta = 0.5 s, FvSa(1.0) at T = 1.0 s, and
FvSa(2.0) at T = 2.0 s. For periods between 0.2 and 2.0 s, S is obtained by linear interpolation. In these
expressions, Fa and Fv are respectively the acceleration-based and velocity-based site coefficients and the
values of Sa(Ta) correspond to 2% in 50 years uniform hazard spectral (UHS) acceleration ordinates
specified for the site. Mv is a factor that accounts for higher mode effects on base shear, IE is the
importance factor, W is the seismic weight, and Rd and Ro are respectively the ductility- and overstrengthrelated force modifications factors of the structural system. For braced steel frames, Ta can be taken as Ta
= 0.025 hn, where hn is the building height (in m). Alternatively, the period obtained from methods of
mechanics can be used provided that it does not exceed two times the value given by the empirical
expression. The second approach was used herein and Ta was therefore limited to 0.72 s (hn = 14.4 m). For
Vancouver, Sa values of 0.96, 0.66, 0.34, and 0.18 g were used at T = 0.2, 0.5, 1.0, and 2.0 s, respectively.
Firm ground condition (Site Class C) was assumed in the study, with Fa = Fv = 1.0. For these structures,
the Mv factor was equal to 1.0 and the buildings were of the normal importance category with IE = 1.0.
The seismic weight values at each level are given in Fig. 4 for both buildings.
For the CBF system, Type MD (Moderately Ductile) braced steel frames were adopted, which classify for
Rd = 3.0 and Ro = 1.3. In the proposed NBCC 2005, values have not yet been adopted for Rd and Ro for
BRB frames. In view of the anticipated similitude in inelastic response between the BRB system and
Ductile Eccentrically Braced Steel Frames (EBFs), the value Rd = 4.0 specified for EBFs was tentatively
retained herein for the design of the BRB frames. The overstrength-related factor, Ro, accounts for the
dependable overstrength that can be mobilized in a structure. It can be obtained from (Mitchell et al. [13])
Ro = Rsize Rφ Ryield Rsh Rmech, where Rsize is the overstrength arising from restricted choices for sizes of
8.
members and elements and rounding of sizes and dimensions, Rφ is a factor accounting for the differencebetween nominal and factored resistances, Ryield is the ratio of actual yield strength to minimum specified
yield strength, Rsh is the overstrength due to the development of strain hardening, and Rmech is the
overstrength arising from mobilizing the full capacity of the structure such that a collapse mechanism is
formed. In order to minimize concentration of inelastic demand along the building height, it is expected
that the cross-section area of the brace fuse segment will typically be adjusted at every floor so that its
factored resistance closely matches the factored code force level. Hence, it is advisable to use Rsize = 1.0
for Buckling Restrained Braced Frames. The factors Rφ and Ryield are respectively equal to 1.11 (= 1/φ) and
1.10 for steel (Mitchell et al. 2003). Rsh accounts for the ability of strain hardening to develop in the
material at the anticipated level of deformation for the structure studied. A review of past experimental
studies on Buckling Restrained Braces suggests that a value of 1.10 is suitable for this parameter. A value
of 1.0 is chosen for Rmech, as a full mechanism rapidly develops after initiation of yielding in the braces.
Substituting all these values gives Ro = 1.34, and a conservative value of 1.3 was selected for this study.
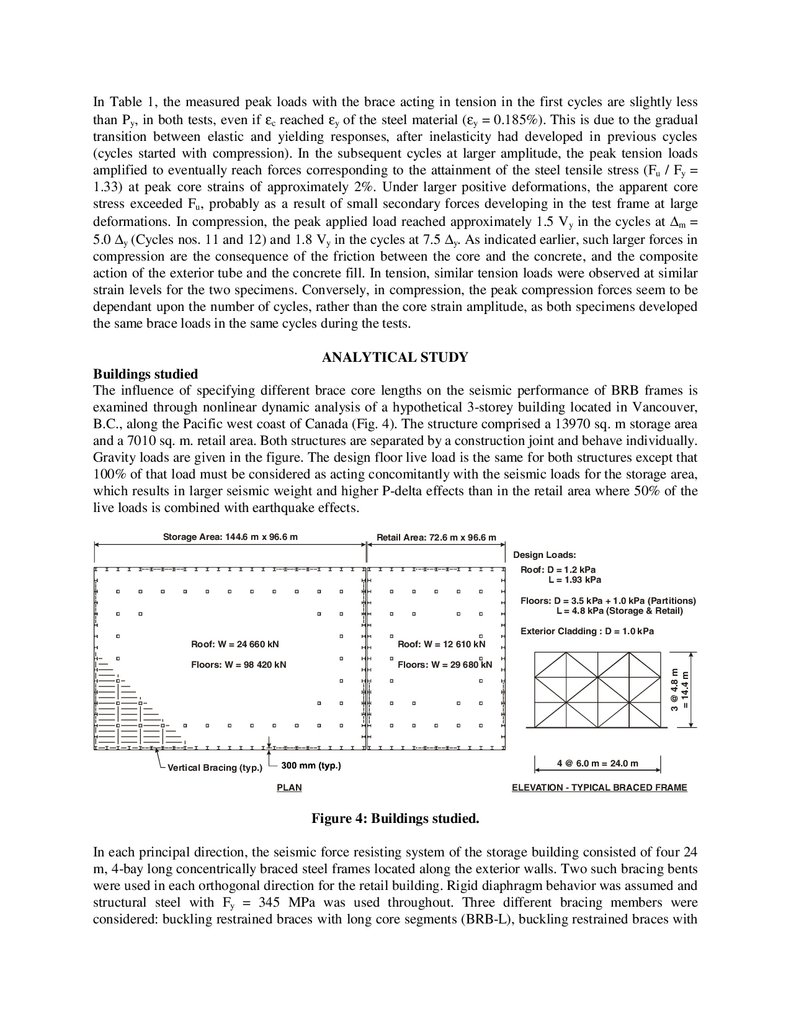
Table 2 presents the key seismic design parameters and the main characteristics of the three braced
frames. For the BRB structures, the calculated fundamental periods were longer than the upper limit for Ta
(0.72 s), even when the short core segments were specified, and that period was used to determine the
seismic loads. The BRB frames with the long core braces thus possessed approximately 30% extra lateral
capacity compared to the short core system due to the differences between design and actual periods: S
(0.90 s) / S(0.72 s) = 1.30. For the CBF system, braces were designed for compression assuming an
effective length factor of 0.9. This resulted in stiffer structures with shorter periods which, when
combined to the higher Rd factor, resulted in design seismic loads (V/W) approximately 60% larger than
for the BRB frames. Note that in design Ta was determined with simplified analytical method, which
explains the slight difference between Ta and T1 at the bottom of the table, the latter being determined
with eigenvalue analysis after completion of the design. Brace forces due to gravity loads were considered
in the brace design and the selected brace dimensions are given in Table 2. For the CBF system, the brace
slenderness varied between 59 and 103 for the storage building and between 70 and 101 for the retail
area.
Table 2: Building properties and design parameters
BRB-L
Parameter
Ta (s)
V/W
Brace 3
Brace 2
Brace 1
∆3/hs (%)
∆2/hs (%)
∆1/hs (%)
∆sep/hn (%)
εc3 (%)
εc2 (%)
εc1 (%)
T1 (s)
T2 (s)
Storage
0.72
0.10
PL13x143
PL19x246
PL25x253
1.20
1.40
1.25
0.66
0.79
0.77
0.89
0.34
Retail
0.72
0.10
PL13x120
PL19x161
PL25x159
1.26
1.42
1.29
1.84
0.70
0.82
0.80
0.92
0.41
BRB-S
Storage
0.72
0.10
PL13x143
PL19x246
PL25x253
0.82
0.95
0.80
CBF
Retail
0.72
0.10
PL13x120
PL19x161
PL25x159
0.85
0.96
0.84
1.23
1.52
1.92
1.86
0.73
0.32
1.65
2.00
1.95
0.76
0.33
Storage
Retail
0.57
0.56
0.16
0.16
HSS178x13 HSS178x10
HSS254x13 HSS203x13
HSS254x16 HSS254x13
0.39
0.46
0.68
0.61
0.67
0.66
0.82
0.58
0.58
0.24
0.24
9.
In NBCC 2005, lateral deformations under the design seismic load must be multiplied by RoRd/IE to giverealistic estimates of the anticipated deflections, including inelastic response effects. For buildings of the
normal importance category (IE = 1.0), storey drifts so computed must be limited to 0.025 hs. The total
anticipated storey drifts, as normalized with respect to storey height hs, are given in Table 2. The limit is
met in all cases. Reducing Lc from 5884 mm to 1300 mm permitted to reduce the deflections of the BRB
frames by approximately 30%. However, the anticipated drifts for the CBF system remained lower than
such reduced values. In the 2005 NBCC, the minimum separation between adjacent structures, ∆sep, is
equal to the square root of the sum of the squares of the individual anticipated deflections determined for
each building. This calculation was performed for each of the systems and the required ∆sep at the roof
level is given in Table 2. Again, the required net distance is smaller for the CBF system. For the BRB
members, the peak strain demand on the brace cores, εc, is determined from the anticipated total
elongation of the equivalent brace, δe (= RdRo/Ie times the brace deformation under design seismic loads):
1
1 1
ε c = δ e − P
−
K e K c L c
[3]
, where P is the anticipated brace load at maximum deformation, Ke = EAe/Lw, and Kc = EAc/Lc. The
second term in brackets corresponds to the brace elastic deformation outside of the core segment and P is
taken as equal to AcRyieldRshFy in this calculation. The stiffness ratios Ke/Kc = 0.90 and 0.31 for Lc = 5884
and 1300 mm, respectively. As indicated, peak strains in short core braces are approximately 2.4 times
higher than those predicted in the long core braces, in spite of the fact that they result from smaller storey
drifts. The length of the short brace core was adjusted to limit the strain demand to 2%.
910
2140
BRBF
(Long core)
2930
2930
3220
V = 9 600
820
2350 2140
3220 2930
5680
6930
6260 6930
6260
V = 20 600
3220
R 3 = 100
R 5 = 3910
570 3120
CBF
910
1030 5680
1260 6930
R 3 = 2240
1840
6260
R 5 = 8610
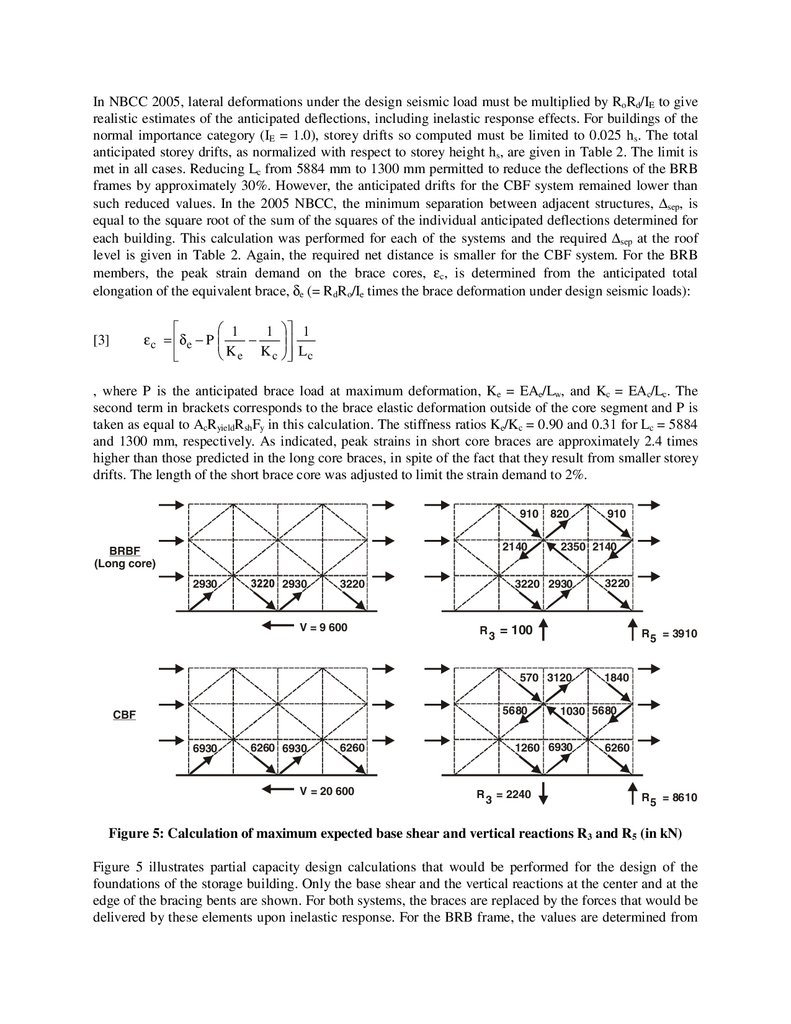
Figure 5: Calculation of maximum expected base shear and vertical reactions R3 and R5 (in kN)
Figure 5 illustrates partial capacity design calculations that would be performed for the design of the
foundations of the storage building. Only the base shear and the vertical reactions at the center and at the
edge of the bracing bents are shown. For both systems, the braces are replaced by the forces that would be
delivered by these elements upon inelastic response. For the BRB frame, the values are determined from
10.
the test results and the anticipated strain levels for Lc = 5884 mm. The peak tension load was determinedusing an axial core stress of 1.2 RyieldFy, the factor 1.2 representing strain hardening at strains of up to 1%,
as per Table 1. In compression, the brace design load was increased by an additional 10% to account for
friction between the core and the buckling restraining mechanism. For the CBF system, the maximum
brace tension load is based on a stress equal to 1.1 RyieldFy, the factor 1.1 being added to CSA-S16
requirements to account for strain hardening (Tremblay [14]). For compression, the resistance at first
buckling (= 1.2 times the unfactored resistance with RyieldFy) is used for the base shear and the reaction R5.
For R3, the post-buckling brace strength, taken equal to 0.2ARyieldFy is used, as it produces higher
compression in the central column. In design, gravity load effects must be added to the forces shown.
These simple calculations clearly show that significant cost savings can be achieved by adopting BRB
frames, the induced reactions for this system being much lower than for the conventional CBF design.
Analytical modeling
Nonlinear dynamic analyses of the three building designs were performed to examine their seismic
performance. In addition, for the BRB frames, two sets of analyses were carried out with two different
brace hysteretic models to examine the influence of modeling assumptions. In all cases, a 2D analytical
model was used that included one bracing bent of the storage building and one bracing bent of the retail
building, arranged side by side. Each bracing bent was assigned its tributary seismic mass, excluding
accidental torsional effects. The model also included all gravity columns being laterally braced by each
bracing bent. For each braced frame and its tributary gravity columns, the nodes at a given floor were
constrained to experience the same horizontal displacements, assuming rigid diaphragm response. All
columns were of the same cross-section and continuous over the building height. A constant acceleration
integration scheme with constant time step of 0.0005 s was adopted. P-delta effects were included with
concomitant gravity loads of D + 1.0 L for the storage building and D + 0.5 L for the retail area. Rayleigh
damping with 3% critical damping in modes 1 and 4 of the 2-building model was considered.
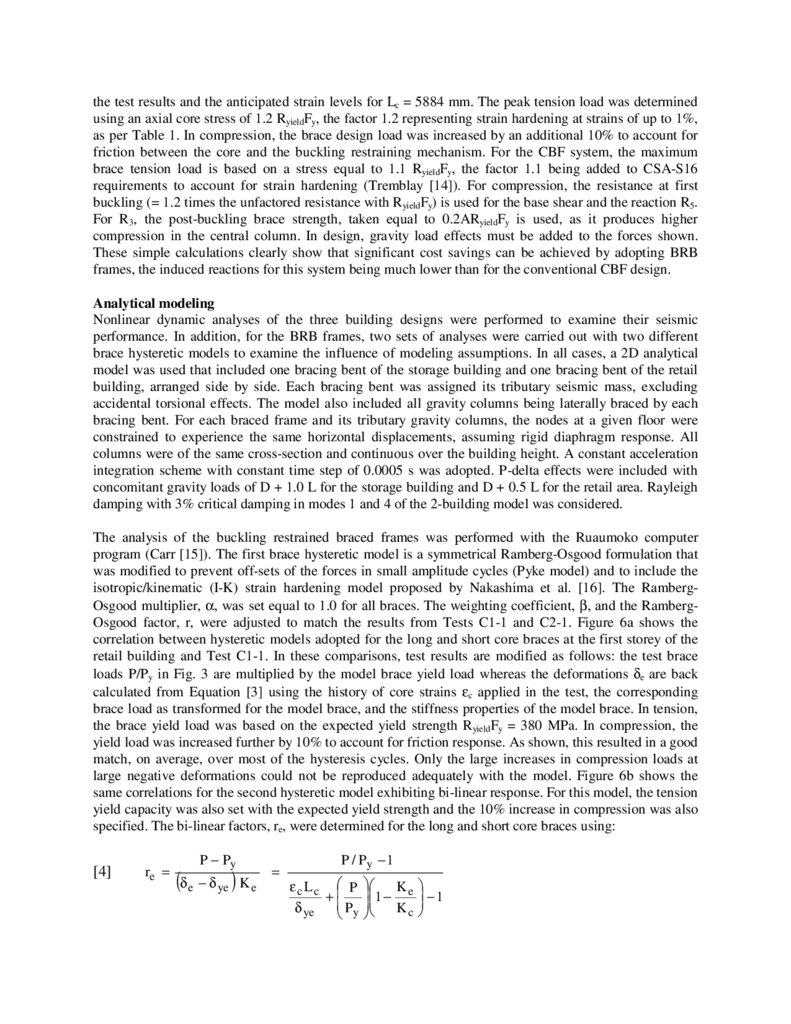
The analysis of the buckling restrained braced frames was performed with the Ruaumoko computer
program (Carr [15]). The first brace hysteretic model is a symmetrical Ramberg-Osgood formulation that
was modified to prevent off-sets of the forces in small amplitude cycles (Pyke model) and to include the
isotropic/kinematic (I-K) strain hardening model proposed by Nakashima et al. [16]. The RambergOsgood multiplier, α, was set equal to 1.0 for all braces. The weighting coefficient, β, and the RambergOsgood factor, r, were adjusted to match the results from Tests C1-1 and C2-1. Figure 6a shows the
correlation between hysteretic models adopted for the long and short core braces at the first storey of the
retail building and Test C1-1. In these comparisons, test results are modified as follows: the test brace
loads P/Py in Fig. 3 are multiplied by the model brace yield load whereas the deformations δe are back
calculated from Equation [3] using the history of core strains εc applied in the test, the corresponding
brace load as transformed for the model brace, and the stiffness properties of the model brace. In tension,
the brace yield load was based on the expected yield strength RyieldFy = 380 MPa. In compression, the
yield load was increased further by 10% to account for friction response. As shown, this resulted in a good
match, on average, over most of the hysteresis cycles. Only the large increases in compression loads at
large negative deformations could not be reproduced adequately with the model. Figure 6b shows the
same correlations for the second hysteretic model exhibiting bi-linear response. For this model, the tension
yield capacity was also set with the expected yield strength and the 10% increase in compression was also
specified. The bi-linear factors, re, were determined for the long and short core braces using:
[4]
re =
P − Py
(δ e − δ ye ) K e
=
P / Py − 1
ε c L c P
+
Py
δ ye
1 − K e − 1
K c
11.
In this equation, δye is the deformation at yield for the equivalent brace element (= Py/Ke), and the re valueswere set such that P/Py reached a value of 1.3 at a core strain of 2%, as observed in tension in the tests
(Table 1). This is confirmed in Fig. 6b by the good match in capacity between the test and the model at
maximum positive deformation attained in Test C1-1. As shown, this simple bi-linear representation
underestimates the actual brace capacity in the small deformation range, and the large increases in brace
compression resistance could not be captured either by the model.
a)
3000
1000
2000
P (kN)
P (kN)
2000
3000
Lc = 5084 mm
β = 0.6
r = 15
0
-1000
-2000
1000
Lc = 1300 mm
β = 0.85
r = 14
0
-1000
-2000
Test C1-1
Test C1-1
-3000
-3000
-150 -100 -50
b)
50
100 150
-50 -40 -30 -20 -10 0
10 20 30 40 50
δ (mm)
3000
2000
3000
Lc = 5084 mm
r e = 0.0347
2000
1000
P (kN)
P (kN)
0
δ (mm)
0
-1000
-2000
Lc = 1300 mm
re = 0.0956
1000
0
-1000
-2000
Test C1-1
-3000
-150 -100 -50
50
100 150
0.5
Test
Model
HSS 102 x 76 x 6.4
Fy = 422 MPa
KL/r = 113
1.0
0.5
P / Py
1.0
P / Py
0
δ (mm)
c)
Test C1-1
-3000
0.0
-0.5
-1.0
-1.0
0
δ / δy
2
4
6
8
10
10 20 30 40 50
δ (mm)
HSS 152 x 152 x 8.0
Fy = 442 MPa
KL/r = 53
0.0
-0.5
-10 -8 -6 -4 -2
-50 -40 -30 -20 -10 0
-10 -8 -6 -4 -2
0
2
4
6
8 10
δ / δy
Figure 6: Brace models: a) I-K Ramberg-Osgood model of Level 1 braces in the retail building;
b) Bi-linear model of Level 1 braces in the retail building; c) Calibration of the Ikeda brace model
against test data for two brace slenderness ratios.
For the CBF structures, the Drain-2DX computer program [17] was used with the physical hysteretic brace
model by Ikeda and Mahin [18]. The parameters of the brace models were adjusted to obtain a good
correlation with past test results obtained for two braces having the maximum and the minimum
slenderness used in the buildings. The correlation is shown in Fig. 6c for these two braces. The measured
tension capacity upon yielding could be reproduced adequately specifying 1.05 times the steel yield
strength measured in the tests and by using 2% strain hardening. In the building models, the brace yield
strength was therefore determined with 1.05RyieldFy. An effective length factor of 0.9 was also specified.
12.
The structures were subjected to an earthquake record ensemble that included four simulated and sixhistorical ground motion time histories produced by intra-plate seismic events matching the two dominant
magnitude-hypocentral distance scenarios for the Vancouver region: M6.5 at 30 km and M7.2 at 70 km.
This ground motion ensemble is described in [19].
Analysis results
Building performance
Table 3 presents the mean + one standard deviation (M+SD) values of the peak storey drifts at each level,
peak core strains at each level, peak roof lateral deformations, and peak relative roof deformations (∆sep).
Values in brackets are for the bi-linear BRB brace model and will be discussed later.
Table 3: Mean+SD value of peak response parameters
Parameter
∆3/hs (%)
∆2/hs (%)
∆1/hs (%)
εc3 (%)
εc2 (%)
εc1 (%)
∆roof /hn
∆sep/hn
BRB-L
Storage
Retail
0.86 (0.92)
1.04 (1.11)
1.38 (1.25)
1.50 (1.24)
1.97 (1.59)
2.15 (1.69)
0.53 (0.57)
0.64 (0.69)
0.87 (0.78)
0.95 (0.78)
1.27 (1.01)
1.37 (1.07)
1.29 (1.01)
1.43 (1.11)
0.33 (0.36)
BRB-S
Storage
Retail
0.74 (0.63)
0.79 (0.67)
0.96 (0.92)
0.93 (0.88)
1.61 (1.37)
1.67 (1.39)
1.72 (1.27)
1.81 (1.38)
2.33 (2.09)
2.22 (1.99)
4.21 (3.36)
4.40 (3.41)
0.88 (0.81)
0.91 (0.83)
0.23 (0.19)
CBF
Storage
0.37
0.70
1.44
0.63
Retail
0.62
1.39
0.94
0.73
0.42
Table 4: Peak roof drift angle to first storey drift angle ratios
Parameter
(∆roof/ hn)/(∆1/hs)
Mean
Maximum
Roof drift ratio
Mean
Maximum
BRB-L
Storage
Retail
BRB-S
Storage
Retail
CBF
Storage
Retail
1.52
2.29
1.43
2.13
1.63
2.35
1.75
2.27
1.87
2.70
1.42
2.13
0.32
0.77
0.32
0.78
0.26
0.57
0.25
0.57
0.24
0.44
0.23
0.50
The peak storey drifts for all systems are less than the 2.5% hs code limit. On average, the storey drifts
obtained for the BRB frames do correspond to the anticipated values, but larger storey drifts, in excess of
the anticipated RdRo∆ values, developed at the first floor while the demand at the topmost floor was lower
than expected. The same trends are observed for the CBF system. For the CBF retail building, large storey
drift (2.6% hs) developed at the 2nd floor under a single record, leading to the higher M+SD value in Table
3. Table 4 presents statistics of the ratio of the peak roof drift angle (∆roof/hn) to the peak storey drift angle
at first floor (∆1/hs). As shown, the mean values are typically above 1.5 with maximum values well in
excess of 2.0, confirming the concentration of inelastic demand in the bottom floor. The phenomenon
appears to be relatively more pronounced for the BRB frames with shorter core length and the CBF
structures. Core strains in BRB members follow the same trends with M+SD values at Level 1 typically
1.5 and 2.2 times greater than the predictions for the long and short brace cores, respectively. For the
shorter core braces, that concentration is more pronounced than expected from storey drift results. This is
because core strains increase at a higher rate than storey drifts when a shortened brace core segment is
13.
used. Variations in storey drifts then produce amplified variations in core strain values, which suggeststhat plastic demand in short core braces is more sensitive to scatter in results and, thus more difficult to
predict with accuracy. Table 3 also shows that the building separation required between adjacent BRB
frames with nearly same vibration periods is less than 20% of the NBCC specifications (Table 2).
Reducing brace core length had a positive impact on that parameter. For the CBF system, the M+SD
building separation is approximately 50% of the NBCC recommended value.
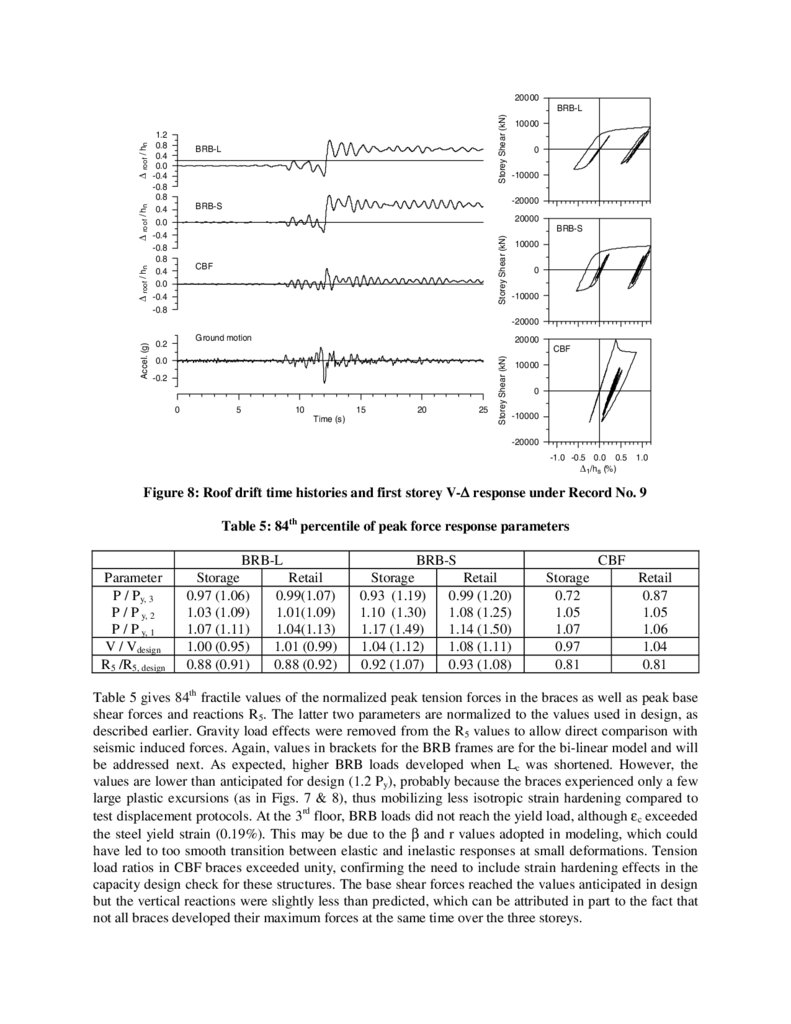
20000
Storey Shear (kN)
BRB-L
roof
∆
∆ roof / h n
BRB-L
0
-10000
-20000
BRB-S
20000
0.0
-0.4
-0.8
0.8
0.4
0.0
BRB-S
Storey Shear (kN)
-0.8
0.8
0.4
roof
∆
0.4
0.0
-0.4
/ hn
/ hn
0.8
10000
CBF
-0.4
-0.8
10000
0
-10000
0.2
.
20000
CBF
0.0
-0.2
0
5
10
15
Time (s)
20
25
Storey Shear (kN)
Accel. (g)
-20000
Ground motion
10000
0
-10000
-20000
-1.0 -0.5 0.0 0.5
∆ 1/hs (%)
1.0
Figure 7: Roof drift time histories and first storey V-∆ response under Record No. 8
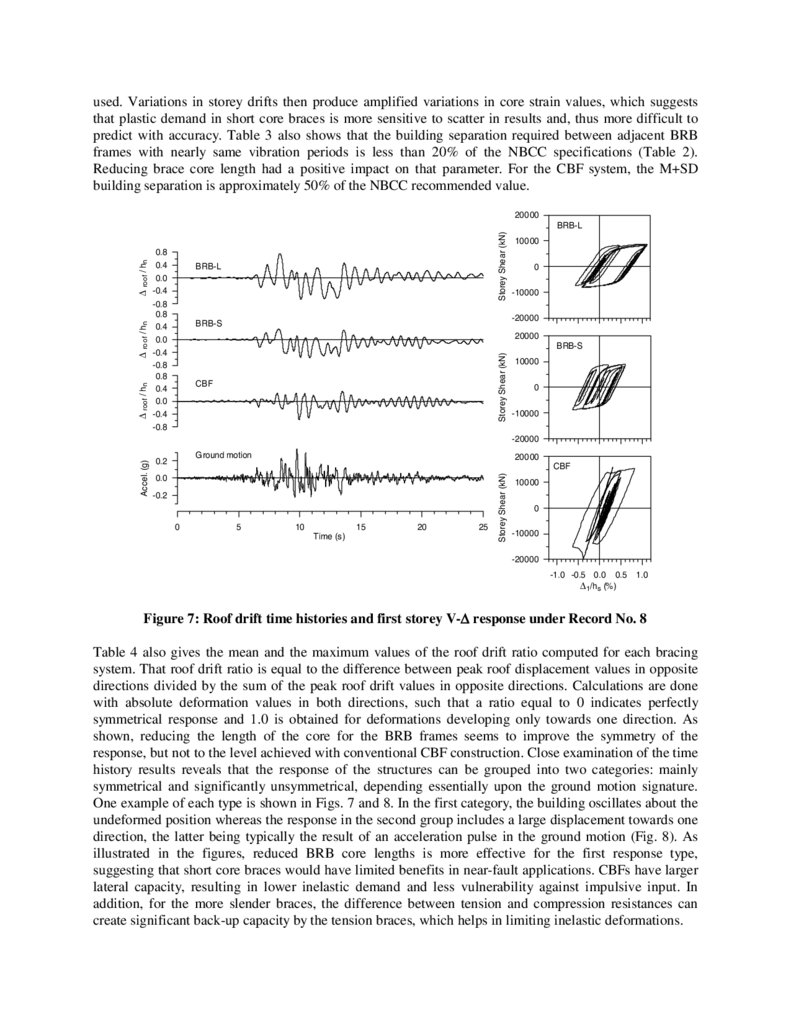
Table 4 also gives the mean and the maximum values of the roof drift ratio computed for each bracing
system. That roof drift ratio is equal to the difference between peak roof displacement values in opposite
directions divided by the sum of the peak roof drift values in opposite directions. Calculations are done
with absolute deformation values in both directions, such that a ratio equal to 0 indicates perfectly
symmetrical response and 1.0 is obtained for deformations developing only towards one direction. As
shown, reducing the length of the core for the BRB frames seems to improve the symmetry of the
response, but not to the level achieved with conventional CBF construction. Close examination of the time
history results reveals that the response of the structures can be grouped into two categories: mainly
symmetrical and significantly unsymmetrical, depending essentially upon the ground motion signature.
One example of each type is shown in Figs. 7 and 8. In the first category, the building oscillates about the
undeformed position whereas the response in the second group includes a large displacement towards one
direction, the latter being typically the result of an acceleration pulse in the ground motion (Fig. 8). As
illustrated in the figures, reduced BRB core lengths is more effective for the first response type,
suggesting that short core braces would have limited benefits in near-fault applications. CBFs have larger
lateral capacity, resulting in lower inelastic demand and less vulnerability against impulsive input. In
addition, for the more slender braces, the difference between tension and compression resistances can
create significant back-up capacity by the tension braces, which helps in limiting inelastic deformations.
14.
20000Storey Shear (kN)
1.2
0.8
0.4
0.0
-0.4
-0.8
0.8
0.4
BRB-L
0
-10000
-20000
BRB-S
20000
0.0
-0.4
-0.8
0.8
0.4
0.0
BRB-S
Storey Shear (kN)
∆ roof / h n
∆
roof
/ hn
∆
roof
/ hn
BRB-L
10000
CBF
-0.4
-0.8
10000
0
-10000
0.2
.
20000
CBF
0.0
-0.2
0
5
10
15
Time (s)
20
25
Storey Shear (kN)
Accel. (g)
-20000
Ground motion
10000
0
-10000
-20000
-1.0 -0.5 0.0 0.5
∆ 1/hs (%)
1.0
Figure 8: Roof drift time histories and first storey V-∆ response under Record No. 9
Table 5: 84th percentile of peak force response parameters
Parameter
P / Py, 3
P / P y, 2
P / P y, 1
V / Vdesign
R5 /R5, design
BRB-L
Storage
Retail
0.97 (1.06)
0.99(1.07)
1.03 (1.09)
1.01(1.09)
1.07 (1.11)
1.04(1.13)
1.00 (0.95)
1.01 (0.99)
0.88 (0.91)
0.88 (0.92)
BRB-S
Storage
Retail
0.93 (1.19)
0.99 (1.20)
1.10 (1.30)
1.08 (1.25)
1.17 (1.49)
1.14 (1.50)
1.04 (1.12)
1.08 (1.11)
0.92 (1.07)
0.93 (1.08)
CBF
Storage
0.72
1.05
1.07
0.97
0.81
Retail
0.87
1.05
1.06
1.04
0.81
Table 5 gives 84th fractile values of the normalized peak tension forces in the braces as well as peak base
shear forces and reactions R5. The latter two parameters are normalized to the values used in design, as
described earlier. Gravity load effects were removed from the R5 values to allow direct comparison with
seismic induced forces. Again, values in brackets for the BRB frames are for the bi-linear model and will
be addressed next. As expected, higher BRB loads developed when Lc was shortened. However, the
values are lower than anticipated for design (1.2 Py), probably because the braces experienced only a few
large plastic excursions (as in Figs. 7 & 8), thus mobilizing less isotropic strain hardening compared to
test displacement protocols. At the 3rd floor, BRB loads did not reach the yield load, although εc exceeded
the steel yield strain (0.19%). This may be due to the β and r values adopted in modeling, which could
have led to too smooth transition between elastic and inelastic responses at small deformations. Tension
load ratios in CBF braces exceeded unity, confirming the need to include strain hardening effects in the
capacity design check for these structures. The base shear forces reached the values anticipated in design
but the vertical reactions were slightly less than predicted, which can be attributed in part to the fact that
not all braces developed their maximum forces at the same time over the three storeys.
15.
Influence of brace modeling assumptionsBi-linear models are more convenient for BRB modeling and they are more readily available in
commercial analysis programs. As shown in Table 3, except at the top floor of the BRB-L frames, the use
of a bi-linear model resulted in 5-20% underestimation of the M+SD storey drifts and core strain demand
for both the long and short braces. Roof deformations and required roof separations were also under
evaluated. Bi-linear models do not include Baushinger effects and, hence, exhibit initial elastic stiffness
over a wider range of deformations. Upon yielding, they also have a constant stiffness, as opposed to
actual BRB members that typically exhibit a flattening yielding response (see Fig. 6). For the BRB-L
frames, the force demand predicted by the bi-linear model compares well with the results from the
Ramberg-Osgoog formulation. For the BRB-S, the forces were overestimated as the strain demand
experienced under the ground motions exceeded the 2% strain value that was used to set the stiffness
upon brace yielding, and unrealistic forces are determined using that stiffness for values of εc beyond 2%.
CONCLUSIONS
The results of two sub-assemblage tests indicated that properly detailed and fabricated buckling restrained
braces with core plates made from steel with enhanced toughness properties possess residual low-cycle
fracture life capacity after the application of a qualifying seismic test protocol with cyclic core strain
deformations of up to 3.5%. The design of a sample three-storey buildings showed that storey drifts can be
reduced by specifying BRB members with shorter core dimensions, but this results in higher strain
demand imposed on the brace cores. The example also showed that the design forces for capacity
protected elements can be reduced significantly when adopting BRB frames compared to conventional
CBF structures. Nonlinear dynamic analysis of the buildings studied confirmed these findings, indicating
that low-rise BRB frames designed according to NBCC 2005 provisions with Rd = 4.0 can exhibit
satisfactory seismic performance. The results clearly indicated, however, that the inelastic demand tends
to concentrate at the bottom floor, resulting in core strain demand exceeding the design values, especially
when short brace cores are specified. M+SD values of the computed-to-predicted ratios for the core strain
were respectively 1.5 and 2.2 for the long and short core braces studied, and provisions must be made at
the design stage for such higher demand.
The nonlinear dynamic analyses also demonstrated that conventional CBF structures can experience
smaller lateral deformations compared to BRB frames, but similar drift amplification at the lower floor
was observed and much larger forces were imposed on the surrounding structural elements. These forces
can be well predicted for both the BRBF and the CBF systems using appropriate capacity design rules
accounting for the expected sources of overstrength, including actual to nominal material property ratios,
strain hardening response, and friction behavior for BRB members. When calibrating analytical model
properties against BRB test results, caution should be exercised not to overestimate strain hardening
contribution as the significant isotropic strain hardening that develops under typical test protocols may not
be fully mobilized under actual seismic response. In this study, the deformation and strain demand were
also found to be generally underestimated, while brace forces were overestimated for short core braces,
when simple bi-linear modeling was adopted for reproducing BRB hysteretic response.
ACKNOWLEDMENTS
This project was supported by the Natural Sciences and Engineering Research Council of Canada and
Read Jones Christoffersen, Ltd., from Vancouver, BC. George Third and Sons, from Burnaby, BC,
fabricated the brace specimens. The authors wish to express their appreciation to David Pearce and Benoit
Turcotte, undergraduate research assistants, and to the technical staff of the Structural Engineering
Laboratory at Ecole Polytechnique for their invaluable assistance.
16.
REFERENCES1.
2.
3.
4.
5.
6.
7.
8.
9.
10.
11.
12.
13.
14.
15.
16.
17.
18.
19.
View publication stats
Watanabe, A., Hitomi Y., Saeki, E., Wada, A., and Fujimoto, M. “Properties of Brace Encased in
Buckling-Restraining Concrete and Steel Tube.” Proc. 9th World Conference on Earthquake
Engineering, Tokyo-Kyoto, Japan, Vol. IV: 719-724, 1988.
Saeki, E., Maeda, Y., Nakamura, H., Midorikawa, M., and Wada, A. “Experimental Study on
Practical-Scale Unbonded Braces.” J. Struct. Constr. Eng., AIJ, 1995; 476: 149-158 (In Japanese).
Maeda, Y., Nakata, Y., Iwata, M., and Wada, A. “Fatigue Properties of Axial-Yield type Hysteresis
Dampers.” J. Struct. and Constr. Eng., AIJ, 1998; 503: 109-115. (In Japanese)
Ko, E., Mole, A., Aiken, I., Tajirian, F., Rubel, Z., and Kimura, I. “Application of the Unbonded
Brace in Medical Facilities.” Proc. of the 7th U.S Nat. Conf. on Earthquake Eng., Boston, MA, Paper
No. 514, 2002.
Iwata, M., Kato, T., and Wada, A. “Buckling-Restrained Braces as Hysteretic Dampers.” Proc.
STESSA 2000 Conf., 33-38, Montreal, Canada, August 2000. Rotterdam: Balkema, 2000.
Tsai, K.C. and Huang, Y.-C. “Experimental Responses of Large Scale Buckling Restrained Braced
Frames.” Report No. CEER R91-03, National Taiwan University, Tai-Pei, Taiwan, 2002.
SIE. “Tests on Nippon Steel Corporation Unbonded Braces – UC Davis Plant & Environmental
Sciences Building.” Report to Ove Arup & Partners California, Seismic Isolation Engineering, Inc.,
Oakland, CA, 1999.
Heidebrecht, A.C. “Overview of Seismic Provisions of the Proposed 2005 Edition of the National
Building Code of Canada.” Can. J. of Civ. Eng. 2003; 30(2): 241-254.
Bolduc. P. and Tremblay, R. “Experimental Study of the Seismic Behaviour of Steel Braces with
Concrete Filled Tube and Double Steel Tube Buckling Restrained Mechanisms.” Report No. EPMGCS-2003-01, Dept. of Civil, Geological and Mining Eng., Ecole Polytechnique, Montreal, Canada,
2003.
Sabelli, R. “Research on Improving the Design and Analysis of Earthquake-Resistant Steel-Braced
Frames.” EERI/FEMA NEHRP Fellowship Report No. PF2000-9, Oakland, CA, 2001.
Chen, C.-C., Chen, S.-Y., and Liaw, J.-J. “Application of Low Yield Strength Steel on Controlled
Plastification Ductile Concentrically Braced Frames.” Can. J. of Civ. Eng. 2001; 28(5): 823-836.
CSA. “Limit states design of steel structures, CSA-S16-01.” Canadian Standards Association,
Rexdale, ON, 2001.
Mitchell, D., Tremblay, R., Karacabeyli, E., Paultre, P., Saatcioglu, M., and Anderson, D. “Seismic
Force Modification Factors for the Proposed 2005 NBCC.” Can. J. of Civ. Eng. 2003; 30(2): 308327.
Tremblay, R. “Inelastic Seismic Response of Bracing Members.” J. of Const. Steel Research 2002;
58: 665-701.
Carr, A.J. “RUAOMOKO, Inelastic Dynamic Analysis Program.” Dept. of Civil Eng., University of
Canterbury, NZ, 2002.
Nakashima, M., Akazawa, T., and Tsuji, B. “Strain-hardening behavior of shear panels made of
low-yield steel. II: Model.” ASCE Journal of Structural Engineering 1995; 121(12):1750-1757.
Prakash V, Powell GH. “DRAIN-2DX, DRAIN-3DX and DRAIN-BUILDING: Base program
design documentation.” Report UCB/SEMM-93/16, Department of Civil Engineering, University of
California, Berkeley, Ca, 1993.
Ikeda, K. and Mahin, S.A. “A Refined Physical Theory Model for Predicting the Seismic Behavior
of Braced Steel Frames.” Report No. UCB/EERC-84/12, College of Eng., University of California,
Berkely, CA, 1984.
Poncet, L. and Tremblay, R. “Seismic Performance of Multi-Storey Concentrically Braced Steel
Frames with Mass Irregularity.” Proc. 13th World Conference on Earthquake Engineering,
Vancouver, Canada, Paper No. 2896, 2004.