")


")


 Transitional Stage")

")
 Industrial Stage")
 Early Postindustrial")
 Late Postindustrial")


 География
Похожие презентации:


World demography (natural and mechanical movement of population)
1. World demography (natural and mechanical movement of population)
I.B.Sarsenova2. World Population: Growth & Trends
World Population: Growth & Trends3. What’s demography?
The quantitative study of human populations.Demographers study subjects such as the
geographical distribution of people, birth and
death rates, socioeconomic status, and age
and sex distributions in order to identify the
influences on population growth, structure,
and development.
4. Natural movement of population
Rate birth, death and natural growth5. Mechanical movement of population Human migration is the movement by people from one place to another with the intentions of
settling, permanently or temporarily in a new location.Migration of population
M = N of I – N of E
6. Take away concepts
Why is population growth so central to environmental problems?What is the current population? What will it be in 2050?
What factors affect population growth rates?
How do growth rate compare in developed vs. developing
countries?
What is a "demographic transition? What are its stages?
Interpreting Population Pyramids.
Understanding modern demographic trends.
7. Why Population is so important
Thomas Malthus (1798)Organism populations increase
exponentially, whereas the
“environment” is “fixed”
(actually decreases).
Factually correct, but a
complex problem...
Modern example: high
populations AND high quality
of life
8. Maltus’ 1st Axiom
“The power of population is indefinitely greater than the power in the earth toproduce subsistence for man.”
“Population, when unchecked, increases in a geometrical ratio (exponentially).
Subsistence increases only in an arithmetical ratio (linearly).”
9. World Population: 7.3 billion
As of Sept., 2014World Population (1850-2007)
6
5
4
3
2
1
0
500
1000
1500
Year (AD)
(Super)exponential growth
0
2000
Population (in Billions)
7
10. Some observations...
Pre-19th century growth rateswere ~0.2%/yr
<1 billion people.
Pop. doubled in 300yr.
140 million died of plague: 6th,
14th, and 17th centuries.
Replaced in a few centuries.
Population increased after
Renaissance
Modern era population
explosion: post-1960
11. More...
Population growth after1800’s ranged 1.2-1.9%!
Super-exponential
growth
Post-1960 was first time
EVER that population
doubled within a
generation
12. Likely population by 2050: 9 billion
13. Toward “logistic growth”
Levels offeventually
population
time
14. Factors affecting Growth Rate
Growth rate = Birth Rate - Death Rate1.1% = 1.9% - 0.8% (as of 2012)
Of these the Birth Rate is the most important
contributor, specifically the Fertility Rate
(#children/woman)
Why? Because death rates have stabilized...
15. Calculating Growth Rates (r)
Nt = Noexp(r t)where No= pop. at time t, Nt = pop at later time (t), and r is
the growth rate, and t is time in years.
Rearranging to solve for r:
(Nt /No) = exp(r t)
r = ln(Nt/No) / t
Example: with current population of 7 billion, 1%
growth rate = 70 million new people/year.
(equiv. to Turkey or Malaysia)
16. Factors affecting Birth Rate
Global BR = 1.9% (95% in developing countries).Lessons on population control from Thailand, South
Korea, Japan, India, and China:
Invest in Family Planning
Reduce poverty
Elevate the status of women
17. Factors affecting Death Rate
Global DR = 0.8% (equal between developing anddeveloped countries)
Low death rates due to:
medical treatments,
better food supplies and nutrition,
improvements in sanitation, and
access to clean water
Lower DR is the main reason for the global population
increase
18. Population Projections
Current ~7.3 billion (andrising), growth rate:
1.1% (and falling…).
Projected 2050
population: 9 billion
Using modern growth
rate: Calculated pop.
by 2050: ~11 billion.
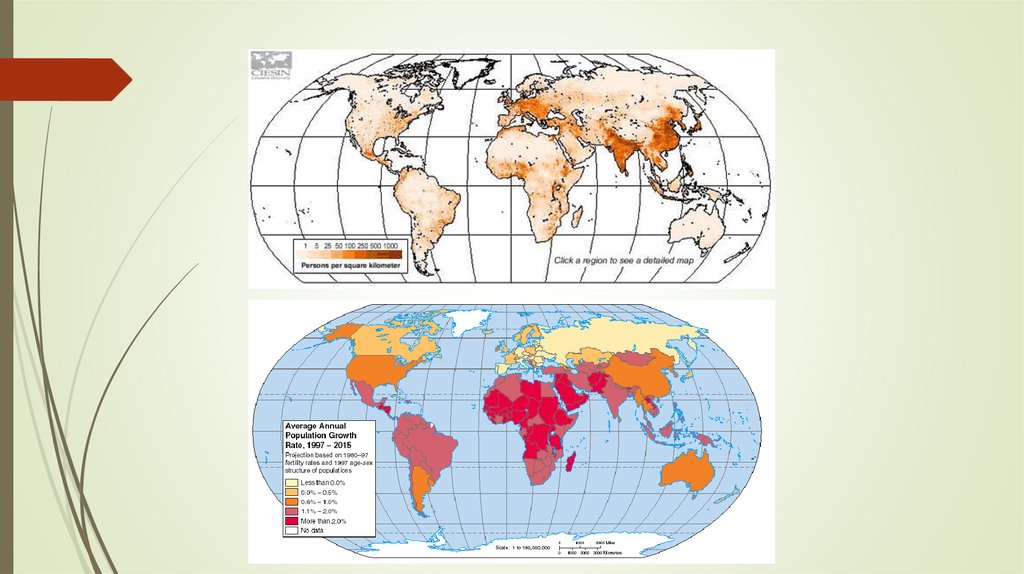
19. Where people live
20. Population growth rates
21.
22. Demographic Transition
Refers to the impact of economic development onbirth and death rates.
Responsible for the gradual reduction in pop growth
rates during the late-20th century
First noted by demographers for changes in 19thcentury Europe, the DT is a critical shift in population
growth and age structures that differentiate
developed nations from developing nations
23. Four stages of DT
1.2.
3.
4.
The Preindustrial Stage when there is little population growth
because harse social conditions lead to both high death and high
birth rates.
The Transitional Stage, when industrialization begins and health
care improves, resulting in lowered death rates, but birth rates
remain high. Most of the developing world here.
The Industrial Stage, when the birth rate drops due to
modernization (and its accompanying social changes). Many
developed countries and a few developing countries here.
Finally, the Postindustrial Stage is recognized by further reductions
in birth rates, approaching or even below zero population growth.
Approximately 13% of the world population (mostly European
countries) is in this stage.
A complete DT exhibits both declining birth and death rates
24. Demographic Transition
When is the period of maximum population growth rate?25. Demographic Transition
Stage 1: Death rates and birth rates both high.Stage 2: Fall in death rates, Population increases.
Stage 3. Decline in birth rate stabilizes population.
Stage 4. Birth and death rates both low,
population stable.
Stage 5 (new). Higher death rates than birth rates,
populations contract.
26. Population Pyramid
AgePopulation in age class
27. 2) Transitional Stage
2.9% growth rate; 4.8 births/woman; 43% population under 15 yrs28. Why is this group so important?
Largest segment of population today..“bottom billion” - world’s poorest
Will be even larger in near future because most of population is under
childbearing age (<15 yrs).
29. Population Momentum (also population lag effect)
Phenomenon that population will continueto grow for decades even after total
fertility rates equal only the replacement
rate...
Due to weighting of age structure towards
the young…
So, work toward zero population growth...
30. 3) Industrial Stage
1.9% growth rate31. 4) Early Postindustrial
0.1% growth rate; 1.8 births/woman; 18% of population under 15 yrs32. 4) Late Postindustrial
-0.1% growth rate; 1.2 births/woman; 14% population under 15 yrs33. Population Pyramids for the four demographic transition phases
34. China’s past and future population pyramid
35. Views from Joel Cohen’s 1995 book “How Many People Can the Earth Support?”
1.Make a bigger pie: Increase human productive
capacities through technology and innovation.
2.
Put fewer forks on the table: Reduce numbers and
expectations of people through such means as
family planning and vegetarian diets.
3.
Teach better manners: Change the terms of
people’s interactions through improved planning
and government to enhance social justice.
36. Global Population Growth Is Driven by Developing Countries.
World Population (in Billions): 1950-2050Source: United Nations Population Division, World Population Prospects: The 2006 Revision.
© 2007
POPULATION
REFERENCE
BUREAU
37. Fertility Levels in Selected World Regions, 1950 and 2005
Children per woman6,7
1950–55
5,9
5,9
2005
5,1
3,5
2,5
2,7
2,6
2,0
Africa
© 2006 POPULATION REFERENCE BUREAU
Asia
Latin
America/
Caribbean
North
America
1,4
Europe
38. An Important Global Issue Is the “Demographic Divide” – The Vast Gulf in Birth and Death Rates Among Countries.
Ethiopia and Germany: The Demographic Divide in 2007ETHIOPIA
GERMANY
Total Population
77.1 million
82.3 million
Population below Age 15
33.0 million
11.9 million
Population Age 65 and Older
2.2 million
15.3 million
Annual Births
3.1 million
672,000
Annual Deaths
1.2 million
821,000
236,000
2,600
49 years
79 years
1.4%
0.1%
Annual Infant Deaths
Life Expectancy at Birth
Percent of Adults Ages 15-49 with HIV/AIDS
Source: Carl Haub, 2007 World Population Data Sheet.
© 2007 POPULATION REFERENCE BUREAU
39. In Many Developing Countries, Fertility Rates Are Stabilizing After Years of Decline.
Fertility Trends in Sub-Saharan Africa: 1980-2005Source: United Nations Population Division and National Demographic and Health Surveys.
© 2007
POPULATION
REFERENCE
BUREAU
40. South Asia and sub-Saharan Africa Have the Highest Shares of Young Children who Are Underweight.
Prevalence of Underweight Children Under Age 5, by CountrySource: Carl Haub, 2007 World Population Data Sheet.
© 2007
POPULATION
REFERENCE
BUREAU
41. Vitamin A and Iron Deficiencies Are Also Prevalent Among Children Under Age 5.
Percent of Children Under Age 5 with Vitamin A and Iron Deficiencies, Selected RegionsSource: Disease Control Priorities Project, “Stunting, Wasting, and Micronutrient Disorders” (2006): Table 28.1.
© 2007
POPULATION
REFERENCE
BUREAU
42. Despite Rising Obesity Levels, Some Households in the United States Do Not Always Have Enough to Eat.
Percent of Households and Children Who Are Food Insecure, United States: 1998-2005Source: U.S. Department of Agriculture, Economic Research Service, Household Food Security in the United States, 2005
(Economic Research Report No.29): Table 1-A.
© 2007
POPULATION
REFERENCE
BUREAU
43. Women in the United States Have More Children on Average Than Women in Europe.
Fertility Trends in Europe and the United States: 1980-2006Source: National statistical agencies.
© 2007
POPULATION
REFERENCE
BUREAU
44. In Many Developing Countries, Fertility Rates Are Stabilizing After Years of Decline.
Fertility Trends in Sub-Saharan Africa: 1980-2005Source: United Nations Population Division and National Demographic and Health Surveys.
© 2007
POPULATION
REFERENCE
BUREAU
45. Older People Are a Smaller Share of the Population in the United States Than in Europe and Japan.
Population Age 65 and Older, by CountrySource: Carl Haub, 2007 World Population Data Sheet.
© 2007
POPULATION
REFERENCE
BUREAU
46. Demographic Impact of HIV/AIDS
Impact on life expectancyHIV infection rates
47. UN Millennium Development Goals
UN Millennium Declaration, Sept. 2000Adopted by 189 countries
By 2015:
1.
2.
3.
4.
5.
6.
7.
8.
Eradicate extreme poverty & hunger
Universal primary education
Gender equality, empower women
Reduce child mortality
Improve maternal health
Combat HIV/AIDS and other diseases
Environmental sustainability
Global partnership for development
48. Religious: world and national Languages – Chinese – 1,2, Arabic – 422, Hindi – 366, English – 341, Spanish – 322, Bengali –
207, Portugal – 176, Russian – 167,Japanese – 125, German – 100.
Official languages of the world – English,
Chinese, Arabic, Spanish, Russian, French