


")


 Английский язык
Похожие презентации:


")
Macroeconomic environment and perspectives in Colombia
1. Macroeconomic environment and perspectives in Colombia
Hernando José GómezMoscow, Oct 11 2016
2.
Table of contents1
International context
2
Where are we coming from – a long term view
3
Macroeconomic, fiscal situation, and perspectives
4
Colombia in the regional context
3.
International Context4.
The United States has consolidated its economic recovery…USA Annual Growth
5
4,1
3,8
4
3,4
2,8
3
2,5
2,7
2,4
2,2
2,4 2,4
2,5
1,8
2
1,8
% 1
1,6
1,5
0,9
0
-0,3
-1
-2
2017
2016
2015
2014
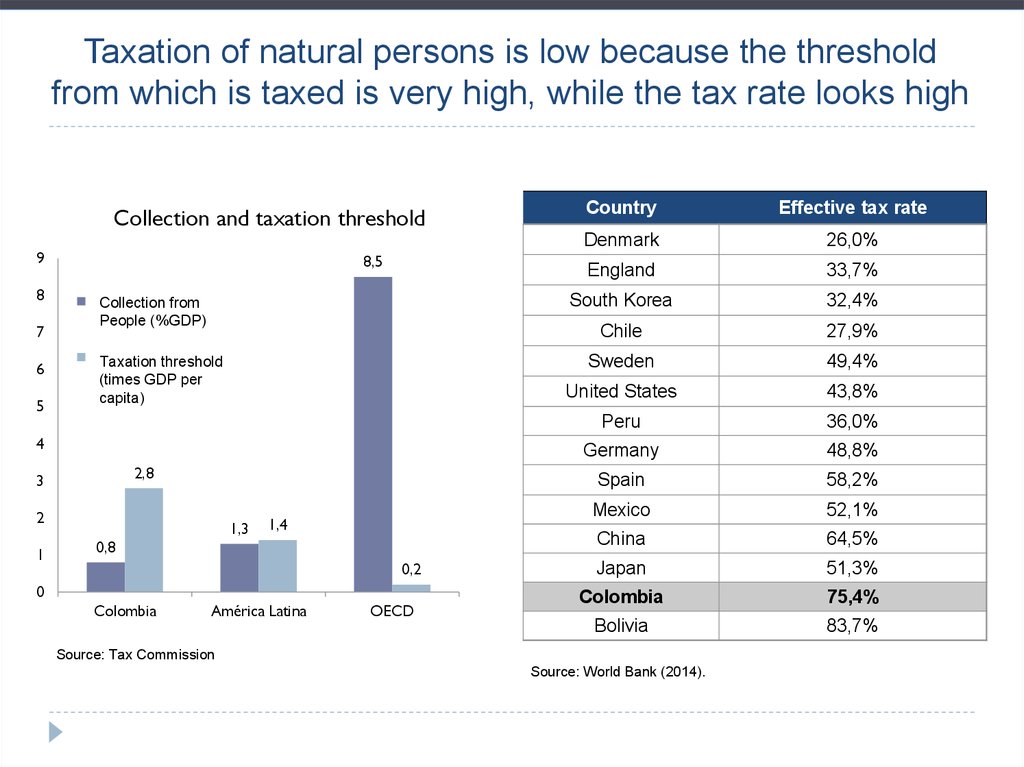
2013
2012
2011
2010
2008
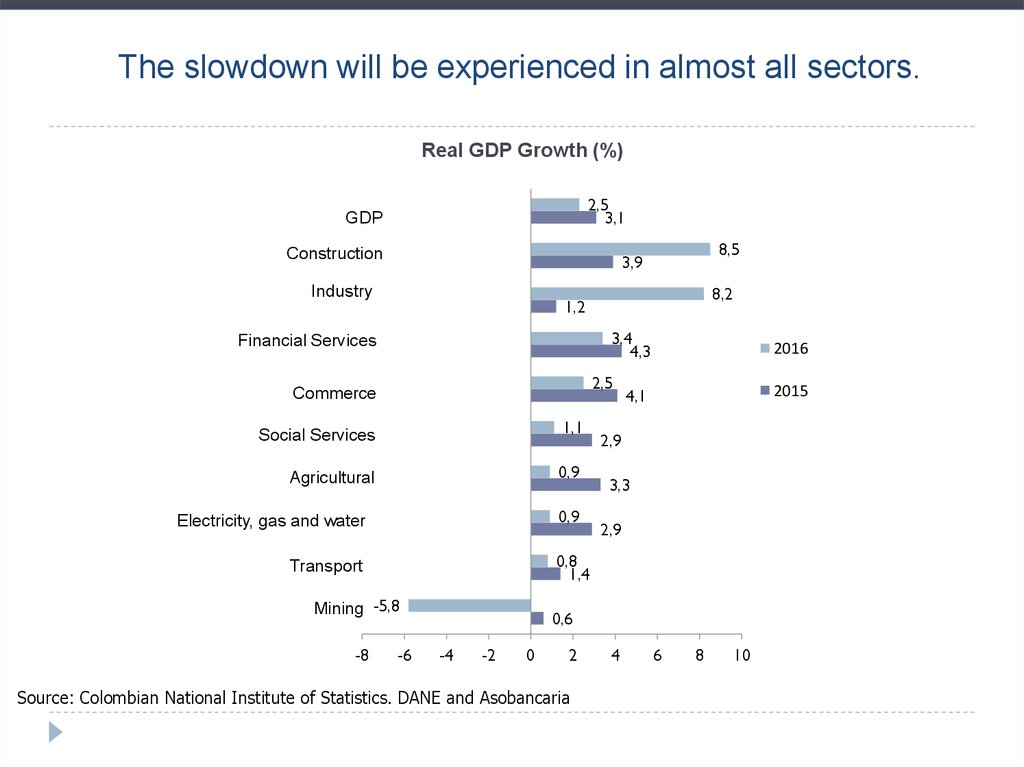
2007
2006
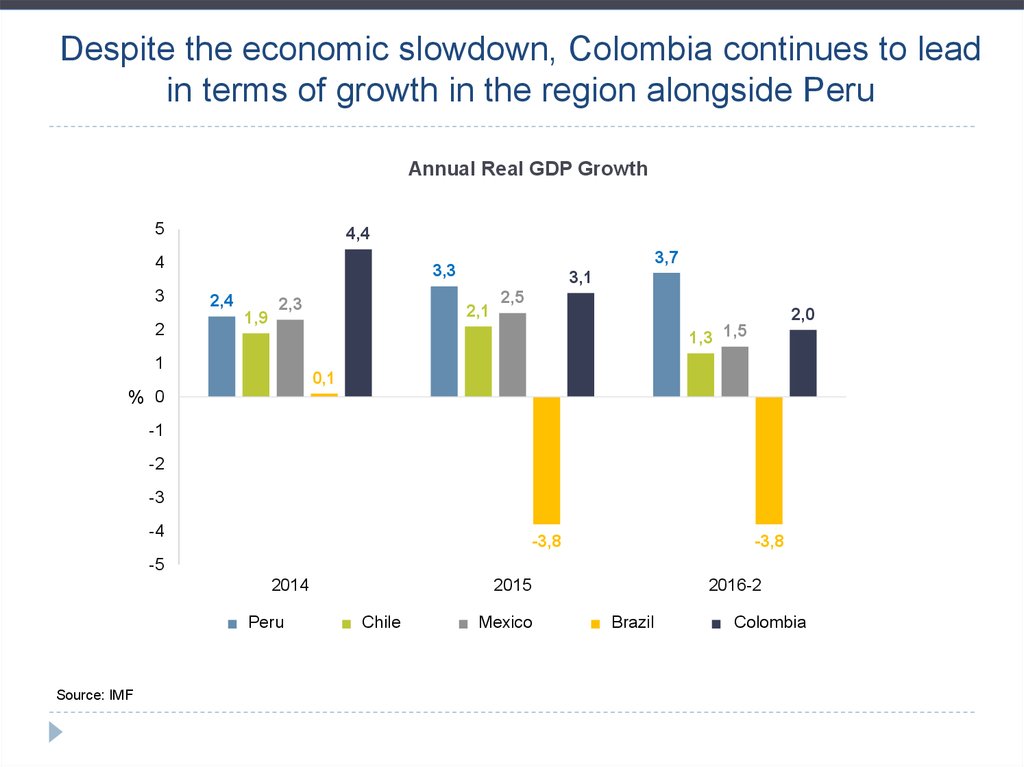
2005
2004
2003
2002
2001
2000
Source: Bureau of Economic Analysis y WEO abril de 2016.
2009
-2,8
-3
5.
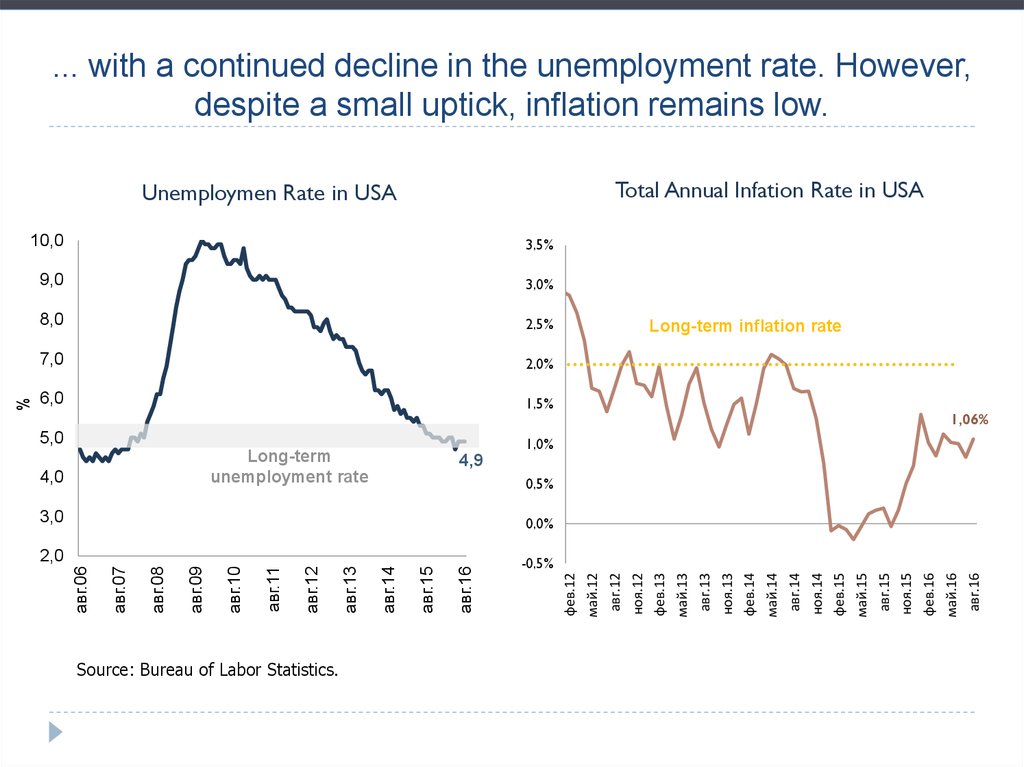
... with a continued decline in the unemployment rate. However,despite a small uptick, inflation remains low.
Total Annual Infation Rate in USA
Unemploymen Rate in USA
3,5%
9,0
3,0%
8,0
2,5%
7,0
2,0%
6,0
1,5%
5,0
4,9
0,5%
авг.16
авг.15
авг.14
авг.13
авг.12
авг.11
авг.10
-0,5%
авг.09
2,0
авг.08
0,0%
авг.07
3,0
Source: Bureau of Labor Statistics.
1,06%
фев.12
май.12
авг.12
ноя.12
фев.13
май.13
авг.13
ноя.13
фев.14
май.14
авг.14
ноя.14
фев.15
май.15
авг.15
ноя.15
фев.16
май.16
авг.16
4,0
Inflación deinflation
Long-term
largo plazo
rate
1,0%
Long-term
unemployment rate
авг.06
%
10,0
6.
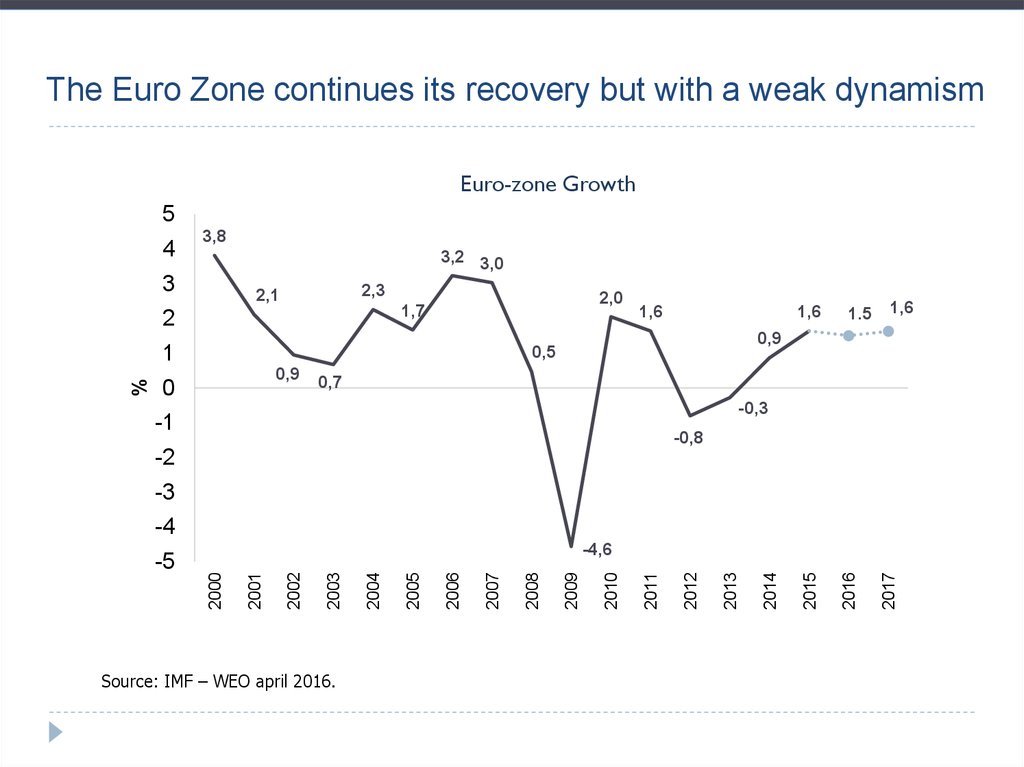
The Euro Zone continues its recovery but with a weak dynamismEuro-zone Growth
5
4
3,8
3,2 3,0
3
2,3
2,1
2,0
1,7
2
%
1
1,6
1,6
0,9
1,6
0,9
0,5
0
1.5
0,7
-0,3
-1
-0,8
-2
-3
-4
Source: IMF – WEO april 2016.
2017
2016
2015
2014
2013
2012
2011
2010
2009
2008
2007
2006
2005
2004
2003
2002
2001
-4,6
2000
-5
7.
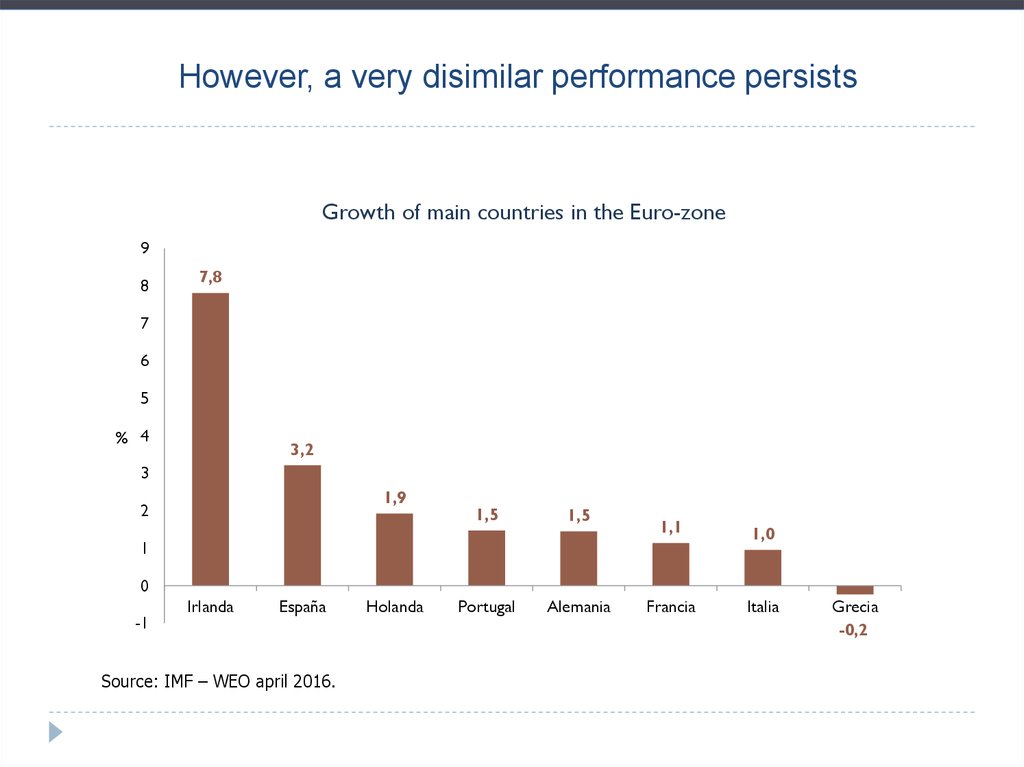
However, a very disimilar performance persistsGrowth of main countries in the Euro-zone
9
8
7,8
7
6
5
% 4
3,2
3
1,9
2
1,5
1,5
Portugal
Alemania
1,1
1,0
Francia
Italia
1
0
-1
Irlanda
España
Source: IMF – WEO april 2016.
Holanda
Grecia
-0,2
8. The measures taken by the ECB have reduced, but not eliminated, the risk of deflation
Annual Inflation on the Euro-zone2,5
2,0
1,5
0,5
0,4
0,2
0,0
-0,1
-0,1
-0,5
-1,0
Euro-zone
Germany
Source: European Central Bank. Official data.
France
Italy
Spain
авг.16
июн.16
апр.16
фев.16
дек.15
окт.15
авг.15
июн.15
апр.15
фев.15
дек.14
окт.14
авг.14
июн.14
апр.14
фев.14
дек.13
окт.13
авг.13
июн.13
-1,5
апр.13
%
1,0
9. As for the emerging world, the fall in commodity prices has been widespread but there has been a slight rebound
Commodities Price Index(Base = 100 Jun 2011)
110
Energy
100
90
Agriculture
80
Precious metals
70
60
Other minerals
50
40
Source: World Bank Commodity Price Data (Pink Sheet).
авг.16
июн.16
апр.16
фев.16
дек.15
окт.15
авг.15
июн.15
апр.15
фев.15
дек.14
окт.14
авг.14
июн.14
апр.14
фев.14
дек.13
окт.13
авг.13
июн.13
апр.13
фев.13
дек.12
окт.12
авг.12
июн.12
апр.12
30
10. ... with an increase in risk perception, despite an important declining from the peak of 506 to 358. In part thanks to the
recovery in developed economiesEmerging Markets Bonds Index –EMBI506,8
Jun-2014
500,0
Basis Points
450,0
400,0
350,0
358,6
300,0
Source: Bloomberg
сен.16
май.16
янв.16
сен.15
май.15
янв.15
сен.14
май.14
янв.14
сен.13
май.13
янв.13
сен.12
май.12
250,0
11. That in turn led to a depreciation of major currencies, with the Colombian peso and Brazilian real the most volatile
Exchange Rate Index (Base 100 = june 2014)180
Jun-2014
160
140
120
100
Source: Bloomberg.
Perú
sep.-16
jul.-16
mar.-16
ene.-16
nov.-15
sep.-15
jul.-15
Brasil
Brazil
may.-16
Chile
mar.-15
ene.-15
nov.-14
sep.-14
jul.-14
México
may.-15
Colombia
may.-14
mar.-14
ene.-14
nov.-13
sep.-13
jul.-13
may.-13
mar.-13
80
12.
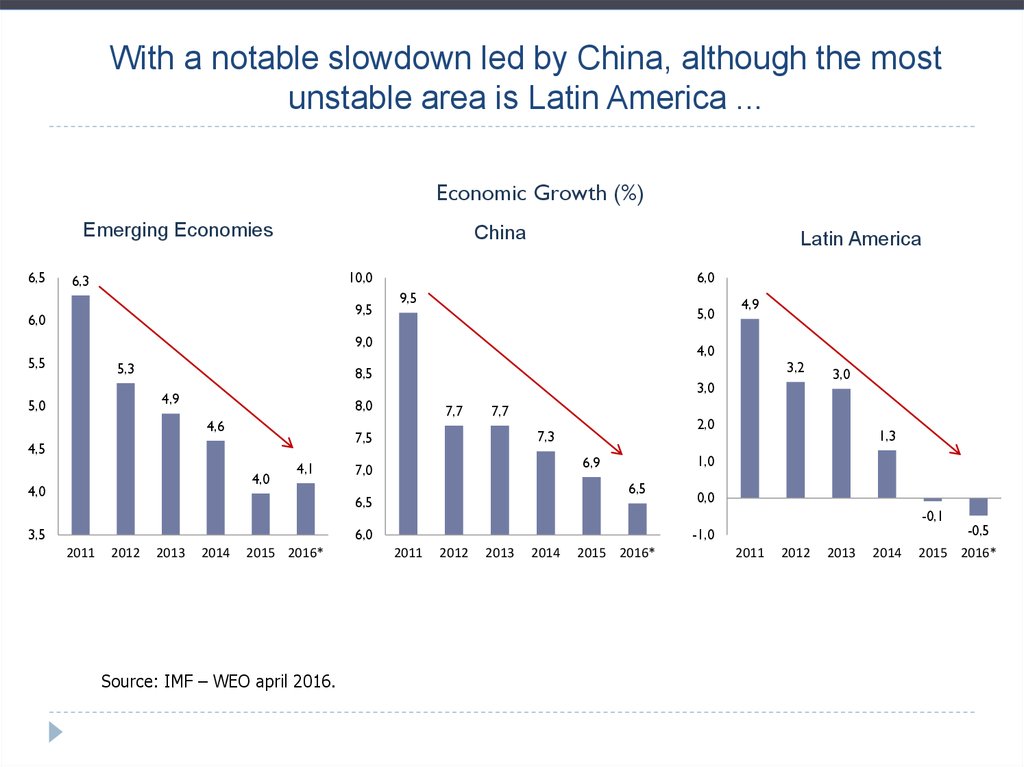
With a notable slowdown led by China, although the mostunstable area is Latin America ...
Economic Growth (%)
Emerging Economies
6,5
China
Latin America
10,0
6,3
9,5
6,0
6,0
9,5
5,0
9,0
5,5
5,3
4,0
3,2
8,5
4,9
5,0
3,0
8,0
4,6
4,0
4,0
7,7
7,7
4,1
6,5
6,5
3,5
2012
2013
2014
2015 2016*
Source: IMF – WEO april 2016.
0,0
-0,1
6,0
2011
1,3
1,0
6,9
7,0
3,0
2,0
7,3
7,5
4,5
4,9
-1,0
2011
2012
2013
2014
2015 2016*
2011
2012
2013
2014
-0,5
2015 2016*
13.
... Where the most affected countries were Venezuela, Brazil andEcuador ...
Economic Growth 2015 (%)
4
3,1
2,5
2,4
2,3
2,3
2
0,4
0
-0,6
%
-2
-3,0
-4
-6
-8
-10
-10,0
Source: FMI.
Venezuela
Brazil
Ecuador
Argentina
Chile
Mexico
Peru
Uruguay
Colombia
-12
14. A major change in growth leadership with India’s service economy in first place instead of China, will keep down the price of
raw materialsEconomic Growth on China and India
14
China
India
%
12
10
7,3
7,5
8
6,9
6
6,5
4
2005
2006
2007
2008
Source: World Bank and WEO
2009
2010
2011
2012
2013
2014
2015 2016*
15.
Where are we comingfrom? – A long term view
16. Colombia has transformed from a low to an upper middle income economy
GDP per capita(International Dollars, PPP)
16000
14000
Upper middle income
12000
USD PPP
10000
Lower middle income
8000
6000
4000
2000
Low Income
1980
1981
1982
1983
1984
1985
1986
1987
1988
1989
1990
1991
1992
1993
1994
1995
1996
1997
1998
1999
2000
2001
2002
2003
2004
2005
2006
2007
2008
2009
2010
2011
2012
2013
2014
0
Source: IMF and World Bank
17. Inflation and unemployment rates have fallen from the two-digit levels from two decades ago
Annual Inflation35
Annual Unemployment Rate
25
32,4
30
20,1
20
25
15
%
%
20
15
10
9,1
9,1
8,4
10
6,8
5
5
Source: Colombian Central Bank. Banco de la República.
2014
2012
2010
2008
2006
2004
2002
2000
1998
1996
1994
1992
1990
1988
1986
1984
0
1982
1,9
1980
0
Source: Colombian National Institute of Statistics. DANE.
18. Security indicators have also drastically improved…
Murders per 100.000 peopleKidnappings
3572
75
69,8
56,2
55
% 45
35,0
32,7
27,8
35
25
Número de personas
65
3500
2500
2000
1500
1000
305
500
288
Source: Colombian Defense Ministry.
2014
2013
2012
2011
2010
2009
2008
2007
2006
2005
2004
2003
2002
2000
2014
20000
18000
16000
14000
12000
10000
8000
6000
4000
2000
0
17176
15358
16311
2014
2013
2012
2011
2010
2009
2008
2007
2006
2005
2004
2003
10972
9128
2002
2013
2012
571
2011
2010
2009
2008
2007
2006
2005
2004
2003
2002
2001
471
764
Número de robos
894
2000
2013
2012
2011
2010
2008
2007
2006
2009
Commercial robberies
Terrorist acts
2014
1645
2005
2004
2003
2002
2001
1800
1600
1400
1200
1000
800
600
400
200
0
2001
0
15
Número de ataques
2882
3000
19. …As the levels of poverty and extreme poverty
Monetary Poverty65
Extreme Monetary Poverty
35
61,7
60
33,1
30
55
%
45
20
45,5
40,3
40
18
17,7
%
50
25
49,7
15
12,2
35
10
Total
30
27,8
Urban
25
7,9
Rural
Urban
24,1
20
4,9
Total
5
Rural
Source: Colombian National Institute of Statistics. DANE.
2015
2014
2013
2012
2011
2010
2009
2008
2005
2004
2003
2002
2015
2014
2013
2012
2011
2010
2009
2008
2005
2004
2003
2002
0
20. Inequality, meanwhile, has remained relatively constant
Inequality0,58
0,572
0,567
0,56
0,54
0,542
0,55
0,522
0,52
0,518
0,5
0,489
0,498
0,48
0,46
0,454
Total
0,44
Municipalities
Remainder
Source: Colombian National Institute of Statistics. DANE.
2015
2014
2013
2012
2011
2010
2009
2008
2005
2004
2003
2002
0,42
21. Currently, debt is mainly in local currency, which reduces the external exposure of the country
National Central Government Debt CompositionInternal Debt
External Debt
100%
90%
39%
80%
70%
60%
87%
50%
40%
61%
30%
20%
10%
13%
Source: Colombian Treasury Ministry. MHCP
2015
2014
2013
2012
2011
2010
2009
2008
2007
2006
2005
2004
2003
2002
2001
2000
1999
1998
1997
1996
1995
1994
1993
1992
1991
1990
0%
22. The Colombian economy has gone from being purely rural, specializing in coffee, to a service oriented one, albeit strongly
influenced by the energy sectorProductive Structure
30
25
Agri
Agro
Mining
Minas
Industry
Industria
Financial
Serviciosservices
Financieros
25,1
20,7
19,9
20
19,3
19,2
%
16,2
13,8
15
12,8
11,2
11,1
9,3
10
8,4
6,2 6,8
6,5
5
2,0
0
1970
1990
Source: Colombian National Institute of Statistics. DANE.
2010
2015
23. While the amount of exports have grown substantially, it has remained relatively stable as share of GDP
Exports and Imports (% GDP)20
Exports
Exportaciones
18
Imports
Importaciones
16
%
14
12
10
8
Source: Colombian National Planning Department. -DNP
2014
2012
2010
2008
2006
2004
2002
2000
1998
1996
1994
1992
1990
1988
1986
1984
1982
1980
1978
1976
1974
6
24. Exports are still concentrated in traditional products. The top product was coffee in the 70s and is oil today.
Export’s Composition50
70
63,9
60,0
60
50
Traditional exports as share of total exports
45
61,0
41,6
39,9
40
52,2
47,8
35
40,0
40
43,9
%
%
36,1
30
28,8
30
39,0
25
20,9
20
15,1
15
20
10
10
8,1
8,0
4,7
5
0
0
1974
1990
Tradicionales
Traditional
2010
No
Nontradicionales
Traditional
2015
Source: Colombian National Planning Department. -DNP
0,2
1974
Petróleo
Oil
2,2
1990
Café
Coffee
2010
Carbón
Coal
12,8
7,1
2,4
1,2
2015
Ferroníquel
Ferronickel
25. Most imports are still intermediate goods, although consumer goods have gained ground
Import’s Composition70
Consumption
goods
Bienes de Consumo
Intermed.
goods
Bienes
Intermedios
Capitaldegoods
Bienes
Capital
Notclasificados
classified
No
58,3
60
53,1
50
43,1
42,3
40
%
36,1
35,4
34,4
29,8
30
22,4
22,2
20
11,8
9,8
10
1,0
0,2
0
1974
Source: Colombian National Planning Department. -DNP
1990
0,1
2010
0,0
2015
26.
Macroeconomic, fiscalcontext, and perspectives
27.
Macroeconomic and fiscalcontext
Perspectives
28.
Macroeconomic and fiscalcontext
Perspectives
29.
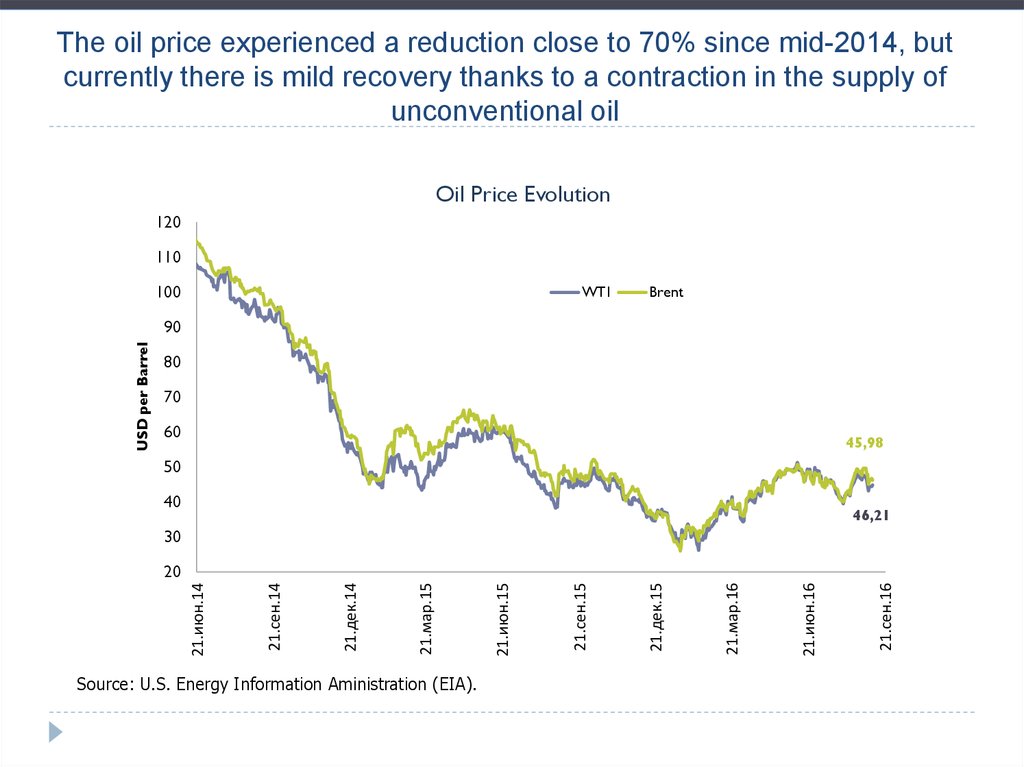
The oil price experienced a reduction close to 70% since mid-2014, butcurrently there is mild recovery thanks to a contraction in the supply of
unconventional oil
Oil Price Evolution
120
110
100
WTI
Brent
USD per Barrel
90
80
70
60
45,98
50
40
46,21
30
Source: U.S. Energy Information Aministration (EIA).
21.сен.16
21.июн.16
21.мар.16
21.дек.15
21.сен.15
21.июн.15
21.мар.15
21.дек.14
21.сен.14
21.июн.14
20
30. This has had an impact on the risk perception of Colombia ...
Emerging Markets Bonds Index –EMBI- Colombia400
Jun-14
350
Basis Points
300
250
234,1
200
150
100
Source: Bloomberg.
сен.16
май.16
янв.16
сен.15
май.15
янв.15
сен.14
май.14
янв.14
сен.13
май.13
янв.13
сен.12
май.12
янв.12
сен.11
май.11
50
31. And on the sharp depreciation of the peso, reaching historical values and strongly rising currency volatility, but gaining
And on the sharp depreciation of the peso, reaching historicalvalues and strongly rising currency volatility, but gaining value
this year
Nominal Exchange Rate (COP/USD)
$ 3 400
Colombian Pesos per US Dollar
$ 3 200
$ 2.976,16
$ 3 000
$ 2 800
$ 2 600
$ 2 400
$ 2 200
$ 2 000
Source: Colombian Central Bank. Banco de la República.
сен.16
июл.16
май.16
мар.16
янв.16
ноя.15
сен.15
июл.15
май.15
мар.15
янв.15
ноя.14
сен.14
июл.14
май.14
мар.14
янв.14
ноя.13
сен.13
июл.13
$ 1 800
32. Which has fueled an acceleration of inflation thru tradable goods in the economy
Total annual inflation and by group of expense8,97%
9%
8%
Total
7%
Transables
Tradeables
7,87%
Non
Tradeables
No
Transables
6%
5,01%
5%
4%
3%
2%
1%
Source: Colombian National Institute of Statistics. DANE.
авг.16
май.16
фев.16
ноя.15
авг.15
май.15
фев.15
ноя.14
авг.14
май.14
фев.14
ноя.13
авг.13
май.13
фев.13
ноя.12
авг.12
май.12
0%
33. ... El Niño caused an increase on food inflation and pushed general inflation to levels above the target range (2-4%)
Total annual inflation and by group of expense16%
14%
Total
Sin
Alimentos
Without
food
12%
13,06%
Alimentos
Food
10%
8%
8,10%
6%
6,10%
4%
2%
Source: Colombian National Institute of Statistics. DANE.
авг.16
май.16
фев.16
ноя.15
авг.15
май.15
фев.15
ноя.14
авг.14
май.14
фев.14
ноя.13
авг.13
май.13
фев.13
ноя.12
авг.12
май.12
0%
34. Motivating contractionary monetary policy response in order to anchor expectations
фев.12апр.12
июн.12
авг.12
окт.12
дек.12
фев.13
апр.13
июн.13
авг.13
окт.13
дек.13
фев.14
апр.14
июн.14
авг.14
окт.14
дек.14
фев.15
апр.15
июн.15
авг.15
окт.15
дек.15
фев.16
апр.16
июн.16
авг.16
Motivating contractionary monetary policy response in order to
anchor expectations
9
8
Jun 2014
Source: Colombian National Institute of Statistics. DANE.
7,75
7
6
5
%
4
3
2
1
0
35. The oil and monetary shock had an impact on all sectors of the economy
Supply-side annual growth (%)2,0
2,7
PIB
GDP
6,4
2,3
2,4
Social sociales
Services
Servicios
2016-II
4,6
4,8
Servicios
Financieros
Financial
Services
0,1
Transport
Transporte
2,5
1,0
Construction
Construcción
-0,8
Electricidad,
gas ywater
agua
Electricity,
gas and
Industria
Industry
4,5
3,9
6,0
5,2
-7,1
0,3
-0,1
Agro
Agricultural
-10
-5
5,9
14,5
-1,9
Mining
Minas
2014-II
6,1
3,2
2,3
2015-II
5,3
1,4
Comercio
Commerce
8,2
4,2
2,2
0
Source: Colombian National Institute of Statistics. DANE.
5,7
5
%
10
15
20
36. On the demand side, investment has slowed down to negative levels of growth for the second quarter of 2016, while domestic
demand continues to decreaseDemand-side annual growth (%)
EX
Exports
3,6
1,2
0,7
1,2
-11,5
Imports
IM
3,9
1,3
3,3
Final Internal
Demanda
FinalDemand
Interna
-2,3
Investment
Inversión
6,3
1,3
2,0
2,3
Goverment
Gobierno
16,0
5,2
2,7
3,8
3,6
Households
Hogares
2016-II
2015-II
2,53,7
3,9
Total
Consumption
Consumo
Total
2,0
GDP
PIB
-15
-10
-5
Source: Colombian National Institute of Statistics. DANE.
0
3,14,0
5
%
2014-II
10
15
20
37.
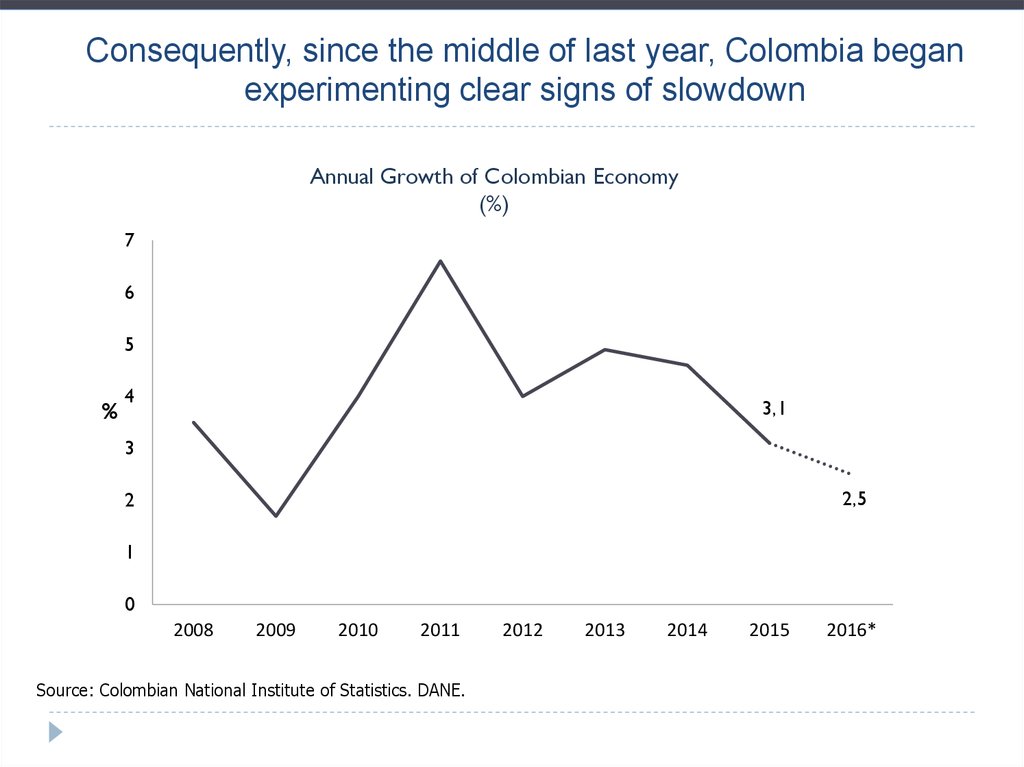
Consequently, since the middle of last year, Colombia beganexperimenting clear signs of slowdown
Annual Growth of Colombian Economy
(%)
7
6
5
%
4
3,1
3
2,5
2
1
0
2008
2009
2010
2011
Source: Colombian National Institute of Statistics. DANE.
2012
2013
2014
2015
2016*
38.
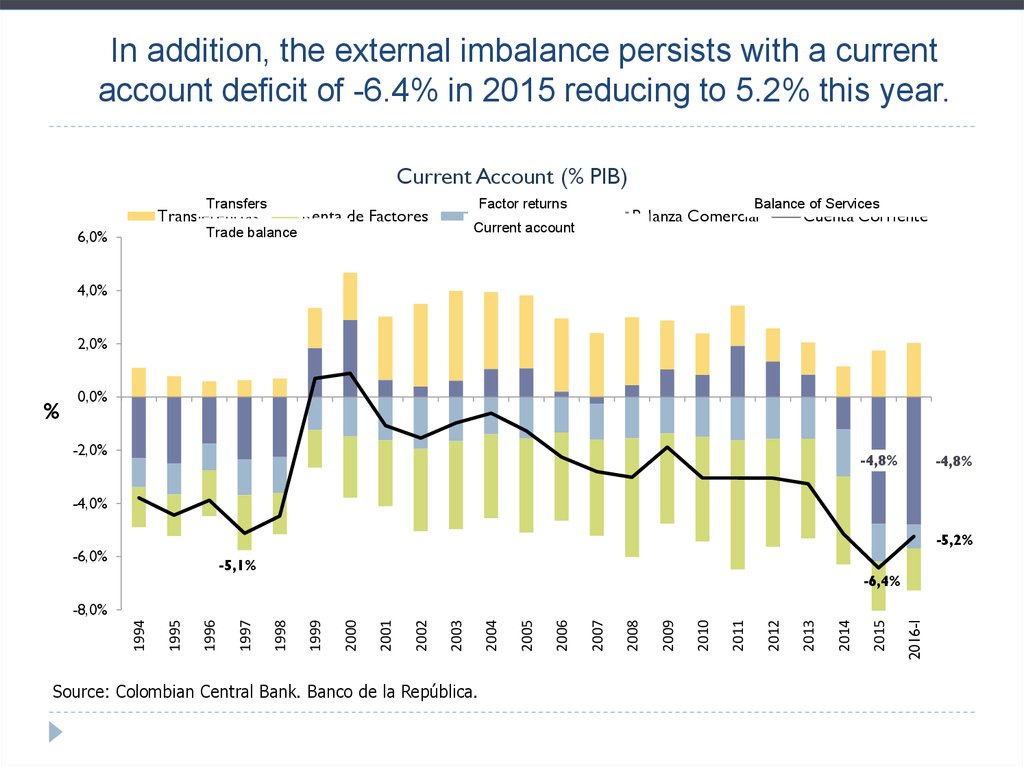
In addition, the external imbalance persists with a currentaccount deficit of -6.4% in 2015 reducing to 5.2% this year.
Current Account (% PIB)
Transfers
Transferencias
Factor returns
Renta de Factores
Balanza Comercial
Current account
Trade balance
6,0%
Balance of Services
Balanza Servicios
Cuenta Corriente
4,0%
2,0%
%
0,0%
-2,0%
-4,8%
-4,8%
-4,0%
-5,2%
-6,0%
-5,1%
-6,4%
Source: Colombian Central Bank. Banco de la República.
2016-I
2015
2014
2013
2012
2011
2010
2009
2008
2007
2006
2005
2004
2003
2002
2001
2000
1999
1998
1997
1996
1995
1994
-8,0%
39. In part due to the marked deterioration in the trade balance
Trade Balance, monthly exports and imports (12 months cumulative)65
USD Billions
55
-3
50
45
-8
40
35
Balanza
der.)
Tradecomercial
balance (eje
(right)
Exportaciones
Exports
-13
Importaciones
Imports
30
Source: Colombian National Institute of Statistics. DANE.
июл.16
май.16
мар.16
янв.16
ноя.15
сен.15
июл.15
май.15
мар.15
янв.15
ноя.14
сен.14
июл.14
май.14
мар.14
янв.14
ноя.13
сен.13
июл.13
май.13
мар.13
-18
янв.13
25
USD Billions
2
60
40.
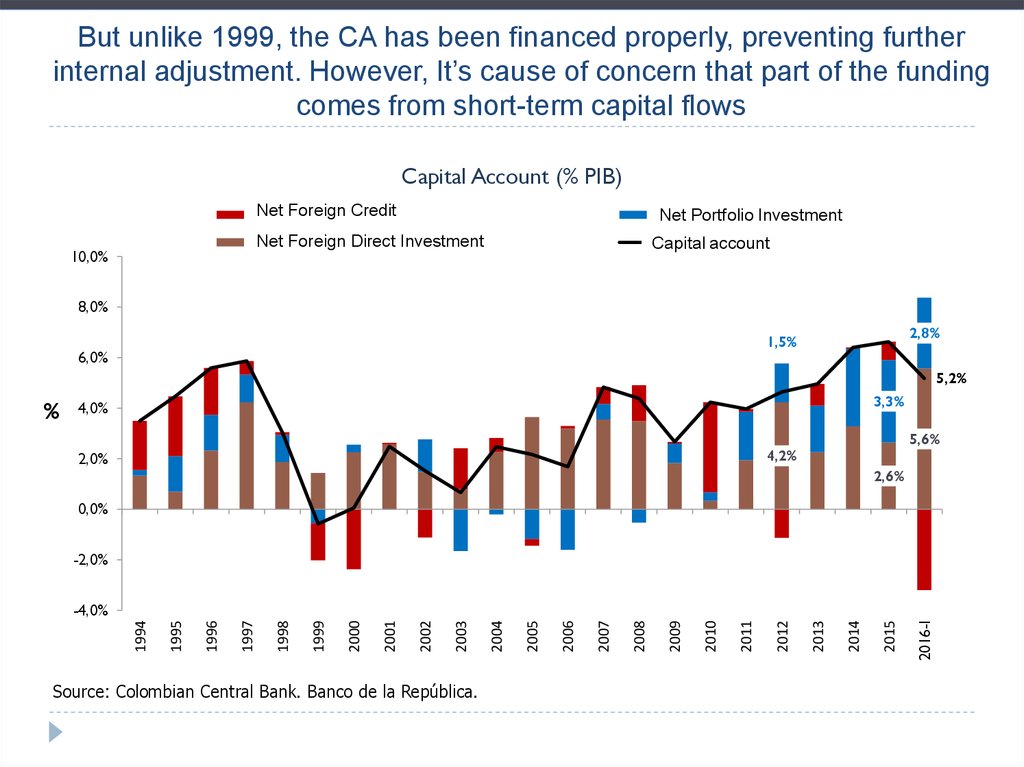
But unlike 1999, the CA has been financed properly, preventing furtherinternal adjustment. However, It’s cause of concern that part of the funding
comes from short-term capital flows
Capital Account (% PIB)
10,0%
Net Foreign
Crédito
ExternoCredit
Neto
Inversión
de Portafolio
Neta
Net Portfolio
Investment
Net Foreign
Direct
Investment
Inversión
Extranjera
Directa
Neta
Cuenta
Capitales
Capitaldeaccount
8,0%
2,8%
1,5%
6,0%
5,2%
%
3,3%
4,0%
5,6%
4,2%
2,0%
2,6%
0,0%
-2,0%
Source: Colombian Central Bank. Banco de la República.
2016-I
2015
2014
2013
2012
2011
2010
2009
2008
2007
2006
2005
2004
2003
2002
2001
2000
1999
1998
1997
1996
1995
1994
-4,0%
41. The country's external debt has risen sharply to over 40% of GDP due to the depreciation of the peso
The country's external debt has risen sharply to over 40% ofGDP due to the depreciation of the peso
Debt as a share of the GDP (%)
50
Saldo
/ PIB
Total Total
debt/GDP
Public
Saldodebt/GDP
Pública/PIB
Private
debt/GDP
Saldo Privada
/PIB
37,9
%
40
30
23,0
20
10
42,2
22,5
15,9
22,5
13,8
8,8
7,1
21,3
12,6
9,9
12,5
8,8
2011
2012
24,2
26,8
13,7
10,5
22,7
15,8
15,2
25,3
16,9
11,0
0
2009
2010
* Projected to 2016 using debt data until March.
Source: Colombian Central Bank. Banco de la República.
2013
2014
2015
2016
*
42. While capital inflows of portfolio increase fiscal vulnerability due to the high percentage of bond holdings in foreign hands
Share of foreign funds as holders of TES25
22,4
20
%
15
10
6,4
5
Source: Colombian Treasury Ministry. MHCP
авг.16
июн.16
апр.16
фев.16
дек.15
окт.15
авг.15
июн.15
апр.15
фев.15
дек.14
окт.14
авг.14
июн.14
апр.14
фев.14
0
43. On the fiscal front, revenues have fallen substantially pushing the government deficit to an estimated 3.9% in 2016, setting up
ascenario of twin deficits
Revenue, Expenditure and Fiscal Deficit (% GDP)
2010
2011
2012
2013
2014
2015
2016*
25,0
0,0
-0,5
20,0
-1,0
-1,5
15,0
-2,0
-2,0
-1,8
-2,2
-2,5
-2,4
10,0
-3,0
Déficit
fiscal
(eje der.)
Fiscal
Deficit
(right)
5,0
-3,4
Expenditure
Source: Colombian Treasury Ministry. MHCP
-3,5
Ingresos
Revenue
Gastos
0,0
-3,0
-3,9
-4,0
-4,5
44. While experts have said that the fiscal needs for 2020 are of about 3.3% of GDP
Fiscal requirements(% GDP)
3,5
3,3
% GDP
3,0
2,8
2,5
2,0
1,5
1,5
1
1,0
0,5
0,3
0
0,0
2014
2015
2016
Source :Tax Experts Report and OCDE.
2017
2018
2019
2020
45. According to the government, the structural imbalance for 2016 will be approximately 2.1%, and the oil imbalance of the order
of 1.8%Total revenue
Tax
Oil
Non Tax
Special Funds
Capital Resources
Ecopetrol
Total Expenditure
Interests
Operating costs
Investment
Total Balance
Ciclical Balance
Structural Balance
2015*
16,1
14,5
0,7
0,1
0,2
1,3
0,5
19,2
2,6
13,5
3,1
-3
-0,8
-2,2
Source: Colombian Treasury Ministry. MHCP
2016*
15,0
14,2
0
0,1
0,2
0,5
0,1
19,0
3,2
13,8
1,9
-3,9
-1,8
-2,1
• But the government seems
to be overestimating the
growth of the economy.
• And the non-oil tax
revenues.
• Moreover, it is not doing all
the necessary budget cuts.
• So the structural
imbalance could be of
around 2.5% of the GDP.
46. Tax revenue in the country is low when compared with other countries in the region and the OECD. There is a high tax burden on
businesses.Fiscal Revenue in Colombia, LATAM and
OECD (%GDP, 2013)
Fiscal Revenue (% GDP)
60
Empresas
Business
Personas
People
42
40
80%
40%
% GDP
60%
30
17%
75%
80%
83%
12%
36%
55%
70%
3535
25%
20%
Colombia
90%
Chile
50
Perú
Peru
100%
72%
50%
20
20
17
14
10%
0
88%
45%
20%
10
60%
64%
Latina
América
LATAM
30%
Argentina
40%
28%
Source: OECD (2014) and ECLAC (2013)
Source: OECD.
Brasil
Brazil
Mexico
México
OECD
Finalandia
Finland
Grancia
France
Secia
Sweden
Italia
Italy
Grecia
Greece
Eslovenia
Slovenia
Portugal
Portugal
Brasil
Brazil
Slovakia
Eslovaquia
Estonia
Estonia
England
Inglaterra
Israel
Israel
Argentina
Argentina
Irlanda
Ireland
Korea
South del
Sur
Corea
México
Mexico
Colombia
Colombia
0%
47.
Taxation of natural persons is low because the thresholdfrom which is taxed is very high, while the tax rate looks high
Collection and taxation threshold
9
8
7
6
5
8,5
Recaudo
personas
Collection
from
(%People
PIB) (%GDP)
Umbral
pago
renta
Taxation
threshold
(veces
PIB
per
(times GDP per
cápita)
capita)
4
2,8
3
2
1
1,3
1,4
0,8
0,2
0
Colombia
América Latina
OECD
Country
Effective tax rate
Denmark
26,0%
England
33,7%
South Korea
32,4%
Chile
27,9%
Sweden
49,4%
United States
43,8%
Peru
36,0%
Germany
48,8%
Spain
58,2%
Mexico
52,1%
China
64,5%
Japan
51,3%
Colombia
75,4%
Bolivia
83,7%
Source: Tax Commission
Source: World Bank (2014).
48.
Macroeconomic and fiscalsituation
Perspectives
49. The slowdown is deepening, with the exception of the industrial sector
июл.16-8
апр.16
-6
окт.15
-4
янв.16
-2
июл.15
1,4
апр.15
% 0
янв.15
2
окт.14
4
июл.14
6
7
6
5
4
3
% 2
1
0
-1
-2
-3
апр.14
Industrial production
янв.14
-8,66
окт.13
июл.16
апр.16
янв.16
окт.15
июл.15
апр.15
янв.15
окт.14
июл.14
апр.14
янв.14
окт.13
-10
июл.13
% 6
4
апр.13
5
июл.13
8
апр.13
10
янв.13
10
янв.13
15
окт.12
12
окт.12
-5
июл.12
0
20
июл.12
-15
июл.16
апр.16
Cement shipments
апр.12
Source: Colombian National Institute of Statistics. DANE.
янв.16
окт.15
июл.15
апр.15
янв.15
окт.14
июл.14
апр.14
янв.14
окт.13
25
июл.13
8
апр.13
янв.13
окт.12
июл.12
июл.11
окт.11
янв.12
апр.12
июл.12
окт.12
янв.13
апр.13
июл.13
окт.13
янв.14
апр.14
июл.14
окт.14
янв.15
апр.15
июл.15
окт.15
янв.16
апр.16
июл.16
%
апр.12
янв.12
The slowdown is deepening, with the exception of the
industrial sector
14
Retail
2
0
-2
-1,3
Energy demand
-1,0
50. The economy faces high levels of industrial confidence paired with historical low levels of consumer confidence
Consumer Confidence IndexIndustrial Confidence Index
13
37
27
8
17
3
3,70
ICI
7
-2
Source: Fedesarrollo.
-7
июн.16
мар.16
дек.15
сен.15
июн.15
мар.15
дек.14
сен.14
июн.14
мар.14
дек.13
сен.13
июн.13
мар.13
-12
дек.12
янв.16
июл.15
янв.15
июл.14
янв.14
июл.13
янв.13
июл.12
янв.12
июл.11
янв.11
июл.10
янв.10
июл.09
янв.09
июл.08
-23
июл.16
-14,9
сен.12
-13
июн.12
-3
51.
During 2016 the country will experience the worst economicgrowth since the financial crisis. By 2017 a slight rebound is
expected.
Real anual GDP growth (%)
7
6
5
4
3,1
2,9
3
2,5
2
1
0
2008
2009
2010
2011
Source: Colombian National Institute of Statistics. DANE.
2012
2013
2014
2015
2016* 2017*
52.
The slowdown will be experienced in almost all sectors.Real GDP Growth (%)
2,5
3,1
PIBGDP
Construction
Contrucción
Industry
Industria
8,2
1,2
3,4
4,3
Financial
Services
Servicios
Financieros
2,5
Comercio
Commerce
Servicios
Sociales
Social
Services
1,1
Agricultural
Agro
0,9
0,9
Electricity,
gasagua
andy water
Electricidad,
gas
2016
2015
4,1
2,9
3,3
2,9
0,8
1,4
Transport
Transporte
Mining -5,8
Minas
-8
8,5
3,9
-6
0,6
-4
-2
0
2
Source: Colombian National Institute of Statistics. DANE and Asobancaria
4
6
8
10
53.
Colombia in the regionalcontext
54.
Despite the economic slowdown, Colombia continues to leadin terms of growth in the region alongside Peru
Annual Real GDP Growth
5
4,4
4
3
2
3,7
3,3
2,4
1,9
2,3
3,1
2,1
2,5
2,0
1,3 1,5
1
0,1
% 0
-1
-2
-3
-4
-3,8
-3,8
-5
2014
Peru
Perú
Source: IMF
2015
Chile
Chile
Mexico
México
2016-2
Brazil
Brasil
Colombia
Colombia
55. The Colombian peso is among the most depreciated currencies in the region alongside Mexico
Exchange Rate Index (Base 100 = june 2014)180
Jun-2014
160
140
120
100
Source: Bloomberg.
Perú
sep.-16
jul.-16
mar.-16
ene.-16
nov.-15
sep.-15
jul.-15
Brazil
Brasil
may.-16
Chile
mar.-15
ene.-15
nov.-14
sep.-14
jul.-14
México
may.-15
Colombia
may.-14
mar.-14
ene.-14
nov.-13
sep.-13
jul.-13
may.-13
mar.-13
80
56.
While inflation has risen more than in other countries in theregion except Brazil
Total annual Inflation
12
10
Chile
Chile
Peru
Perú
México
Mexico
Colombia
Colombia
Brasil
Brazil
%
8
6
4
2
0
авг.11
авг.12
Source: National Estadistic Institues of each country
авг.13
авг.14
авг.15
авг.16
57.
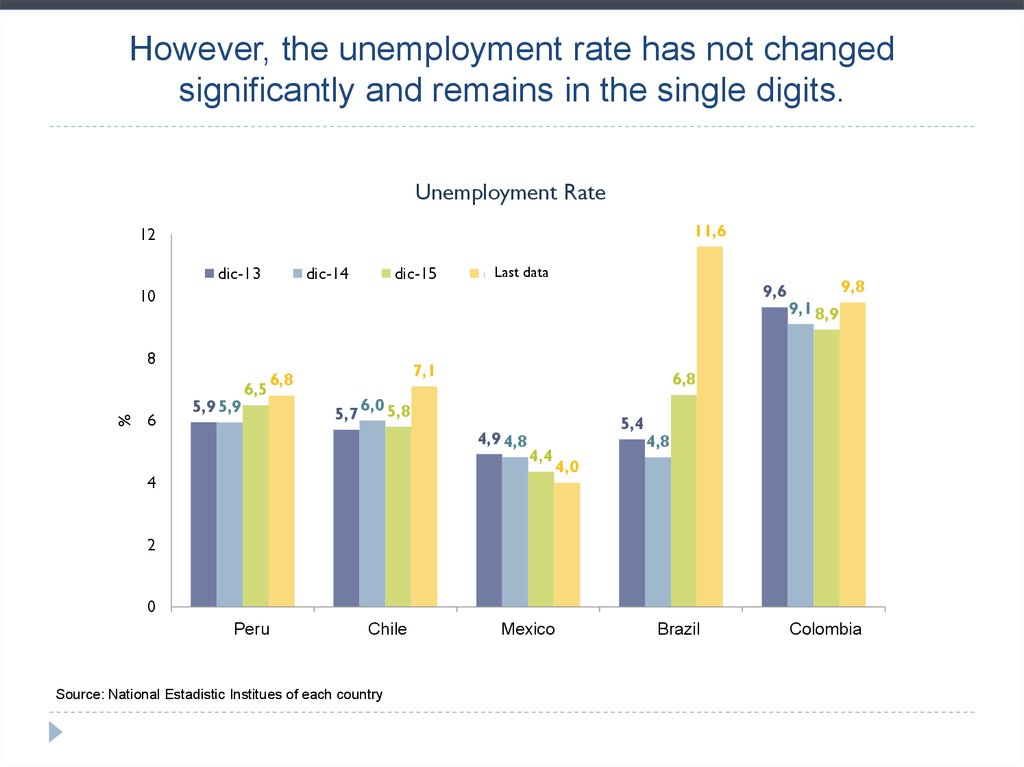
However, the unemployment rate has not changedsignificantly and remains in the single digits.
Unemployment Rate
11,6
12
dic-13
dic-14
dic-15
Last data
último
dato
9,6
10
%
8
6
5,9 5,9
6,5
7,1
6,8
5,7
9,8
9,1 8,9
6,8
6,0 5,8
4,9 4,8
5,4
4,4
4
4,8
4,0
2
0
Perú
Peru
Chile
Chile
Source: National Estadistic Institues of each country
México
Mexico
Brasil
Brazil
Colomiba
Colombia
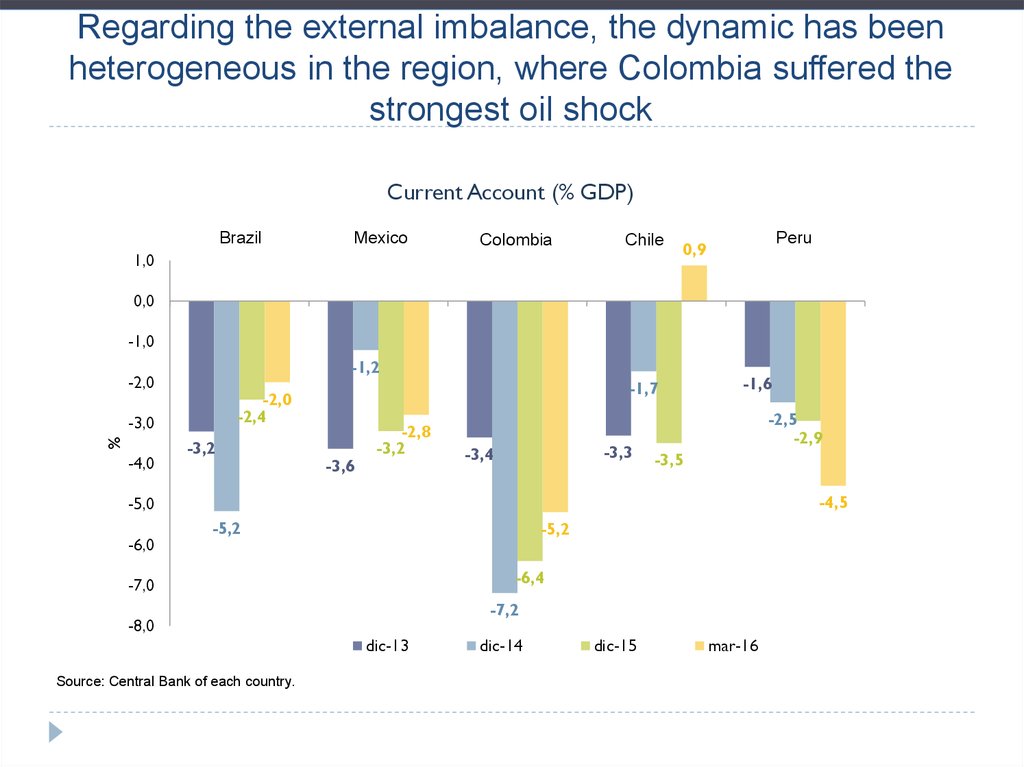
58.
Regarding the external imbalance, the dynamic has beenheterogeneous in the region, where Colombia suffered the
strongest oil shock
Current Account (% GDP)
Brazil
Brasil
Mexico
México
Colombia
Colombia
Chile
Chile
1,0
Peru
Perú
0,9
0,0
-1,0
-1,2
-2,0
%
-3,0
-4,0
-1,7
-2,0
-2,4
-3,2
-3,6
-2,8
-3,2
-3,3
-3,4
-1,6
-2,5
-2,9
-3,5
-4,5
-5,0
-6,0
-5,2
-5,2
-6,4
-7,0
-7,2
-8,0
dic-13
Source: Central Bank of each country.
dic-14
dic-15
mar-16
59.
It is expected that by 2016 the Colombian economy will continue to lead interms of growth with Mexico and Peru, while Argentina, Brazil and
Venezuela will remain in crisis
Real anual Growth , 2016 (%)
4
3,3
2,8
2,5
2,5
2
2,2
0,1
0
-0,7
-2
-1,0
-4
-6
-6,0
Source: IMF – WEO april 2016.
Venezuela
Brazil
Argentina
Ecuador
Uruguay
Chile
Colombia
Mexico
Peru
-8
60. In the long term it is expected that Mexico will be the country with the largest contribution to growth in the region followed
by Brazil despite its current crisis,while Colombia will be the fourth
Incremental GDP* (USD Billions)
637
G-6 Average
Incremental
GDP
416
Incremental
GDP
Italy
277
222
140
133
-1
México
Brazil
Brasil
Argentina
Colombia
Chile
Perú
Venezuela
*Is the difference between the nominal GDP in 2030 and the nominal GDP in 2015 expressed in USD. The size of the circle represents the size
of each economy.
Source: IMF.
61. In fact, Venezuela will be the only country that will not increase its per capita income while Brazil could stagnate. Chile and
Colombia willcontinue to lead
GDP per capita PPP Projections. USD
38 729
40 000
Argentina
Chile
Mexico
Venezuela
35 000
Brasil
Colombia
Peru
34 536
30 000
28 270
25 285
25 000
20 935
20 000
20 527
16 289
15 000
Source: IMF
2030
2029
2028
2027
2026
2025
2024
2023
2022
2021
2020
2019
2018
2017
2016
2015
10 000
62. Conclusions
In the present global economic environment LatinAmerica growth was sharply reduced and its average rate
of inflation increased.
In the case of Colombia and the Pacific Alliance countries
the impact has been less severe due to their flexible
exchange rate regimes and responsible fiscal policies.
Nevertheless, in the next few years the greatest challenge
will be to find new sources of growth that will have to
involve the diversification of their exports.
In order to achieve this they need to attract high quality
FDI and better competitiveness policies