


 Финансы
Похожие презентации:

")


Budget 2017. Uzbekistan + Tajikistan
1.
2017 BUDGET PRESENTATIONUzbekistan + Tajikistan
Erkin Ataev
Moscow, 10 October’2016
2.
AGENDA1
EXECUTIVE SUMMARY
2
COUNTRY ECONOMIC ENVIRONMENT
3
MARKET UPDATE AND SALES PERFORMANCE
4
B2017 UZBEKISTAN AND TAJIKISTAN
5
STRATEGIC GOALS AND ACTION PLAN 2017
6
APPENDIX
2
3.
1EXECUTIVE SUMMARY
Uzbekistan and Tajikistan
3
4.
1EXECUTIVE
SUMMARY
Executive Summary – Uzbekistan and Tajikistan
Economic indicators
Population
GDP 2016 mln $
GDP per capita $
Uzbekistan
31 500 000
67 100
2126,0
Tajikistan
8 600 000
6 900
804,0
TOTAL
4
5.
1EXECUTIVE
SUMMARY
Executive Summary – Uzbekistan and Tajikistan
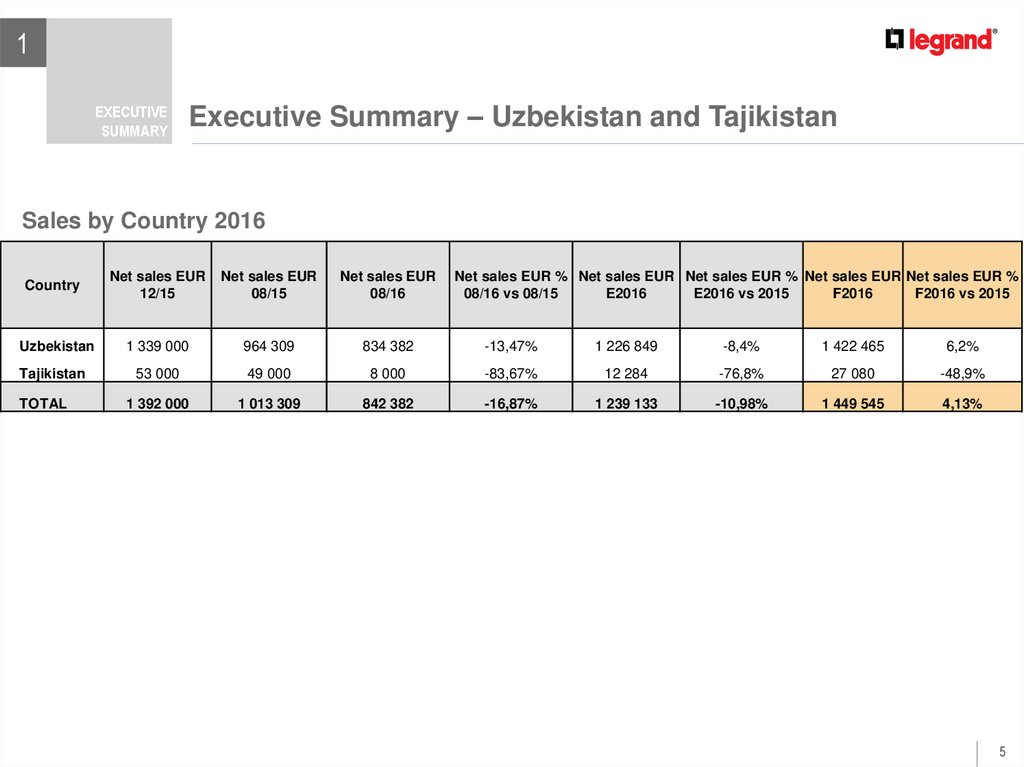
Sales by Country 2016
Country
Uzbekistan
Tajikistan
TOTAL
Net sales EUR
12/15
Net sales EUR
08/15
Net sales EUR
08/16
Net sales EUR % Net sales EUR Net sales EUR % Net sales EUR Net sales EUR %
08/16 vs 08/15
E2016
E2016 vs 2015
F2016
F2016 vs 2015
1 339 000
964 309
834 382
-13,47%
1 226 849
-8,4%
1 422 465
6,2%
53 000
49 000
8 000
-83,67%
12 284
-76,8%
27 080
-48,9%
1 392 000
1 013 309
842 382
-16,87%
1 239 133
-10,98%
1 449 545
4,13%
5
6.
1EXECUTIVE
SUMMARY
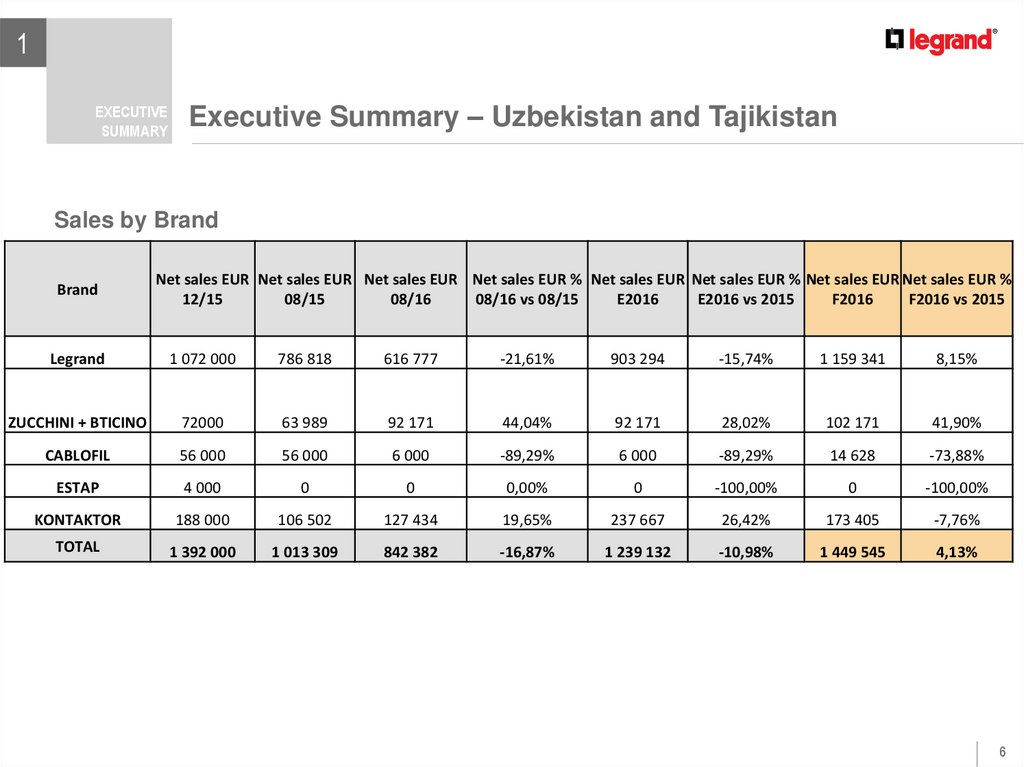
Executive Summary – Uzbekistan and Tajikistan
Sales by Brand
Brand
Net sales EUR Net sales EUR Net sales EUR Net sales EUR % Net sales EUR Net sales EUR % Net sales EUR Net sales EUR %
12/15
08/15
08/16
08/16 vs 08/15
E2016
E2016 vs 2015
F2016
F2016 vs 2015
Legrand
1 072 000
786 818
616 777
-21,61%
903 294
-15,74%
1 159 341
8,15%
ZUCCHINI + BTICINO
72000
63 989
92 171
44,04%
92 171
28,02%
102 171
41,90%
CABLOFIL
56 000
56 000
6 000
-89,29%
6 000
-89,29%
14 628
-73,88%
ESTAP
4 000
0
0
0,00%
0
-100,00%
0
-100,00%
KONTAKTOR
188 000
106 502
127 434
19,65%
237 667
26,42%
173 405
-7,76%
TOTAL
1 392 000
1 013 309
842 382
-16,87%
1 239 132
-10,98%
1 449 545
4,13%
6
7.
2Country Economic
Environment
7
8.
2Uzbekistan
8
9.
2COUNTRY
ECONOMIC
ENVIRONMENT
Country Economic Environment
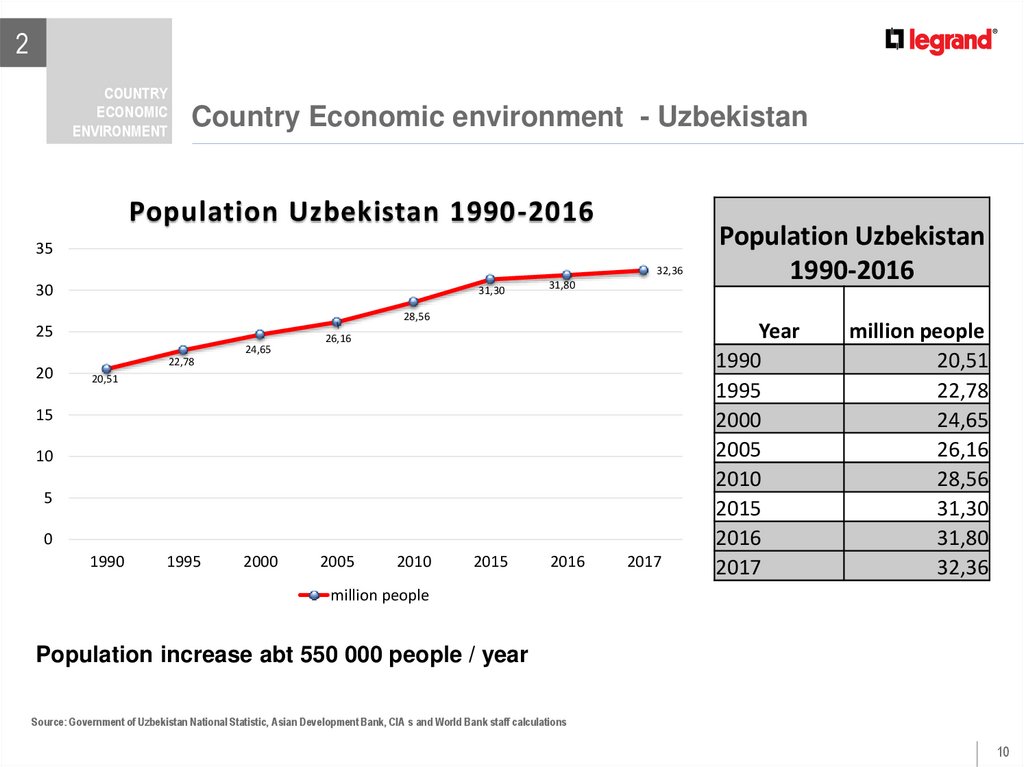
Country Economic environment - Uzbekistan
GDP, bln Sum
GDP, mln $
GDP per person, $
GDP, %
Population
Cross Rate Sum/$
537 760,00
67 100,00
2 126
7,4 %
31 500 000
8 000,00
2016
Currency
Amount
Volume of investments
Agriculture volume
Retail turnover
Export
Import
Foreign investments
$ bln
17,3
Bln sum
UZS trln
$ bln
$ bln
$ bln
42 280
92,4
16,72
16,33
5,40
Unemployment rate
%
4,6
envisaged to build 13,000 residential buildings with a total area of over 1.8 million
square meters in rural areas
9
10.
2COUNTRY
ECONOMIC
ENVIRONMENT
Country Economic Environment
Country Economic environment - Uzbekistan
Population Uzbekistan 1990-2016
35
32,36
30
31,30
31,80
28,56
25
24,65
20
26,16
22,78
20,51
15
10
5
0
1990
1995
2000
2005
2010
2015
2016
2017
Population Uzbekistan
1990-2016
Year
1990
1995
2000
2005
2010
2015
2016
2017
million people
20,51
22,78
24,65
26,16
28,56
31,30
31,80
32,36
million people
Population increase abt 550 000 people / year
Source: Government of Uzbekistan National Statistic, Asian Development Bank, CIA s and World Bank staff calculations
10
11.
2COUNTRY
ECONOMIC
ENVIRONMENT
Country Economic Environment
Country Economic environment - Uzbekistan
GDP Uzbekistan
2000-2017
GDP Uzbekistan 2000-2016
80
72
70
63,13
60
56,79
51,18
50
45,32
40
39,33
32,82
30
27,93
22,31
20
13,76 11,4
9,68
10,13
2003
17,03
2002
10
66,73 67,2
12,03
14,31
Billion $
GDP Forecast 2017 ~ +7,4%
Source: Government of Uzbekistan National Statistic, Asian Development Bank, CIA s and World Bank staff calculations
2017
2016
2015
2014
2013
2012
2011
2010
2009
2008
2007
2006
2005
2004
2001
2000
0
Year
2000
2001
2002
2003
2004
2005
2006
2007
2008
2009
2010
2011
2012
2013
2014
2015
2016
2017
Billion $
13,76
11,4
9,68
10,13
12,03
14,31
17,03
22,31
27,93
32,82
39,33
45,32
51,18
56,79
63,13
66,73
67,20
72,00
11
12.
2COUNTRY
ECONOMIC
ENVIRONMENT
Country Economic Environment
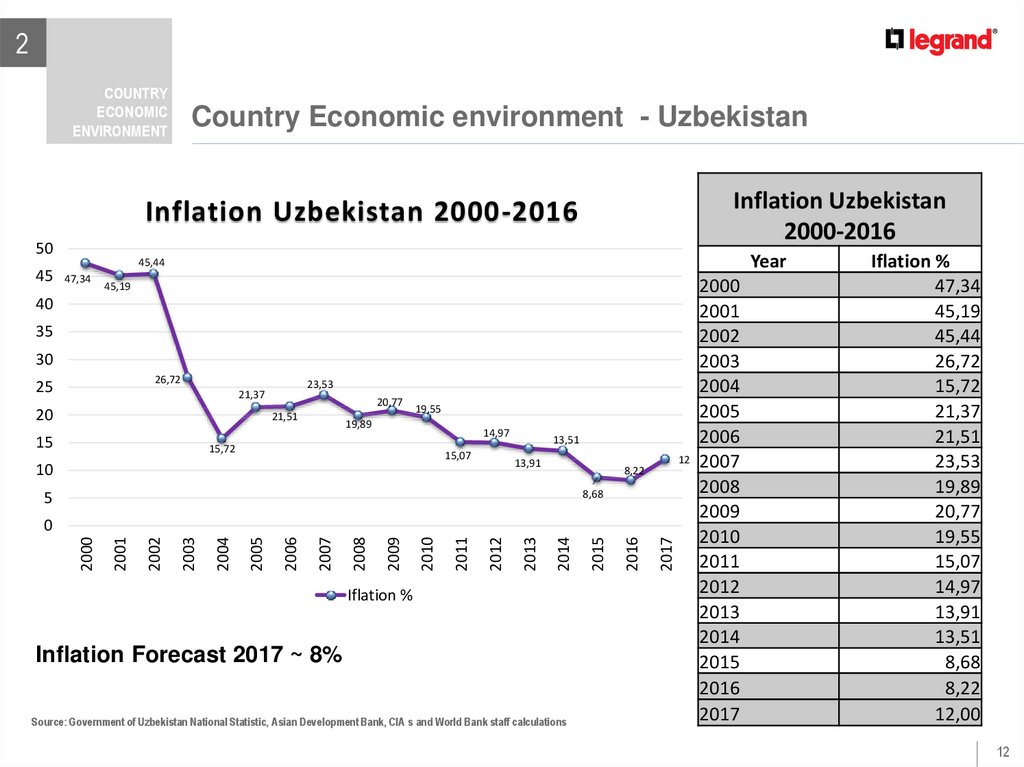
Country Economic environment - Uzbekistan
Inflation Uzbekistan
2000-2016
Inflation Uzbekistan 2000-2016
50
45
Year
45,44
47,34
45,19
40
35
30
26,72
25
23,53
21,37
20
20,77
21,51
15
19,55
19,89
14,97
15,72
15,07
13,51
13,91
10
12
8,22
8,68
5
Iflation %
Inflation Forecast 2017 ~ 8%
Source: Government of Uzbekistan National Statistic, Asian Development Bank, CIA s and World Bank staff calculations
2017
2016
2015
2014
2013
2012
2011
2010
2009
2008
2007
2006
2005
2004
2003
2002
2001
2000
0
2000
2001
2002
2003
2004
2005
2006
2007
2008
2009
2010
2011
2012
2013
2014
2015
2016
2017
Iflation %
47,34
45,19
45,44
26,72
15,72
21,37
21,51
23,53
19,89
20,77
19,55
15,07
14,97
13,91
13,51
8,68
8,22
12,00
12
13.
2COUNTRY
ECONOMIC
ENVIRONMENT
Country Economic Environment
Country Economic environment - Uzbekistan
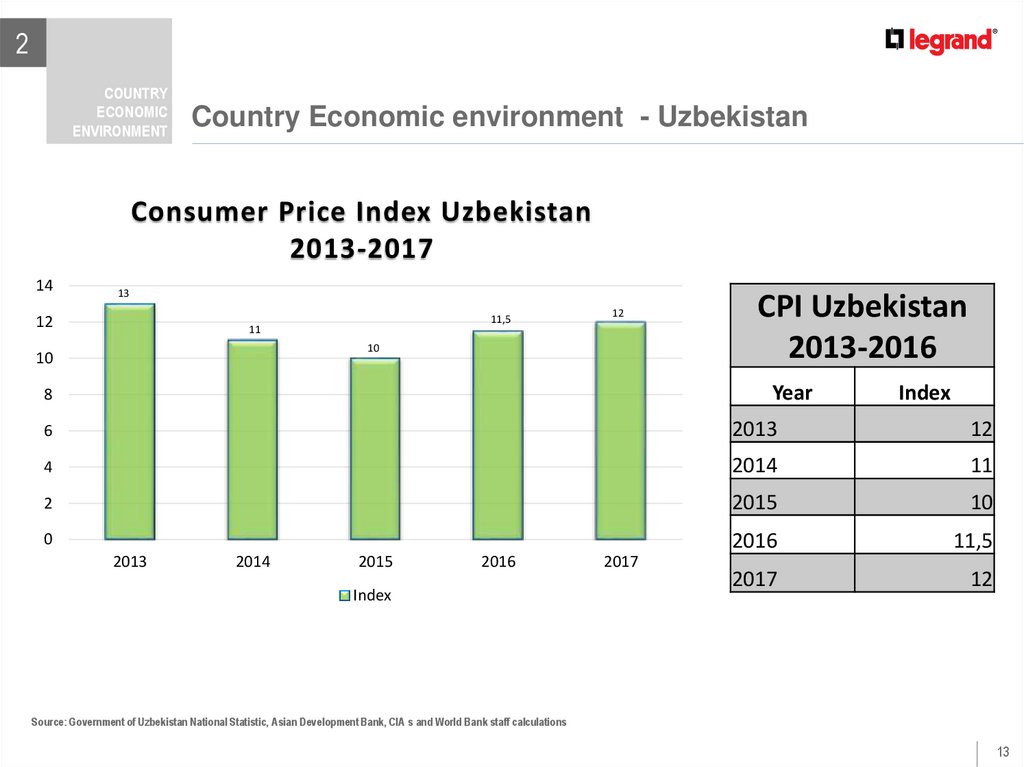
Consumer Price Index Uzbekistan
2013-2017
14
13
12
11,5
11
12
10
10
CPI Uzbekistan
2013-2016
Year
8
Index
6
2013
12
4
2014
11
2
2015
10
2016
11,5
2017
12
0
2013
2014
2015
2016
Index
2017
Source: Government of Uzbekistan National Statistic, Asian Development Bank, CIA s and World Bank staff calculations
13
14.
2COUNTRY
ECONOMIC
ENVIRONMENT
Country Economic Environment
Country Economic environment - Uzbekistan
Unemployment rate Uzbekistan
2005-2016
9,4
Year
9,3
9,2
%
9,1
9
8,9
8,8
8,7
8,6
Unemployment rate
Uzbekistan
2005-2016
2005 2006 2007 2008 2009 2010 2011 2012 2013 2014 2015 2016
% 9,343 9,343 9,337 9,234 9,298 9,255 9,198 9,126 9,046 8,962 8,918 8,895
Unemployment rate Forecast 2017 ~ 4,5%
Source: Government of Uzbekistan National Statistic, Asian Development Bank, CIA s and World Bank staff calculations
2005
2006
2007
2008
2009
2010
2011
2012
2013
2014
2015
2016
%
9,343
9,343
9,337
9,234
9,298
9,255
9,198
9,126
9,046
8,962
8,918
8,895
14
15.
2COUNTRY
ECONOMIC
ENVIRONMENT
Country Economic Environment
Country Economic environment - Uzbekistan
Industrial production growth rate
Uzbekistan
2005-2016
Industrial production
growth rate
Uzbekistan 2005-2016
Year
14
12
10
%
8
6
4
2
0
%
2005 2006 2007 2008 2009 2010 2011 2012 2013 2014 2015 2016
7,7
10,8
12,1
12,7
6,7
8
0
7,7
7,1
6,2
4,1
Industrial production growth rate Forecast 2017 ~ 7,4%
5,2
2005
2006
2007
2008
2009
2010
2011
2012
2013
2014
2015
2016
%
7,7
10,8
12,1
12,7
6,7
8
0
7,7
7,1
6,2
4,1
5,2
Source: Government of Uzbekistan National Statistic, Asian Development Bank, CIA s and World Bank staff calculations
15
16.
2COUNTRY
ECONOMIC
ENVIRONMENT
Country Economic Environment
Country Economic environment - Uzbekistan
Exchange rate $/UZS
Uzbekistan
Jan-Sept 2016
9000
9000
8000
8000
7000
7000
6000
6000
5000
5000
UZS
UZS
Exchange rate $/UZS
Uzbekistan
2010-2016
4000
4000
3000
3000
2000
2000
1000
1000
0
2010
2011
2012
2013
2014
2015
2016
rate $ / UZS 1617,32 1746,6 1934,37 2152,51 2363,47 2610,89 3010,2
0
2017
8000
rate $ / UZS
Jan
Feb
Mar
Apr
May
June
July
Aug
Sep
3277
3425
3617
3703
3845
3954
4096
4201
8073
Source: Government of Uzbekistan National Statistic, Asian Development Bank, CIA s and World Bank staff calculations
16
17.
2COUNTRY
ECONOMIC
ENVIRONMENT
Country Economic Environment
Country Economic environment - Uzbekistan
Apartments
Unit
Education
Bln. Sum
Civil engineering
Bln. Sum
НАЗВАНИЕ ДИАГРАММЫ
Medical
Bln. Sum
41 607
478,12
337,7
527
Overhaul and repair
27%
New construction
and renovation
70%
Other contract work
3%
Investments in housing construction 3,272 trln Sum.
Source: Government of Uzbekistan National Statistic, Asian Development Bank, CIA s and World Bank staff calculations
17
18.
3MARKET UPDATE AND
SALES PERFORMANCE
Uzbekistan
18
19.
3MARKET UPDATE
& SALES
PERFORMANCE
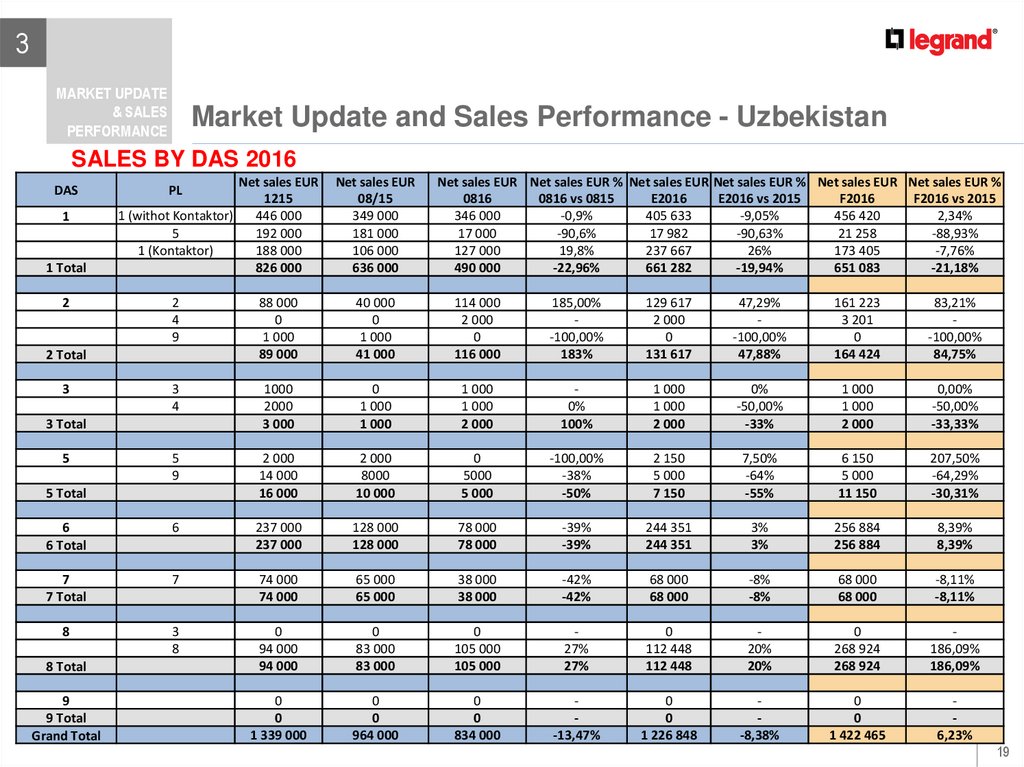
Market Update and Sales Performance - Uzbekistan
SALES BY DAS 2016
DAS
1
1 Total
Net sales EUR
1215
1 (withot Kontaktor)
446 000
5
192 000
1 (Kontaktor)
188 000
826 000
PL
Net sales EUR
08/15
349 000
181 000
106 000
636 000
Net sales EUR Net sales EUR % Net sales EUR Net sales EUR % Net sales EUR Net sales EUR %
0816
0816 vs 0815
E2016
E2016 vs 2015
F2016
F2016 vs 2015
346 000
-0,9%
405 633
-9,05%
456 420
2,34%
17 000
-90,6%
17 982
-90,63%
21 258
-88,93%
127 000
19,8%
237 667
26%
173 405
-7,76%
490 000
-22,96%
661 282
-19,94%
651 083
-21,18%
2
4
9
88 000
0
1 000
89 000
40 000
0
1 000
41 000
114 000
2 000
0
116 000
185,00%
-100,00%
183%
129 617
2 000
0
131 617
47,29%
-100,00%
47,88%
161 223
3 201
0
164 424
83,21%
-100,00%
84,75%
3
4
1000
2000
3 000
0
1 000
1 000
1 000
1 000
2 000
0%
100%
1 000
1 000
2 000
0%
-50,00%
-33%
1 000
1 000
2 000
0,00%
-50,00%
-33,33%
5
9
2 000
14 000
16 000
2 000
8000
10 000
0
5000
5 000
-100,00%
-38%
-50%
2 150
5 000
7 150
7,50%
-64%
-55%
6 150
5 000
11 150
207,50%
-64,29%
-30,31%
6
6 Total
6
237 000
237 000
128 000
128 000
78 000
78 000
-39%
-39%
244 351
244 351
3%
3%
256 884
256 884
8,39%
8,39%
7
7 Total
7
74 000
74 000
65 000
65 000
38 000
38 000
-42%
-42%
68 000
68 000
-8%
-8%
68 000
68 000
-8,11%
-8,11%
8
3
8
8 Total
0
94 000
94 000
0
83 000
83 000
0
105 000
105 000
27%
27%
0
112 448
112 448
20%
20%
0
268 924
268 924
186,09%
186,09%
9
9 Total
Grand Total
0
0
1 339 000
0
0
964 000
0
0
834 000
-13,47%
0
0
1 226 848
-8,38%
0
0
1 422 465
6,23%
2
2 Total
3
3 Total
5
5 Total
19
20.
3MARKET UPDATE
& SALES
PERFORMANCE
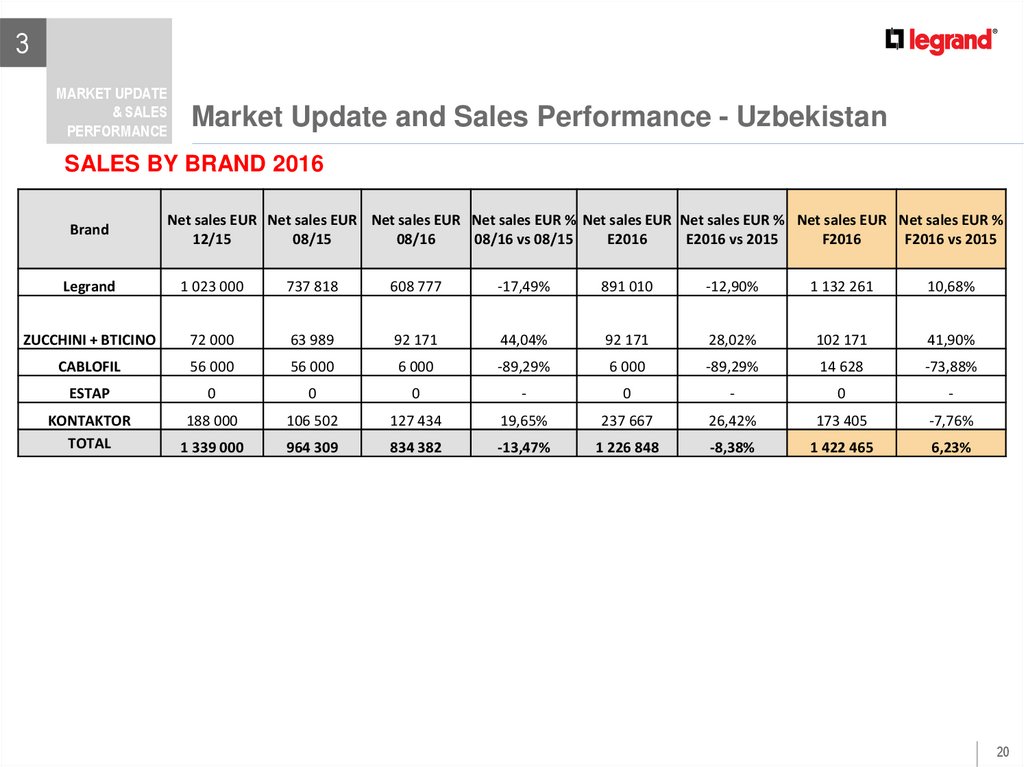
Market Update and Sales Performance - Uzbekistan
SALES BY BRAND 2016
Brand
Net sales EUR Net sales EUR Net sales EUR Net sales EUR % Net sales EUR Net sales EUR % Net sales EUR Net sales EUR %
12/15
08/15
08/16
08/16 vs 08/15
E2016
E2016 vs 2015
F2016
F2016 vs 2015
Legrand
1 023 000
737 818
608 777
-17,49%
891 010
-12,90%
1 132 261
10,68%
ZUCCHINI + BTICINO
72 000
63 989
92 171
44,04%
92 171
28,02%
102 171
41,90%
CABLOFIL
56 000
56 000
6 000
-89,29%
6 000
-89,29%
14 628
-73,88%
ESTAP
0
0
0
-
0
-
0
-
KONTAKTOR
TOTAL
188 000
106 502
127 434
19,65%
237 667
26,42%
173 405
-7,76%
1 339 000
964 309
834 382
-13,47%
1 226 848
-8,38%
1 422 465
6,23%
20
21.
3MARKET UPDATE
& SALES
PERFORMANCE
Market Update and Sales Performance - Uzbekistan
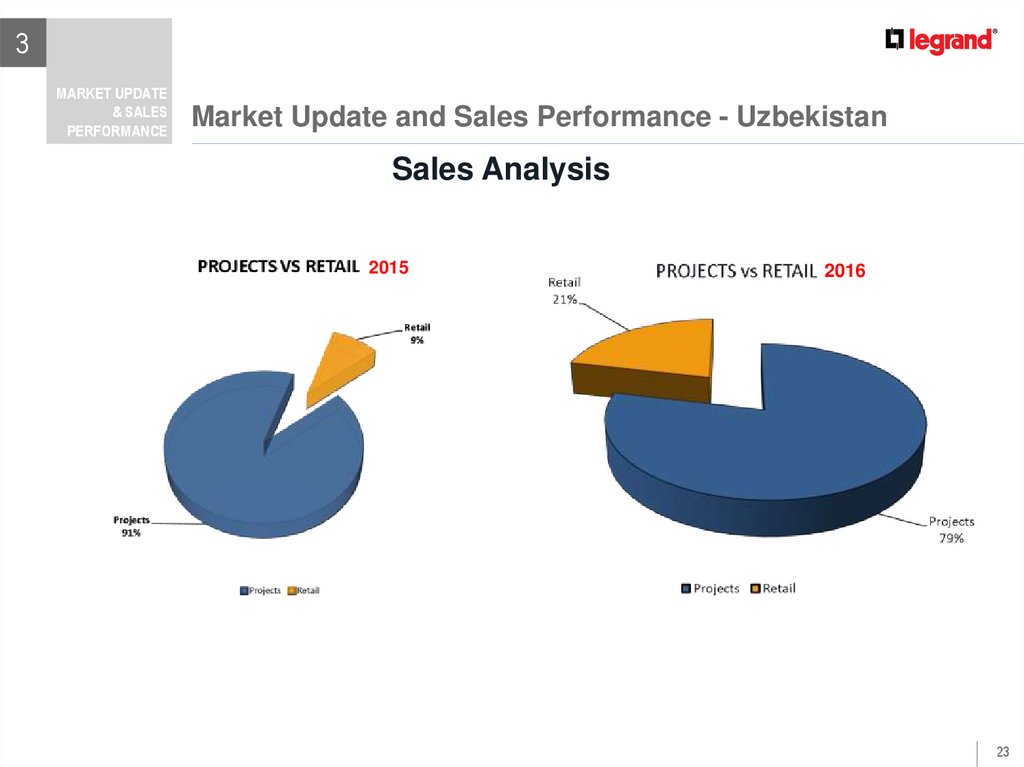
Sales Analysis
21
22.
3MARKET UPDATE
& SALES
PERFORMANCE
Market Update and Sales Performance - Uzbekistan
Sales Analysis
SALES BY BRAND
Registered Orders 08.2016
Shipped Orders 08.2016
BRAND
Amount
BRAND
%
Amount
%
Legrand
608 777 €
73%
Legrand
635 593 €
75%
Zucchini
88 442 €
11%
Ortronics
30 725 €
4%
Cablofil
6 000 €
1%
Cablofil
9 395 €
1%
127 434 €
14,5%
Minkels
164 207 €
18,5%
3 729 €
0,5%
Raritan
4 842 €
1%
Bticino
700 €
0,5%
Kontaktor
Bticino
TOTAL 834 382 €
TOTAL
845 462 €
Total shipped and registered orders 08.2016: 1 679 844 €
22
23.
3MARKET UPDATE
& SALES
PERFORMANCE
Market Update and Sales Performance - Uzbekistan
Sales Analysis
2015
2016
23
24.
3MARKET UPDATE
& SALES
PERFORMANCE
Market Update and Sales Performance - Uzbekistan
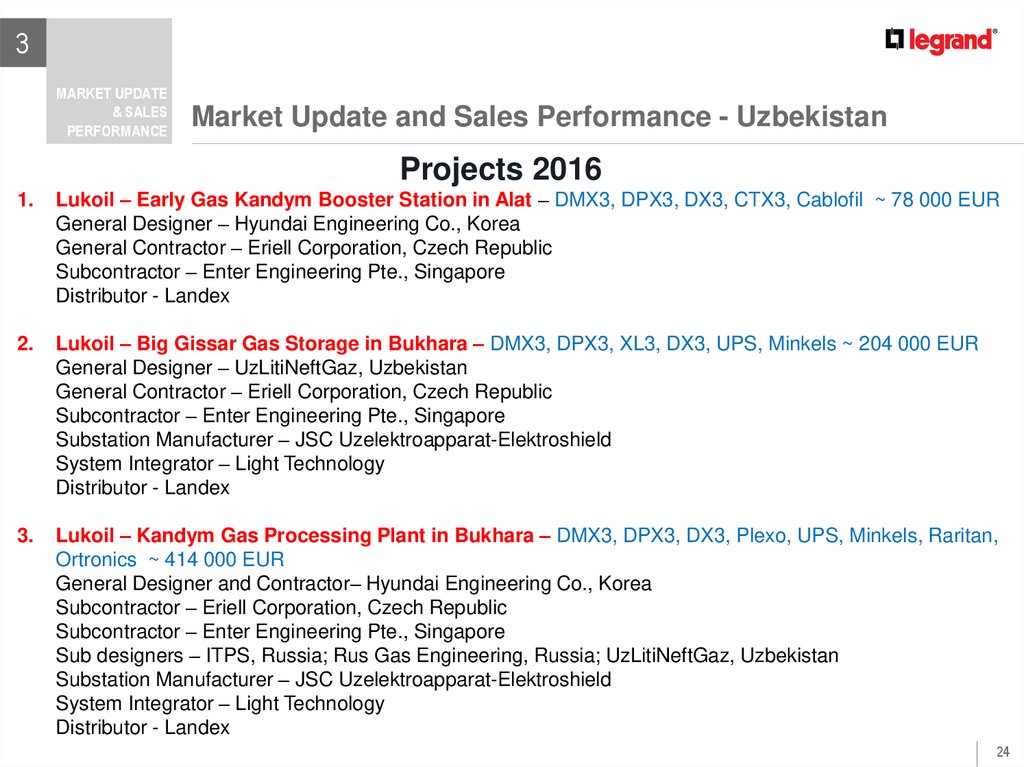
Projects 2016
1.
Lukoil – Early Gas Kandym Booster Station in Alat – DMX3, DPX3, DX3, CTX3, Cablofil ~ 78 000 EUR
General Designer – Hyundai Engineering Co., Korea
General Contractor – Eriell Corporation, Czech Republic
Subcontractor – Enter Engineering Pte., Singapore
Distributor - Landex
2.
Lukoil – Big Gissar Gas Storage in Bukhara – DMX3, DPX3, XL3, DX3, UPS, Minkels ~ 204 000 EUR
General Designer – UzLitiNeftGaz, Uzbekistan
General Contractor – Eriell Corporation, Czech Republic
Subcontractor – Enter Engineering Pte., Singapore
Substation Manufacturer – JSC Uzelektroapparat-Elektroshield
System Integrator – Light Technology
Distributor - Landex
3.
Lukoil – Kandym Gas Processing Plant in Bukhara – DMX3, DPX3, DX3, Plexo, UPS, Minkels, Raritan,
Ortronics ~ 414 000 EUR
General Designer and Contractor– Hyundai Engineering Co., Korea
Subcontractor – Eriell Corporation, Czech Republic
Subcontractor – Enter Engineering Pte., Singapore
Sub designers – ITPS, Russia; Rus Gas Engineering, Russia; UzLitiNeftGaz, Uzbekistan
Substation Manufacturer – JSC Uzelektroapparat-Elektroshield
System Integrator – Light Technology
Distributor - Landex
24
25.
3MARKET UPDATE
& SALES
PERFORMANCE
Market Update and Sales Performance - Uzbekistan
Projects 2016
4.
Lukoil - Kandym Rotation Town for employees – Valena, DLP, Mosaic, DX3, TX3, Plexo, Atlantic,
Cablofil ~ 70 000 EUR
General Designer – UzLitiNeftGaz, Uzbekistan
General Contractor – Eriell Corporation, Czech Republic
Subcontractor – Enter Engineering Pte., Singapore
Distributor - Landex
5.
Cabinet of the Ministry of the republic of Uzbekistan – LCS2 Legrand = 89 000 EUR
General Contractor: Trest 12, Uzbekistan
General Designer – Tash Gipro Gor, Uzbekistan
Subcontractor – Aspell, Uzbekistan
Distributor – Mirax Qurilish Servis
6.
Tashkent Tractor Plant – Zucchini Busbars, DMX3, DPX3 (Contract stage) ~ 110 000 EUR
Customer – Uz Auto – The Ministry of the automotive industry of Uzbekistan
General Contractor – Fergana Montaj Avtomatika, Uzbekistan
General Designer – UzTyajProm, Uzbekistan
Distributor - Landex
25
26.
3MARKET UPDATE
& SALES
PERFORMANCE
Market Update and Sales Performance - Uzbekistan
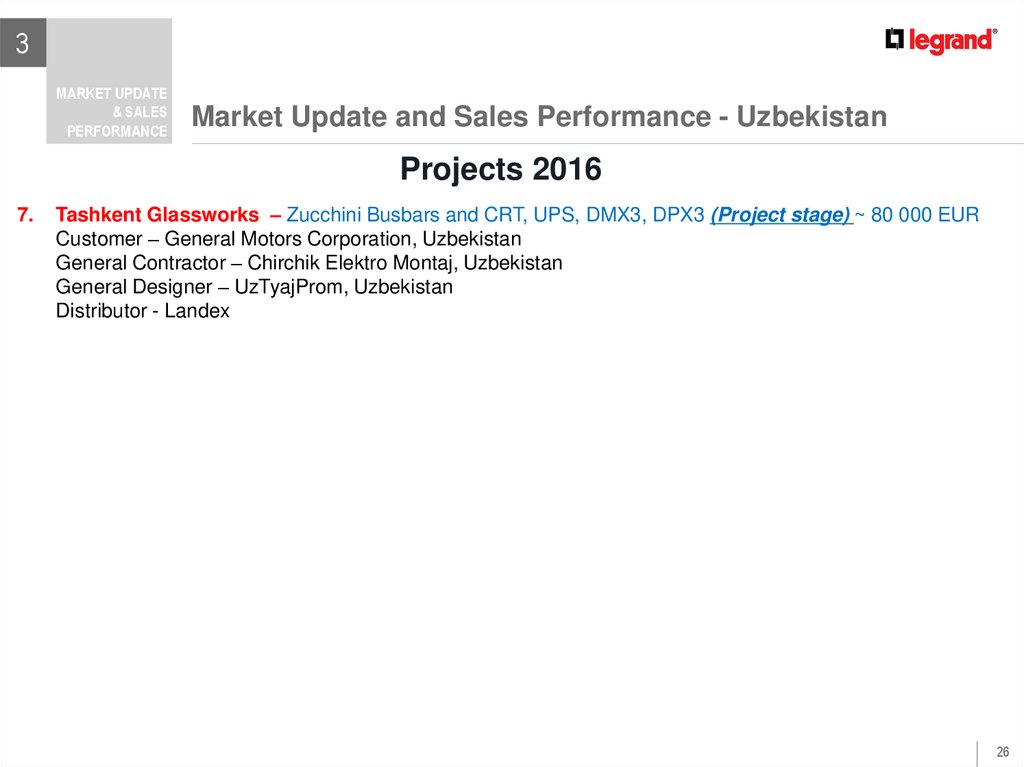
Projects 2016
7.
Tashkent Glassworks – Zucchini Busbars and CRT, UPS, DMX3, DPX3 (Project stage) ~ 80 000 EUR
Customer – General Motors Corporation, Uzbekistan
General Contractor – Chirchik Elektro Montaj, Uzbekistan
General Designer – UzTyajProm, Uzbekistan
Distributor - Landex
26
27.
3MARKET UPDATE
& SALES
PERFORMANCE
Market Update and Sales Performance - Uzbekistan
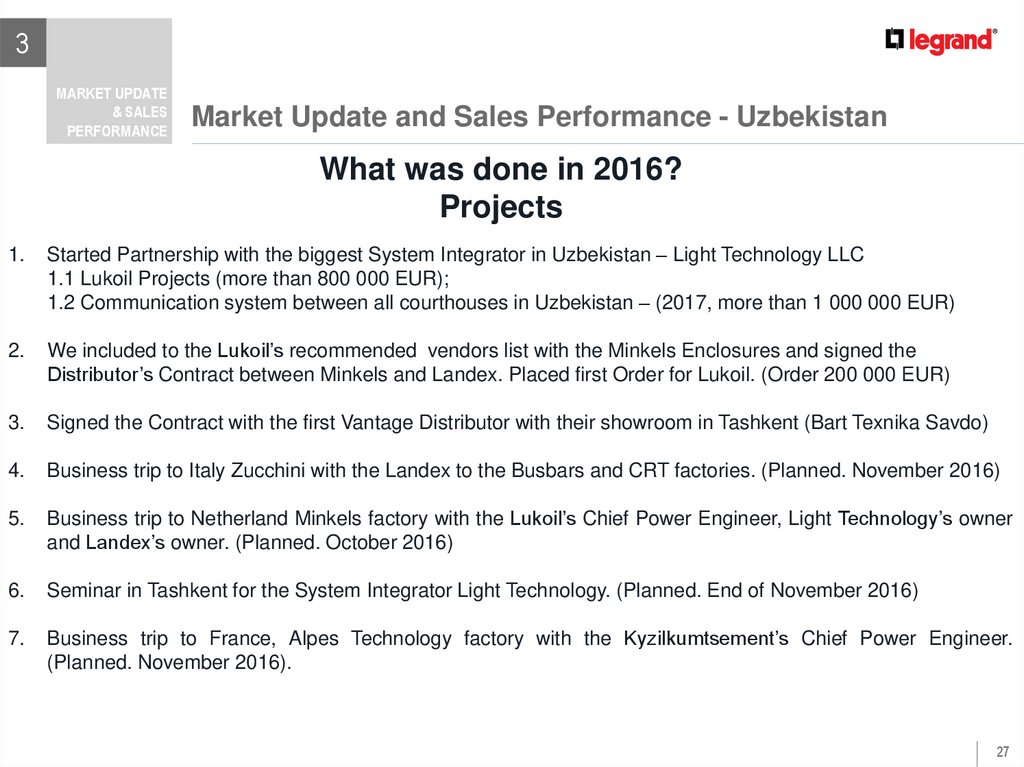
What was done in 2016?
Projects
1.
Started Partnership with the biggest System Integrator in Uzbekistan – Light Technology LLC
1.1 Lukoil Projects (more than 800 000 EUR);
1.2 Communication system between all courthouses in Uzbekistan – (2017, more than 1 000 000 EUR)
2.
We included to the Lukoil’s recommended vendors list with the Minkels Enclosures and signed the
Distributor’s Contract between Minkels and Landex. Placed first Order for Lukoil. (Order 200 000 EUR)
3.
Signed the Contract with the first Vantage Distributor with their showroom in Tashkent (Bart Texnika Savdo)
4.
Business trip to Italy Zucchini with the Landex to the Busbars and CRT factories. (Planned. November 2016)
5.
Business trip to Netherland Minkels factory with the Lukoil’s Chief Power Engineer, Light Technology’s owner
and Landex’s owner. (Planned. October 2016)
6.
Seminar in Tashkent for the System Integrator Light Technology. (Planned. End of November 2016)
7.
Business trip to France, Alpes Technology factory with the Kyzilkumtsement’s Chief Power Engineer.
(Planned. November 2016).
27
28.
3MARKET UPDATE
& SALES
PERFORMANCE
Market Update and Sales Performance - Uzbekistan
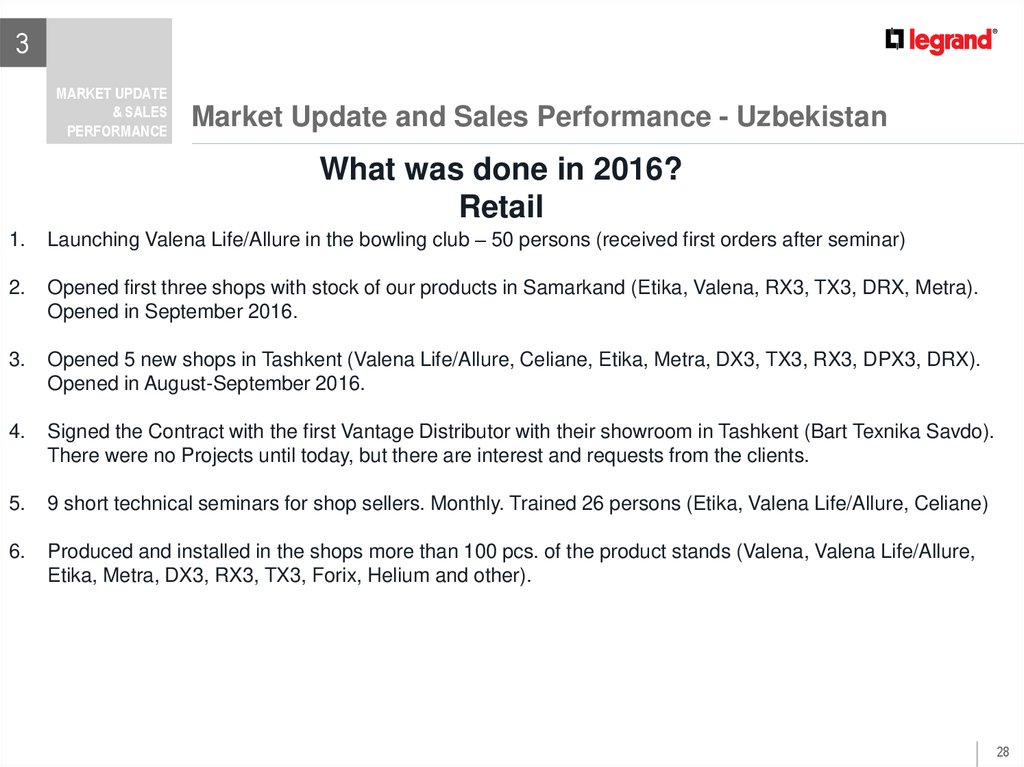
What was done in 2016?
Retail
1.
Launching Valena Life/Allure in the bowling club – 50 persons (received first orders after seminar)
2.
Opened first three shops with stock of our products in Samarkand (Etika, Valena, RX3, TX3, DRX, Metra).
Opened in September 2016.
3.
Opened 5 new shops in Tashkent (Valena Life/Allure, Celiane, Etika, Metra, DX3, TX3, RX3, DPX3, DRX).
Opened in August-September 2016.
4.
Signed the Contract with the first Vantage Distributor with their showroom in Tashkent (Bart Texnika Savdo).
There were no Projects until today, but there are interest and requests from the clients.
5.
9 short technical seminars for shop sellers. Monthly. Trained 26 persons (Etika, Valena Life/Allure, Celiane)
6.
Produced and installed in the shops more than 100 pcs. of the product stands (Valena, Valena Life/Allure,
Etika, Metra, DX3, RX3, TX3, Forix, Helium and other).
28
29.
2Tajikistan
29
30.
2COUNTRY
ECONOMIC
ENVIRONMENT
Country Economic Environment
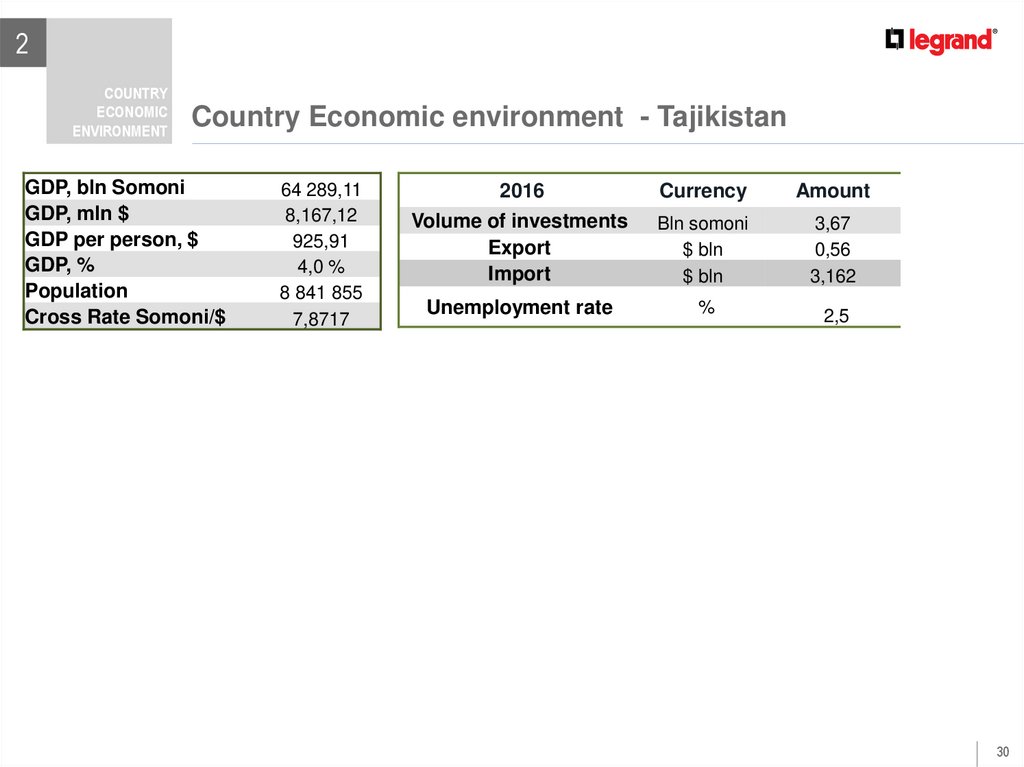
Country Economic environment - Tajikistan
GDP, bln Somoni
GDP, mln $
GDP per person, $
GDP, %
Population
Cross Rate Somoni/$
64 289,11
8,167,12
925,91
4,0 %
8 841 855
7,8717
2016
Currency
Amount
Volume of investments
Export
Import
Bln somoni
$ bln
$ bln
3,67
0,56
3,162
Unemployment rate
%
2,5
30
31.
2COUNTRY
ECONOMIC
ENVIRONMENT
Country Economic Environment
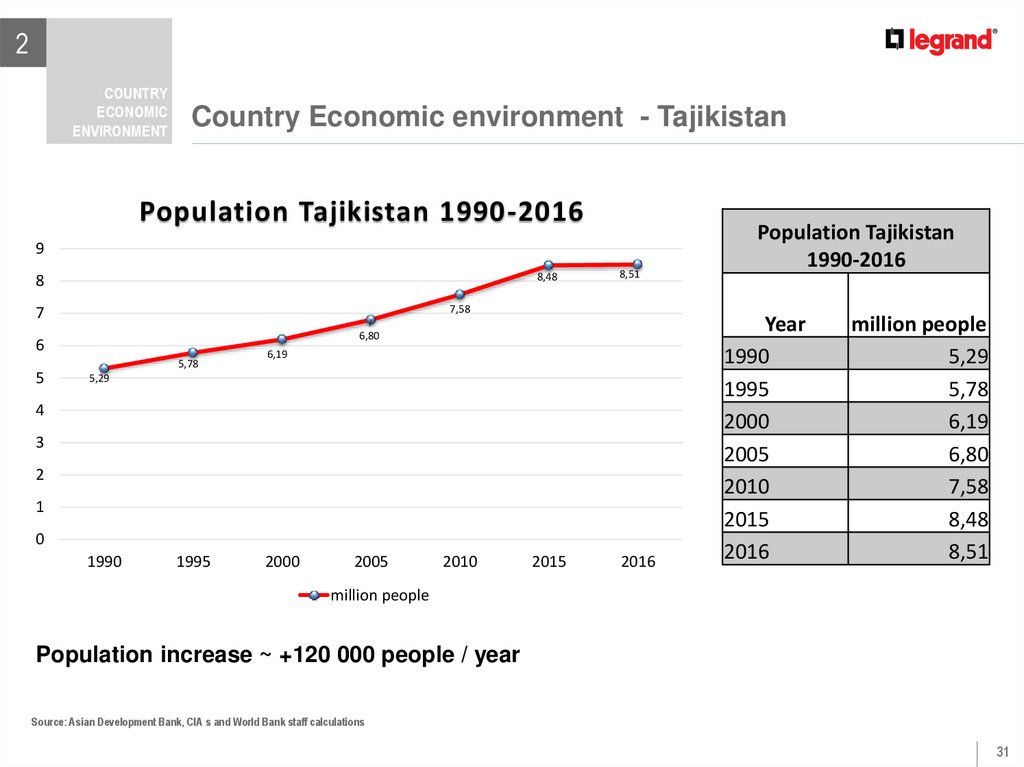
Country Economic environment - Tajikistan
Population Tajikistan 1990-2016
9
8,48
8
7,58
7
6,80
6
5
8,51
5,78
6,19
5,29
4
3
2
1
0
1990
1995
2000
2005
2010
2015
2016
Population Tajikistan
1990-2016
Year
1990
1995
2000
2005
2010
2015
2016
million people
5,29
5,78
6,19
6,80
7,58
8,48
8,51
million people
Population increase ~ +120 000 people / year
Source: Asian Development Bank, CIA s and World Bank staff calculations
31
32.
2Country Economic Environment
COUNTRY
ECONOMIC
ENVIRONMENT
Country Economic environment - Tajikistan
GDB Tajikistan
2000-2016
Year
Billion $
GDP Tajikistan 2000-2016
10
9
8
7
6
5
4
3
2
1
0
9,24
8,51
7,63
6,52
5,16 4,98
3,72
2,83
2,07
0,86
1,08 1,22
2,31
1,55
Billion $
5,64
7,85
8,16
2000
2001
2002
2003
2004
2005
2006
2007
2008
2009
2010
2011
2012
2013
2014
2015
2016 (+4%)
0,86
1,08
1,22
1,55
2,07
2,31
2,83
3,72
5,16
4,98
5,64
6,52
7,63
8,51
9,24
7,85
8,16
GDP Forecast 2017 ~ +4,8%
Source: Asian Development Bank, CIA s and World Bank staff calculations
32
33.
2COUNTRY
ECONOMIC
ENVIRONMENT
Country Economic Environment
Country Economic environment - Tajikistan
Inflation Tajikistan 2000-2016
Inflation Tajikistan
2000-2016
Year
Iflation %
35
30
30,21
28,16
26,99
25
20
27,24
22,69
18,82
21,06
17,52
15
12,23
12,46
13,32
9,51
10
11,87
5,84
5,46
5
5,71
4,35
Iflation %
Inflation Forecast 2017 ~ 6,5%
2016
2015
2014
2013
2012
2011
2010
2009
2008
2007
2006
2005
2004
2003
2002
2001
2000
0
2000
2001
2002
2003
2004
2005
2006
2007
2008
2009
2010
2011
2012
2013
2014
2015
22,69
30,21
18,82
26,99
17,52
9,51
21,06
27,24
28,16
12,23
12,46
13,32
11,87
4,35
5,46
5,71
2016
5,84
Source: Asian Development Bank, CIA s and World Bank staff calculations
33
34.
2COUNTRY
ECONOMIC
ENVIRONMENT
Country Economic Environment
Country Economic environment - Tajikistan
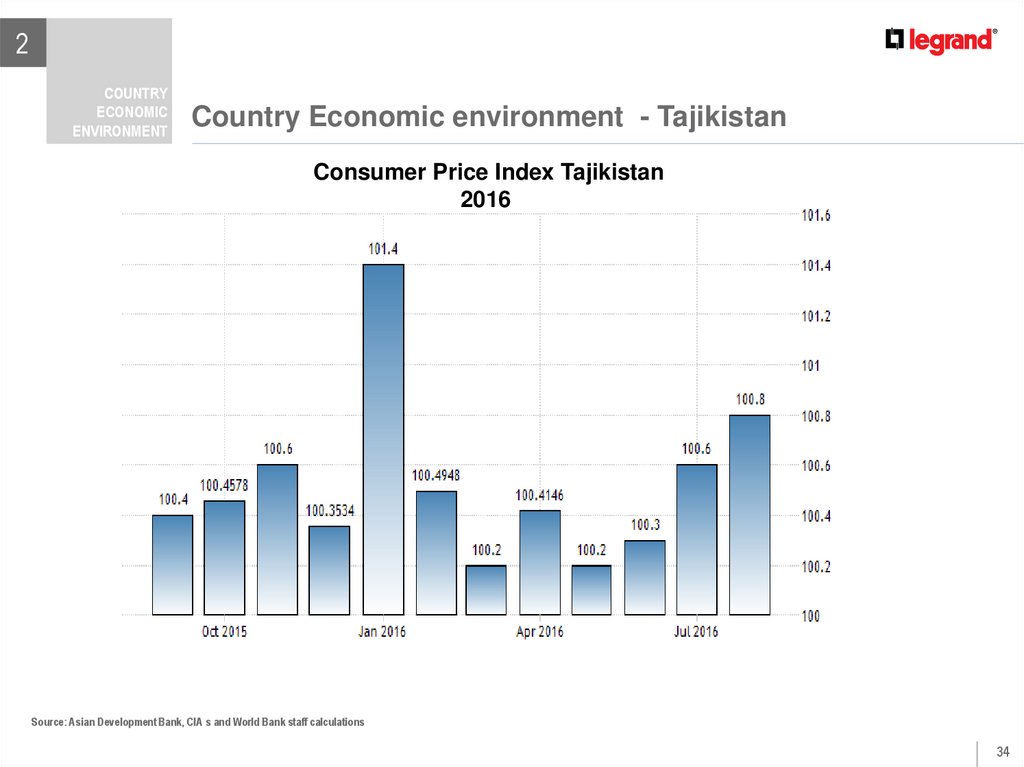
Consumer Price Index Tajikistan
2016
Source: Asian Development Bank, CIA s and World Bank staff calculations
34
35.
2COUNTRY
ECONOMIC
ENVIRONMENT
Country Economic Environment
Country Economic environment - Tajikistan
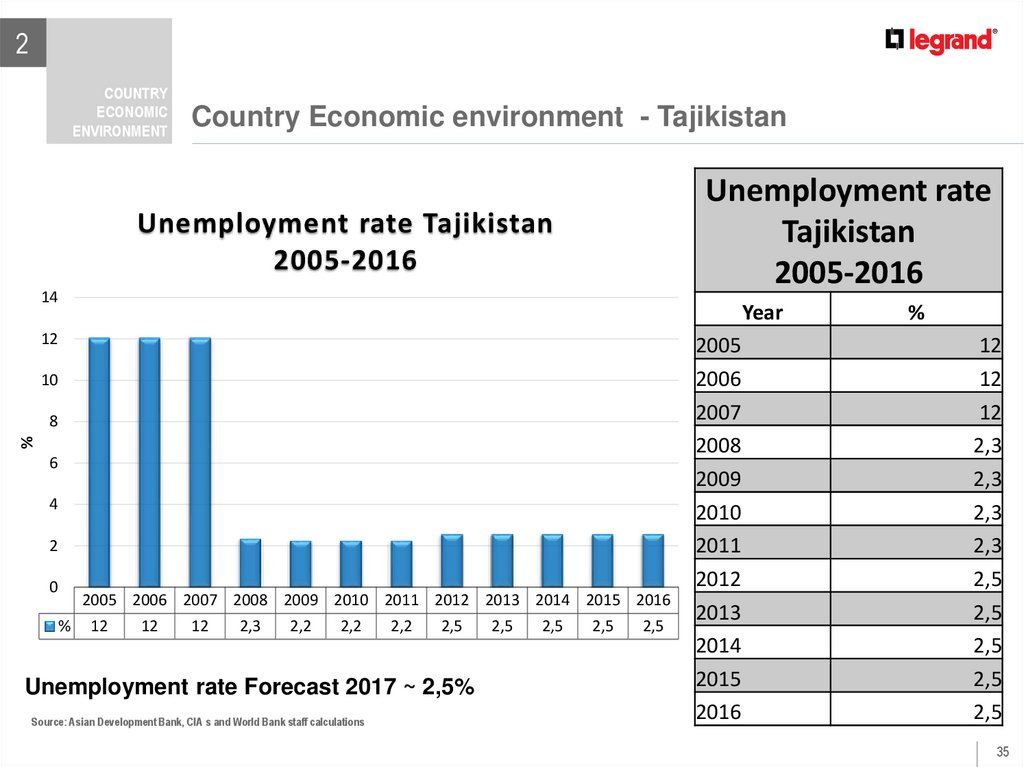
Unemployment rate
Tajikistan
2005-2016
Unemployment rate Tajikistan
2005-2016
14
Year
12
10
%
8
6
4
2
0
%
2005 2006 2007 2008 2009 2010 2011 2012 2013 2014 2015 2016
12
12
12
2,3
2,2
2,2
2,2
2,5
Unemployment rate Forecast 2017 ~ 2,5%
Source: Asian Development Bank, CIA s and World Bank staff calculations
2,5
2,5
2,5
2,5
2005
2006
2007
2008
2009
2010
2011
2012
2013
2014
2015
2016
%
12
12
12
2,3
2,3
2,3
2,3
2,5
2,5
2,5
2,5
2,5
35
36.
2COUNTRY
ECONOMIC
ENVIRONMENT
Country Economic Environment
Country Economic environment - Tajikistan
Unemployment rate
Tajikistan
2005-2016
Unemployment rate Tajikistan
2005-2016
14
Year
12
10
%
8
6
4
2
0
%
2005 2006 2007 2008 2009 2010 2011 2012 2013 2014 2015 2016
12
12
12
2,3
2,2
2,2
2,2
2,5
Unemployment rate Forecast 2017 ~ 2,5%
Source: Asian Development Bank, CIA s and World Bank staff calculations
2,5
2,5
2,5
2,5
2005
2006
2007
2008
2009
2010
2011
2012
2013
2014
2015
2016
%
12
12
12
2,3
2,3
2,3
2,3
2,5
2,5
2,5
2,5
2,5
36
37.
2COUNTRY
ECONOMIC
ENVIRONMENT
Country Economic Environment
Country Economic environment - Tajikistan
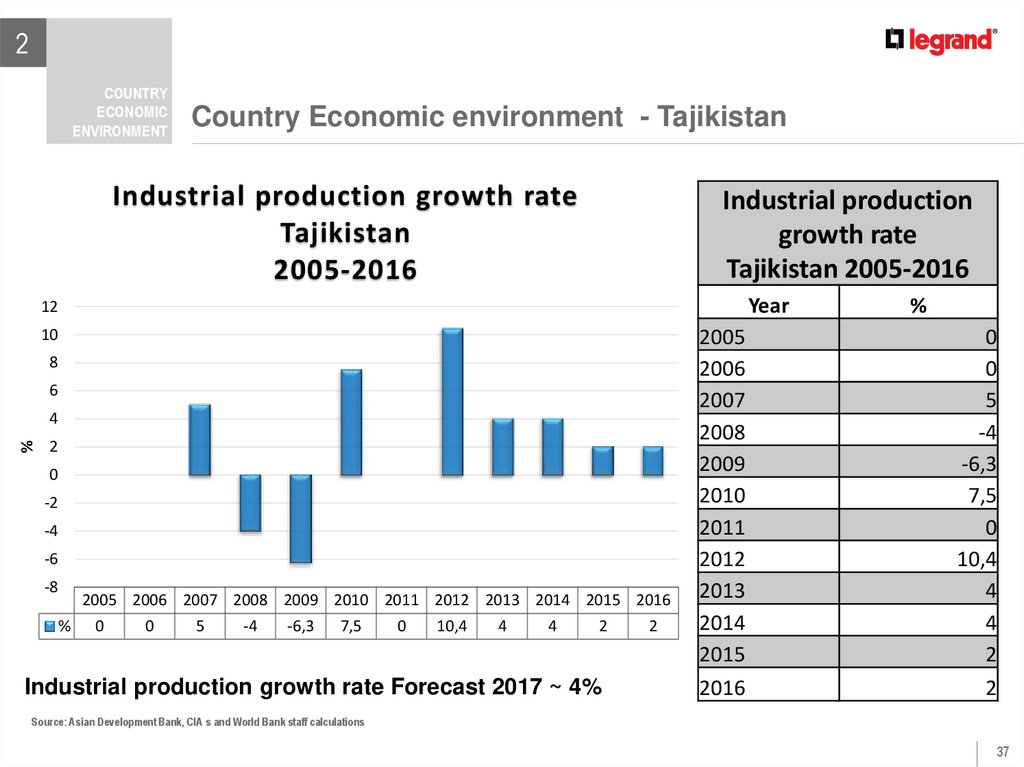
Industrial production growth rate
Tajikistan
2005-2016
Industrial production
growth rate
Tajikistan 2005-2016
Year
12
10
8
6
%
4
2
0
-2
-4
-6
-8
%
2005 2006 2007 2008 2009 2010 2011 2012 2013 2014 2015 2016
0
0
5
-4
-6,3
7,5
0
10,4
4
4
2
Industrial production growth rate Forecast 2017 ~ 4%
2
2005
2006
2007
2008
2009
2010
2011
2012
2013
2014
2015
2016
%
0
0
5
-4
-6,3
7,5
0
10,4
4
4
2
2
Source: Asian Development Bank, CIA s and World Bank staff calculations
37
38.
2COUNTRY
ECONOMIC
ENVIRONMENT
Country Economic Environment
Country Economic environment - Tajikistan
Source: Asian Development Bank, CIA s and World Bank staff calculations
38
39.
3MARKET UPDATE AND
SALES PERFORMANCE
Tajikistan
39
40.
3MARKET UPDATE
& SALES
PERFORMANCE
Market Update and Sales Performance - Tajikistan
SALES BY DAS 2016
DAS
1
1 Total
2
Net sales EUR
1215
1 (withot Kontaktor)
10 000
5
1 000
1 (Kontaktor)
0
11 000
PL
Net sales EUR
08/15
10 000
1 000
0
11 000
Net sales EUR Net sales EUR % Net sales EUR Net sales EUR % Net sales EUR Net sales EUR %
0816
0816 vs 0815
E2016
E2016 vs 2015
F2016
F2016 vs 2015
6 000
-40,0%
12 284
22,84%
21 580
115,80%
0
-100,0%
0
-100,00%
0
0
0
0
6 000
-45,45%
12 284
11,67%
21 580
11,67%
2
4
9
5 000
0
0
5 000
5 000
0
0
5 000
0
0
0
0
-100,00%
-100%
0
0
0
0
-100,00%
-100,00%
5 500
0
0
5 500
10,00%
10,00%
3
4
0
0
0
0
0
0
0
0
0
-
0
0
0
-
0
0
0
-
5
9
0
0
0
0
0
0
0
0
0
-
0
0
0
-
0
0
0
-
6
6 Total
6
10 000
10 000
10 000
10 000
0
0
-100%
-100%
0
0
-100%
-100%
0
0
-100%
-100%
7
7 Total
7
19 000
19 000
19 000
19 000
2 000
2 000
-89%
-89%
0
0
-100%
-100%
0
0
-100%
-100%
8
3
8
8 Total
0
8 000
8 000
0
4 000
4 000
0
0
0
-100%
-100%
0
0
0
-100%
-100%
0
0
0
-100%
-100%
9
9 Total
Grand Total
0
0
53 000
0
0
49 000
0
0
8 000
-84%
0
0
12 284
-76,82%
0
0
27 080
-48,91%
2 Total
3
3 Total
5
5 Total
40
41.
3MARKET UPDATE
& SALES
PERFORMANCE
Market Update and Sales Performance - Tajikistan
SALES BY BRAND 2016
Brand
Net sales EUR Net sales Net sales EUR Net sales EUR % Net sales Net sales EUR % Net sales Net sales EUR %
12/15
EUR 08/15
08/16
08/16 vs 08/15 EUR E2016 E2016 vs 2015 EUR F2016 F2016 vs 2015
Legrand
49 000
49 000
8 000
-83,67%
12 284
-74,93%
27 080
-44,73%
ZUCCHINI +
BTICINO
0
0
0
-
0
-
0
-
CABLOFIL
0
0
0
-
0
-
0
-
ESTAP
4 000
0
0
-
0
-
0
-100,00%
KONTAKTOR
TOTAL
0
0
0
-
0
-
0
-
53 000
49 000
8 000
-83,67%
12 284
-76,82%
27 080
-48,91%
41
42.
3MARKET UPDATE
& SALES
PERFORMANCE
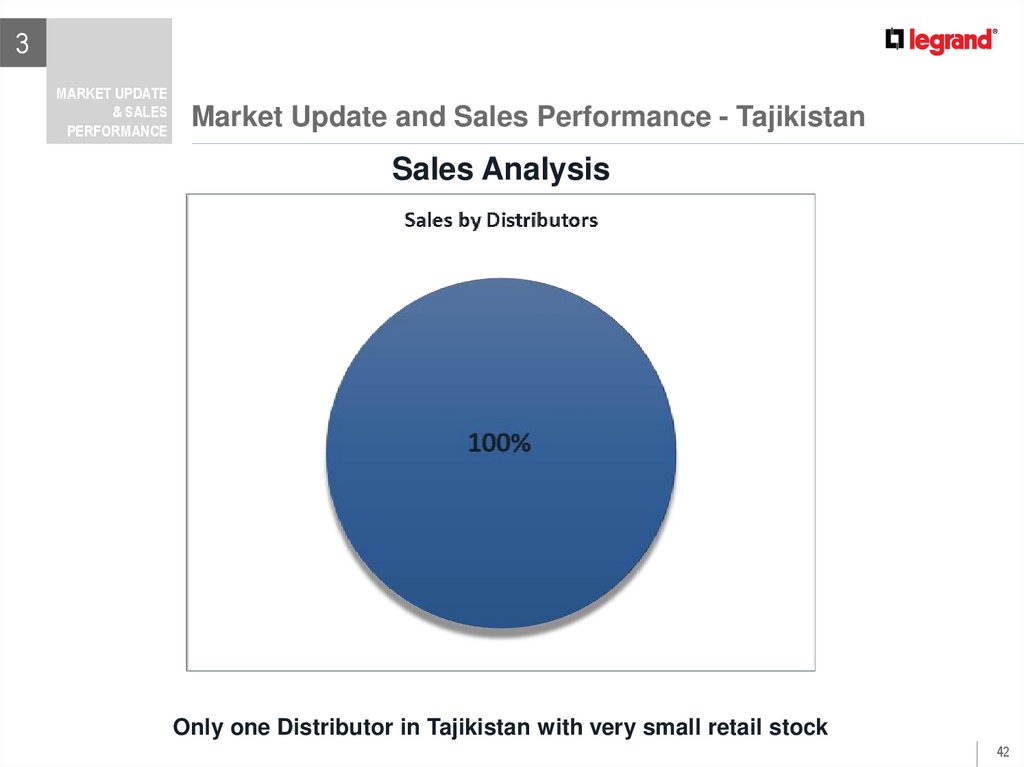
Market Update and Sales Performance - Tajikistan
Sales Analysis
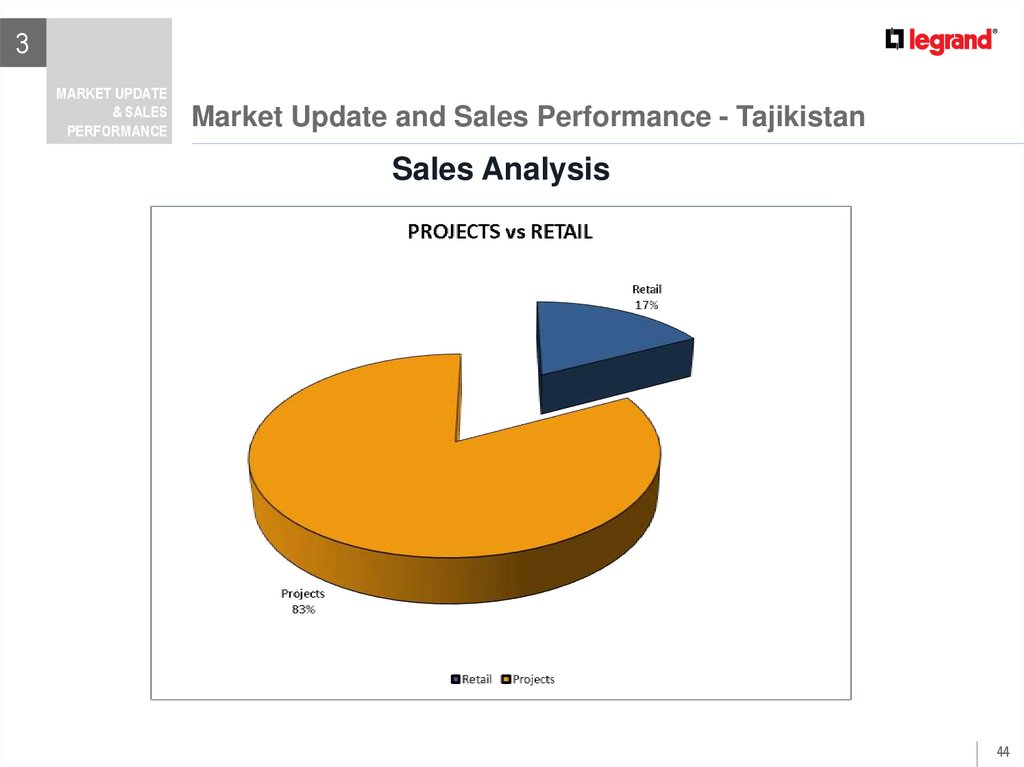
Only one Distributor in Tajikistan with very small retail stock
42
43.
3MARKET UPDATE
& SALES
PERFORMANCE
Market Update and Sales Performance - Tajikistan
Sales Analysis
SALES BY BRAND
Registered Orders 08.2016
Shipped Orders 08.2016
BRAND
Amount
Legrand
8 189 €
TOTAL
BRAND
%
73%
Amount
Legrand
8 189 €
10 580 €
TOTAL
%
100%
10 580 €
Total shipped and registered orders 08.2016: 18 769 €
43
44.
3MARKET UPDATE
& SALES
PERFORMANCE
Market Update and Sales Performance - Tajikistan
Sales Analysis
44
45.
3MARKET UPDATE
& SALES
PERFORMANCE
Market Update and Sales Performance - Tajikistan
Projects 2016
1.
Russian Embassy in Dushanbe, Tajikistan – Altis, DPX3, DX3, CTX. 10kEUR
45
46.
4B2017
Uzbekistan and
Tajikistan
46
47.
4B2017
Uzbekistan and
Tajikistan
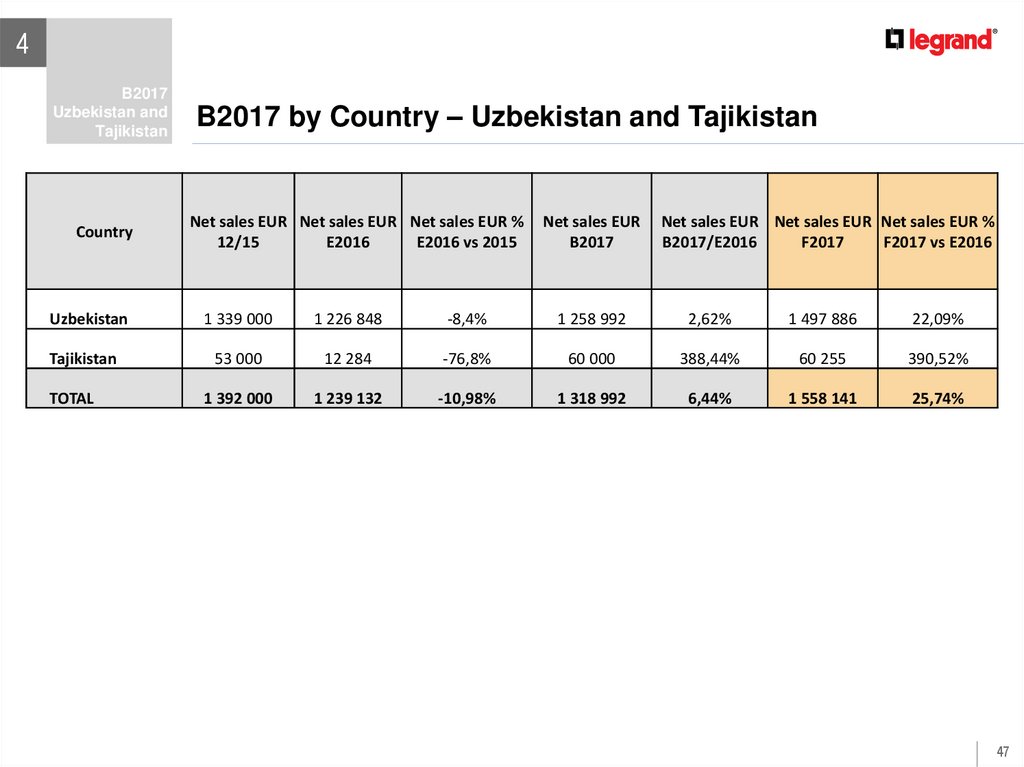
Country
Uzbekistan
Tajikistan
TOTAL
B2017 by Country – Uzbekistan and Tajikistan
Net sales EUR Net sales EUR Net sales EUR %
12/15
E2016
E2016 vs 2015
Net sales EUR
B2017
Net sales EUR Net sales EUR Net sales EUR %
B2017/E2016
F2017
F2017 vs E2016
1 339 000
1 226 848
-8,4%
1 258 992
2,62%
1 497 886
22,09%
53 000
12 284
-76,8%
60 000
388,44%
60 255
390,52%
1 392 000
1 239 132
-10,98%
1 318 992
6,44%
1 558 141
25,74%
47
48.
4B2017
Uzbekistan and
Tajikistan
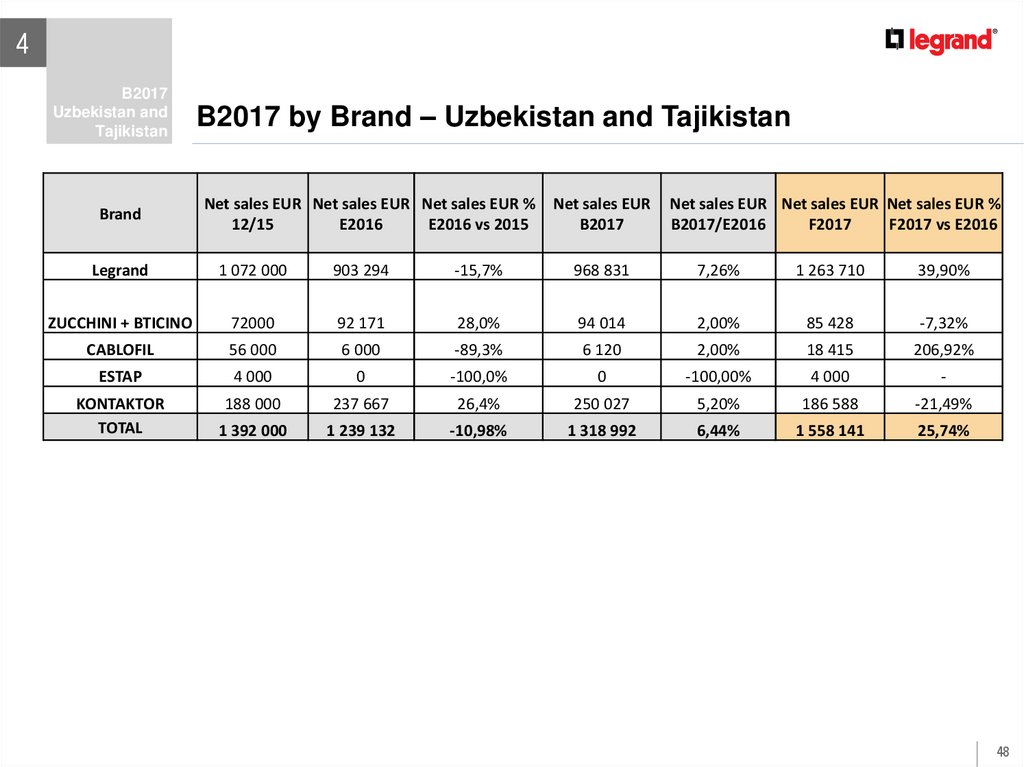
Brand
B2017 by Brand – Uzbekistan and Tajikistan
Net sales EUR Net sales EUR Net sales EUR %
12/15
E2016
E2016 vs 2015
Net sales EUR
B2017
Net sales EUR Net sales EUR Net sales EUR %
B2017/E2016
F2017
F2017 vs E2016
Legrand
1 072 000
903 294
-15,7%
968 831
7,26%
1 263 710
39,90%
ZUCCHINI + BTICINO
72000
92 171
28,0%
94 014
2,00%
85 428
-7,32%
CABLOFIL
56 000
6 000
-89,3%
6 120
2,00%
18 415
206,92%
ESTAP
4 000
0
-100,0%
0
-100,00%
4 000
-
KONTAKTOR
TOTAL
188 000
237 667
26,4%
250 027
5,20%
186 588
-21,49%
1 392 000
1 239 132
-10,98%
1 318 992
6,44%
1 558 141
25,74%
48
49.
4B2017
Uzbekistan and
Tajikistan
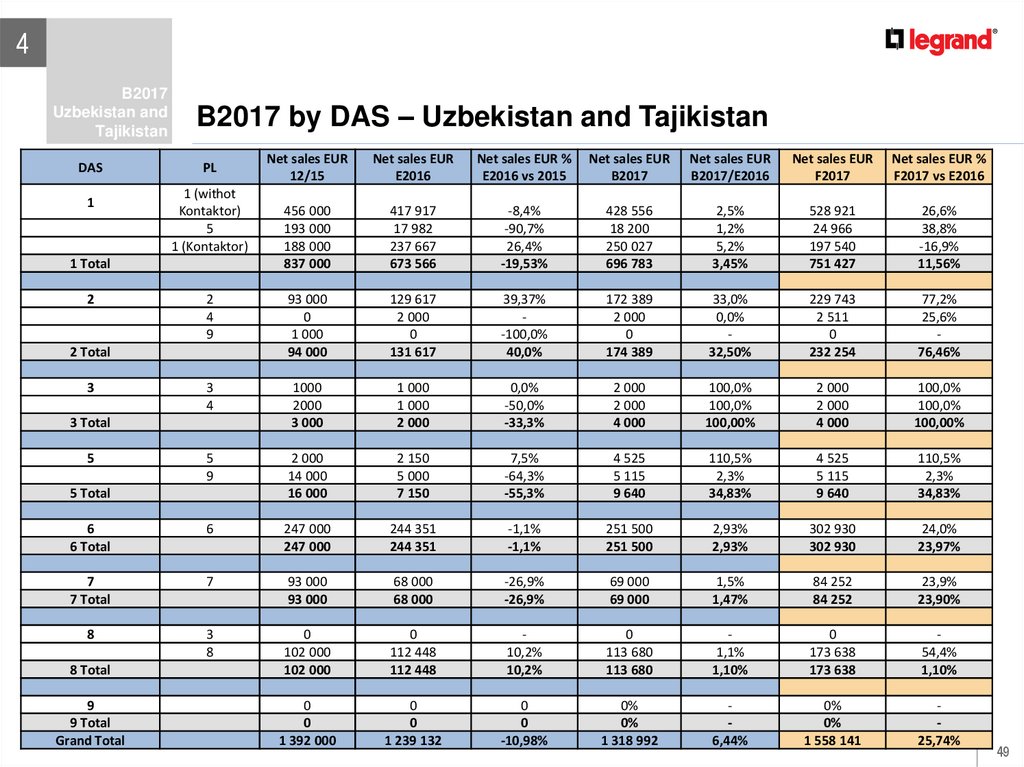
B2017 by DAS – Uzbekistan and Tajikistan
Net sales EUR
12/15
Net sales EUR
E2016
Net sales EUR %
E2016 vs 2015
Net sales EUR
B2017
Net sales EUR
B2017/E2016
Net sales EUR
F2017
Net sales EUR %
F2017 vs E2016
456 000
193 000
188 000
837 000
417 917
17 982
237 667
673 566
-8,4%
-90,7%
26,4%
-19,53%
428 556
18 200
250 027
696 783
2,5%
1,2%
5,2%
3,45%
528 921
24 966
197 540
751 427
26,6%
38,8%
-16,9%
11,56%
2
4
9
93 000
0
1 000
94 000
129 617
2 000
0
131 617
39,37%
-100,0%
40,0%
172 389
2 000
0
174 389
33,0%
0,0%
32,50%
229 743
2 511
0
232 254
77,2%
25,6%
76,46%
3
4
1000
2000
3 000
1 000
1 000
2 000
0,0%
-50,0%
-33,3%
2 000
2 000
4 000
100,0%
100,0%
100,00%
2 000
2 000
4 000
100,0%
100,0%
100,00%
5
9
2 000
14 000
16 000
2 150
5 000
7 150
7,5%
-64,3%
-55,3%
4 525
5 115
9 640
110,5%
2,3%
34,83%
4 525
5 115
9 640
110,5%
2,3%
34,83%
6
6 Total
6
247 000
247 000
244 351
244 351
-1,1%
-1,1%
251 500
251 500
2,93%
2,93%
302 930
302 930
24,0%
23,97%
7
7 Total
7
93 000
93 000
68 000
68 000
-26,9%
-26,9%
69 000
69 000
1,5%
1,47%
84 252
84 252
23,9%
23,90%
8
3
8
8 Total
0
102 000
102 000
0
112 448
112 448
10,2%
10,2%
0
113 680
113 680
1,1%
1,10%
0
173 638
173 638
54,4%
1,10%
9
9 Total
Grand Total
0
0
1 392 000
0
0
1 239 132
0
0
-10,98%
0%
0%
1 318 992
6,44%
0%
0%
1 558 141
25,74%
DAS
1
PL
1 (withot
Kontaktor)
5
1 (Kontaktor)
1 Total
2
2 Total
3
3 Total
5
5 Total
49
50.
5Strategic goals
and Action Plan
Uzbekistan and
Tajikistan
50
51.
5Strategic goals
and Action
Plan
Uzbekistan and
Tajikistan
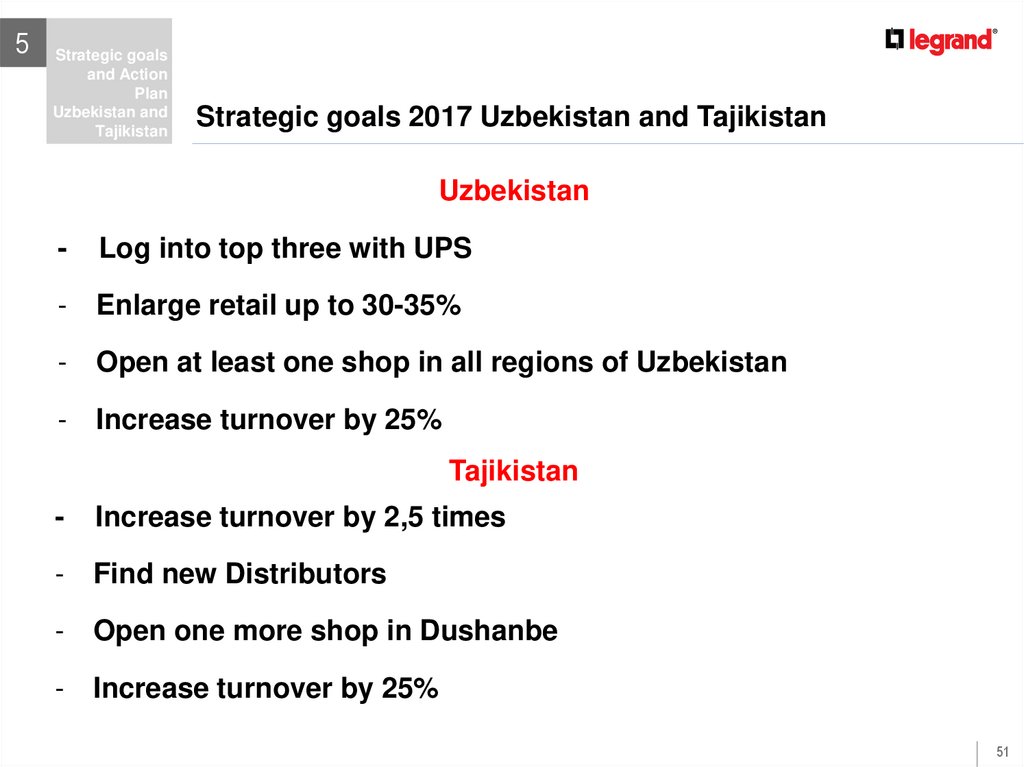
Strategic goals 2017 Uzbekistan and Tajikistan
Uzbekistan
-
Log into top three with UPS
-
Enlarge retail up to 30-35%
-
Open at least one shop in all regions of Uzbekistan
-
Increase turnover by 25%
Tajikistan
-
Increase turnover by 2,5 times
-
Find new Distributors
-
Open one more shop in Dushanbe
-
Increase turnover by 25%
51
52.
5Strategic goals
and Action
Plan
Uzbekistan and
Tajikistan
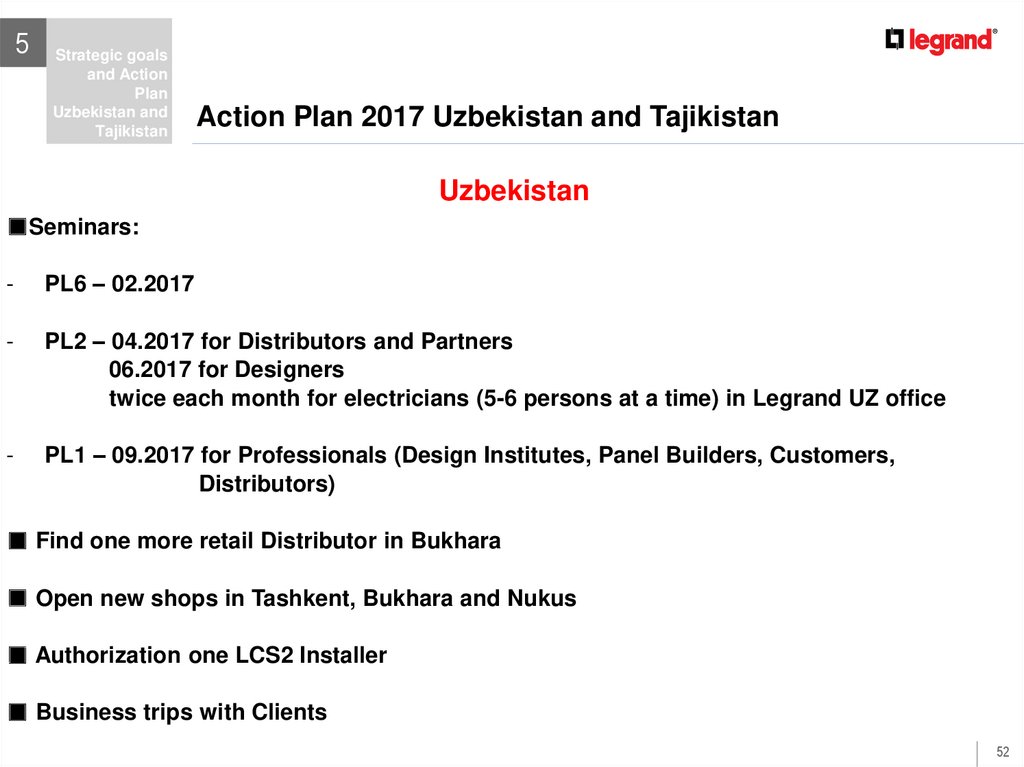
Action Plan 2017 Uzbekistan and Tajikistan
Uzbekistan
■Seminars:
-
PL6 – 02.2017
-
PL2 – 04.2017 for Distributors and Partners
06.2017 for Designers
twice each month for electricians (5-6 persons at a time) in Legrand UZ office
-
PL1 – 09.2017 for Professionals (Design Institutes, Panel Builders, Customers,
Distributors)
■ Find one more retail Distributor in Bukhara
■ Open new shops in Tashkent, Bukhara and Nukus
■ Authorization one LCS2 Installer
■ Business trips with Clients
52
53.
5Strategic goals
and Action
Plan
Uzbekistan and
Tajikistan
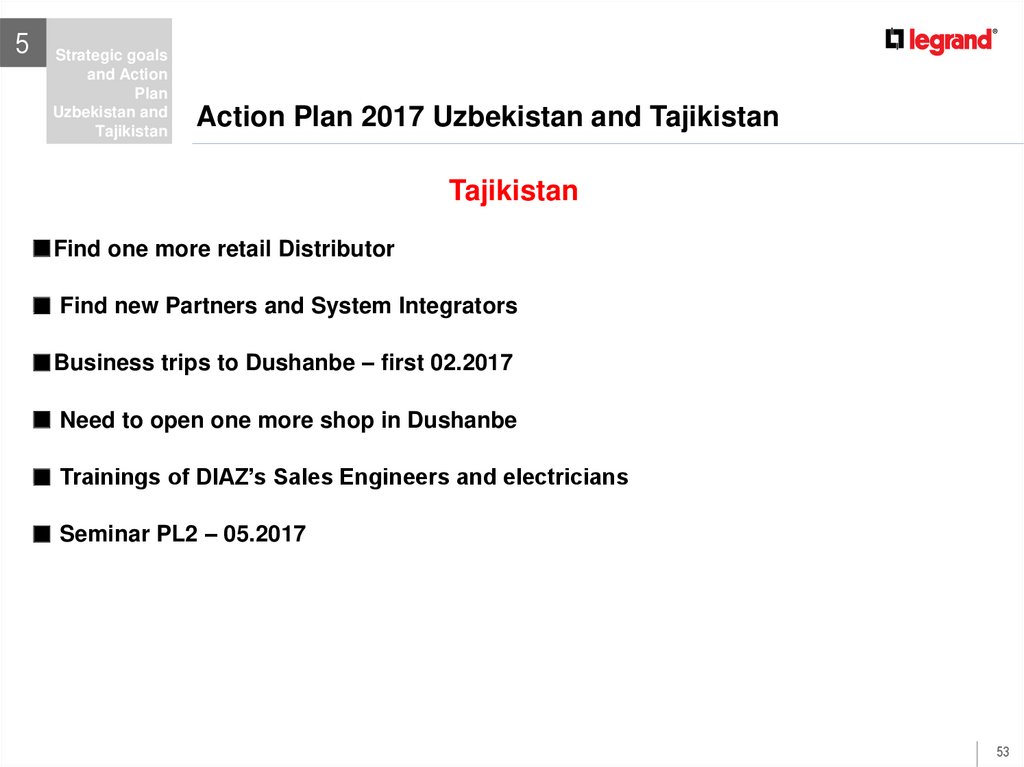
Action Plan 2017 Uzbekistan and Tajikistan
Tajikistan
■Find one more retail Distributor
■ Find new Partners and System Integrators
■Business trips to Dushanbe – first 02.2017
■ Need to open one more shop in Dushanbe
■ Trainings of DIAZ’s Sales Engineers and electricians
■ Seminar PL2 – 05.2017
53
54.
6APPENDIX
54
55.
6APPENDIX
Uzbekistan and Tajikistan
TOTAL UZBEKISTAN &
TADJIKISTAN
A 2015
%
B 2016
%
LG
1 037 730
35,3%
1 009 578
-3%
831 011
887 631
799 268
932 012
-2,7%
-19,9%
6,8%
38 000
42%
72 284
81 200
73 280
85 260
41,5%
169,2%
12,3%
E 2016
B 2017
B- 2017
B+ 2017
B16 / A15 E16 / A15 B17/E16
FIRELEC
26 851
ZUCCHINI + BTICINO
72 042
60,8%
130 000
80%
92 171
94 014
84 620
98 715
80,5%
27,9%
2,0%
CABLOFIL
56 000
100,0%
63 000
13%
6 000
6 120
5 570
6 426
12,5%
-89,3%
2,0%
ESTAP
3 987
-
-
-
-
-
-100,0% -100,0%
KONTAKTOR
188 048
-5,1%
130 000
-31%
237 667
250 027
225 024
262 528
-30,9%
26,4%
5,2%
TOTAL SALES
1 384 658
31,5%
1 370 578
-1%
1 239 132
1 318 992
1 187 762
1 384 942
-1,0%
-10,5%
6,4%
326 384
31,5%
365 088 36,2%
300 826
322 842
290 718
338 984
11,9%
-7,8%
7,3%
FIRELEC
11 053
41,2%
13 376 35,2%
22 160
25 254
22 800
26 517
21,0%
100,5%
14,0%
ZUCCHINI + BTICINO
17 290
24,0%
27 430 21,1%
10 323
10 530
9 477
11 056
58,6%
-40,3%
2,0%
CABLOFIL
31 002
55,4%
35 280 56,0%
2 400
2 448
2 228
2 570
13,8%
-92,3%
2,0%
718
18,0%
1
2
LG
ESTAP
KONTAKTOR
-
25 575
-13,6% -
TOTAL GROSS MARGIN
360 872
26,1%
EXPENSES TOTAL
103 915
-
-
13 780 -10,6% -
33 511 -
35 254 -
31 728 -
37 016
-46,1%
31,0%
5,2%
427 394 31,2%
302 198
325 820
293 496
342 113
18,4%
-16,3%
7,8%
141 914
109 997
141 500
128 300
147 500
36,6%
5,9%
28,6%
74 791
79 887
71 934
83 881
10 000
-
-
-
Add fees from Lg SNC (9%)
-
90 862
Provision clients
-
-
256 956
194 618
127 410
104 433
93 262
110 732
18,6%
14,2%
10,3%
7,9%
7,9%
8,0%
OPERATIONAL MARGIN
% OF SALES
-100,0% -100,0%
-
6,8%
-24,3%
-50,4% -18,0%
55