


")


 Экономика
 Социология
Похожие презентации:


")
Income Inequality & Poverty
1. Income Inequality & Poverty
Income Inequality &Poverty
2.
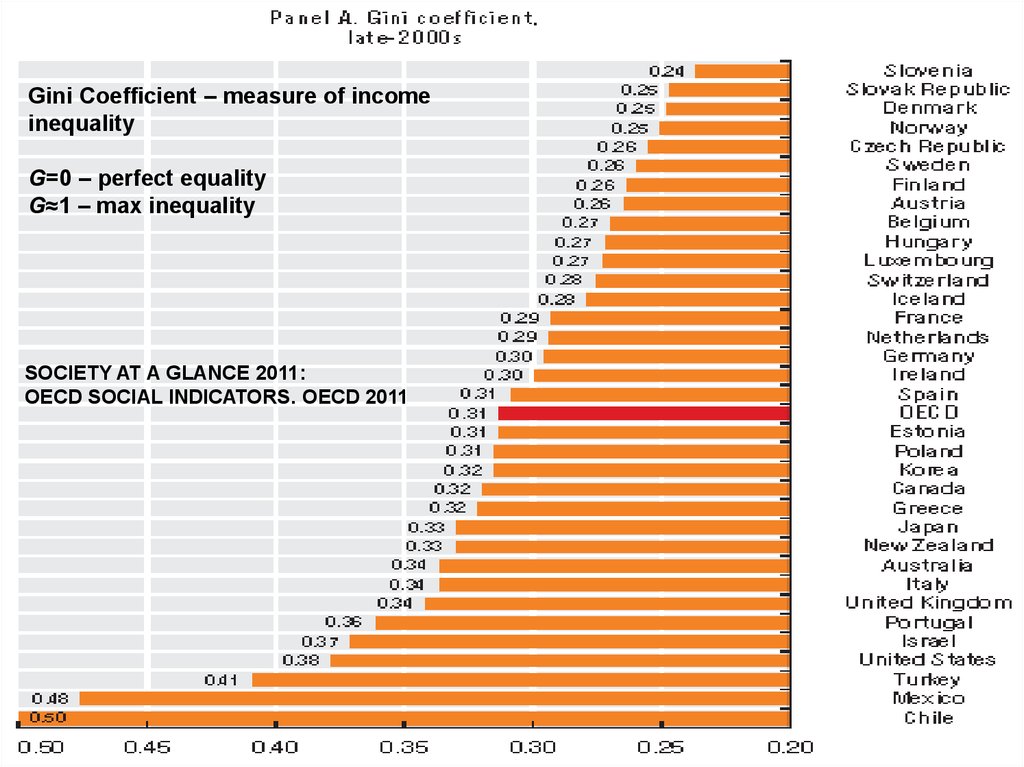
Gini Coefficient – measure of incomeinequality
G=0 – perfect equality
G≈1 – max inequality
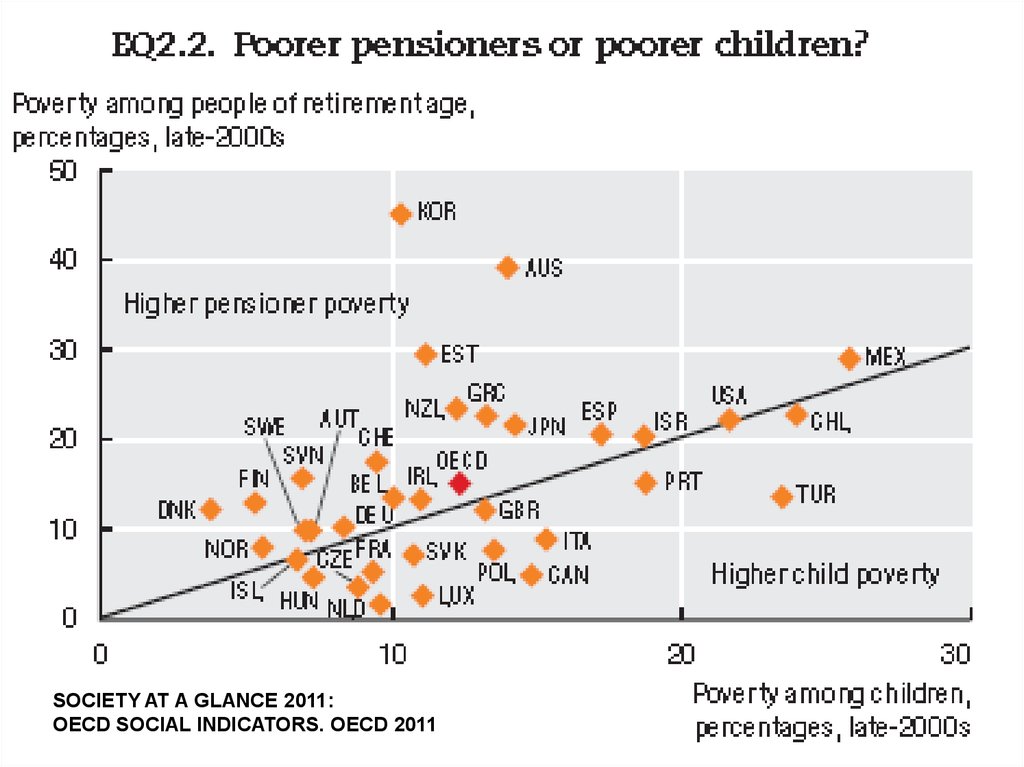
SOCIETY AT A GLANCE 2011:
OECD SOCIAL INDICATORS. OECD 2011
3.
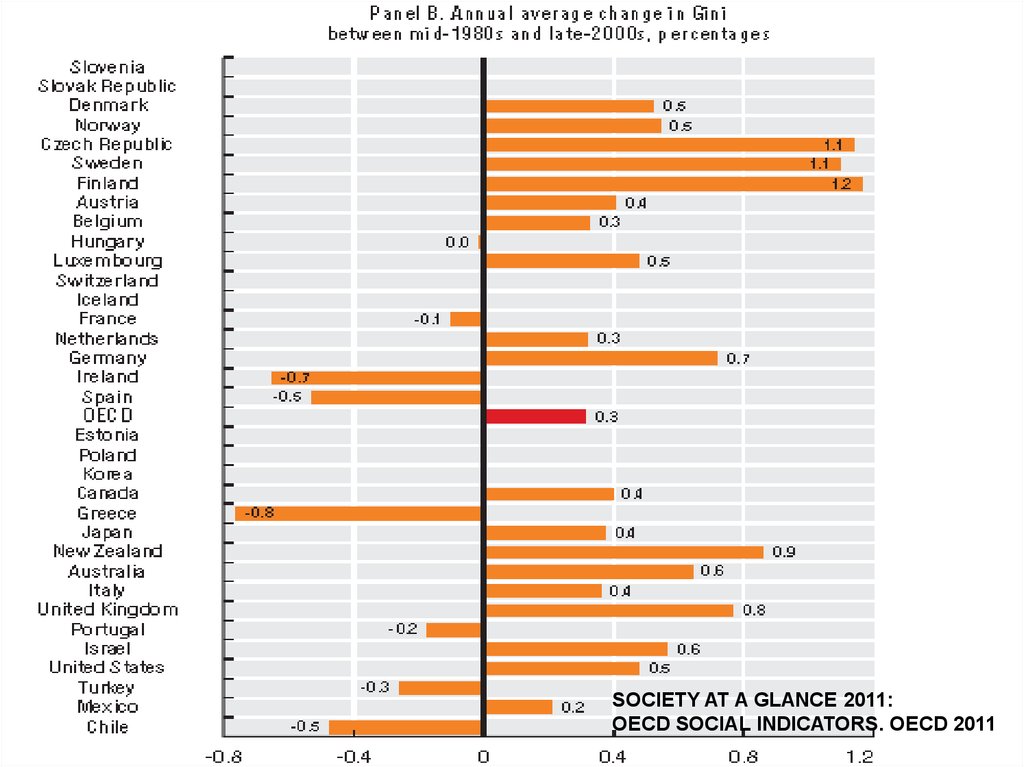
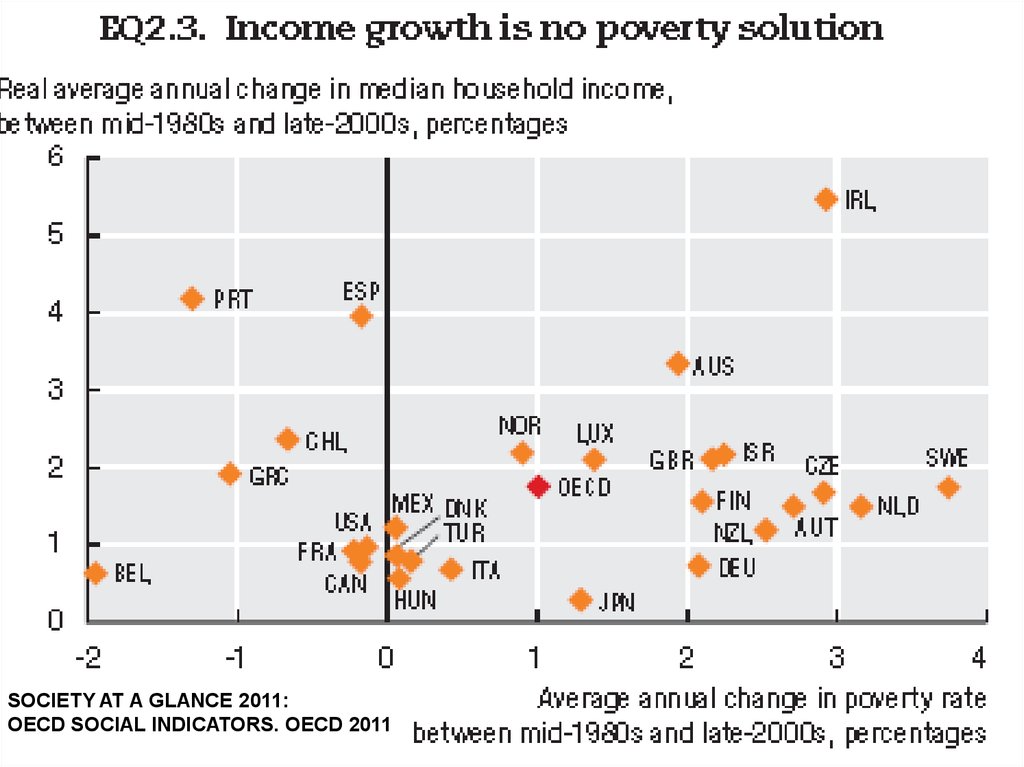
SOCIETY AT A GLANCE 2011:OECD SOCIAL INDICATORS. OECD 2011
4.
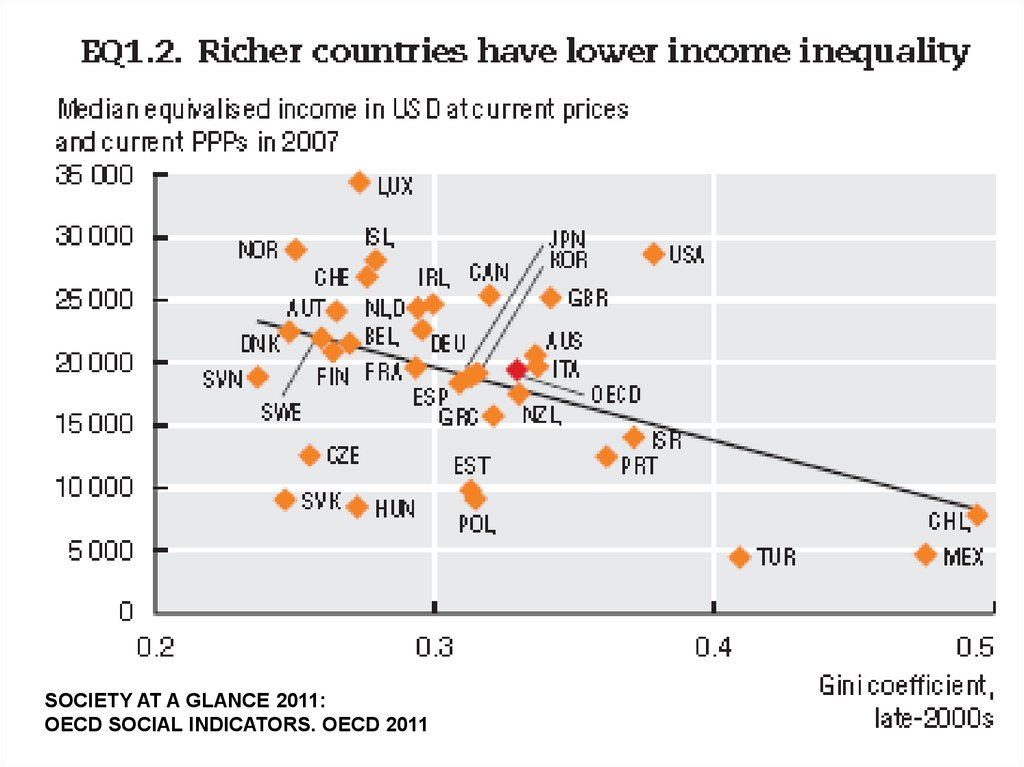
SOCIETY AT A GLANCE 2011:OECD SOCIAL INDICATORS. OECD 2011
5.
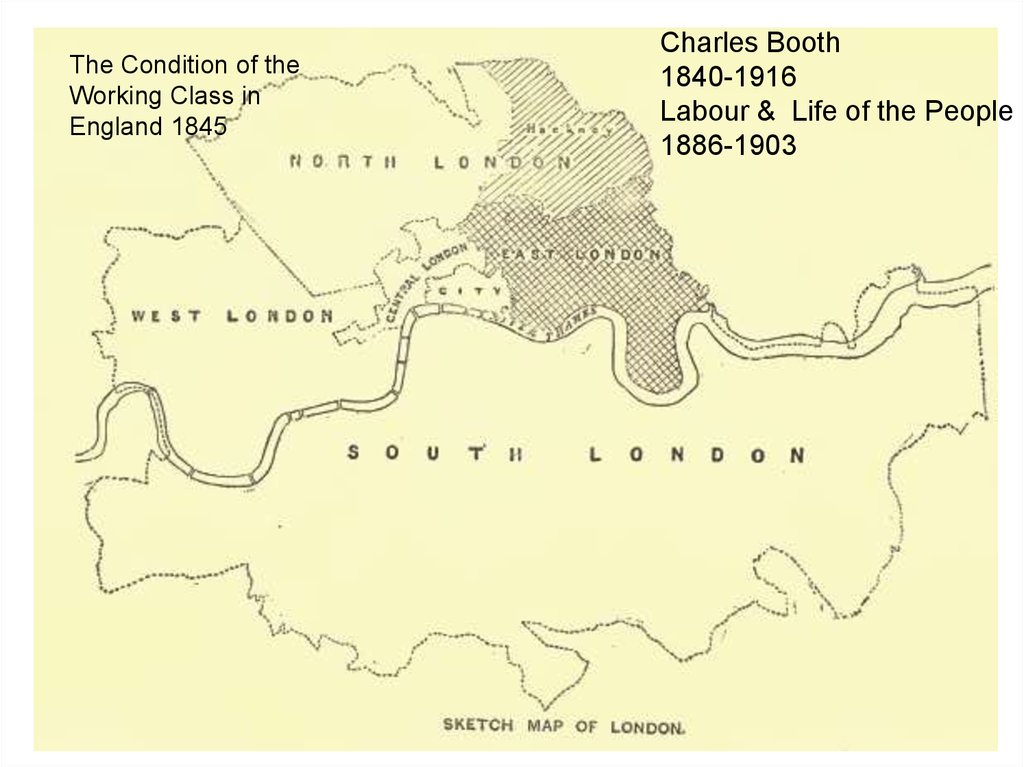
The Condition of theWorking Class in
England 1845
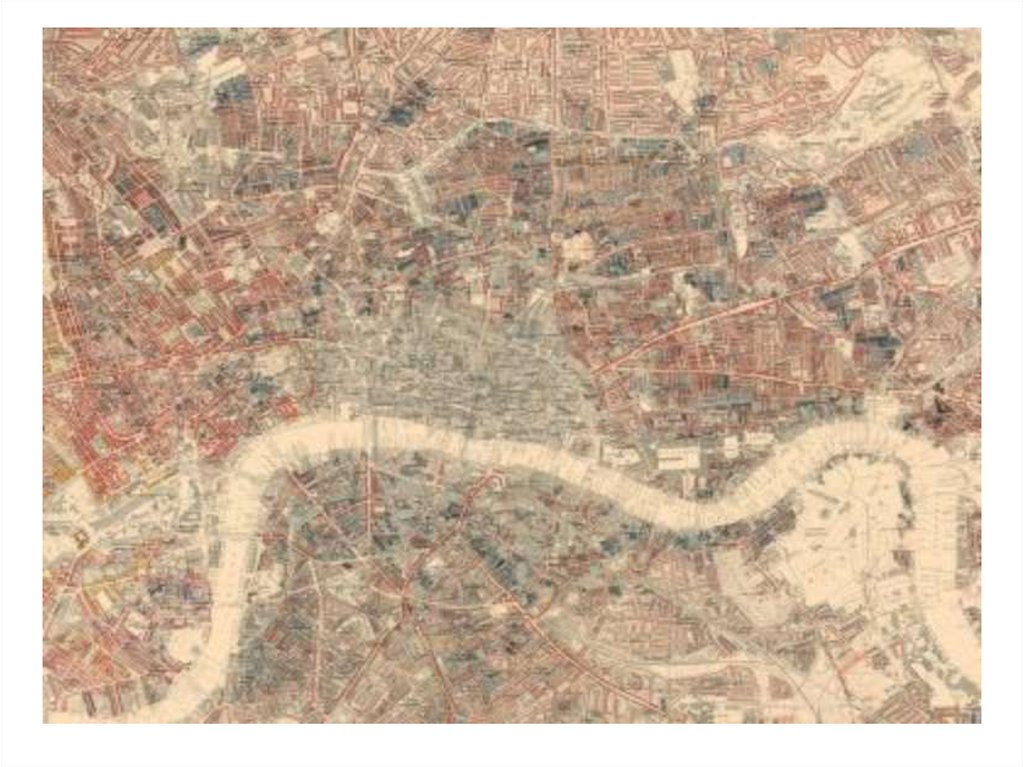
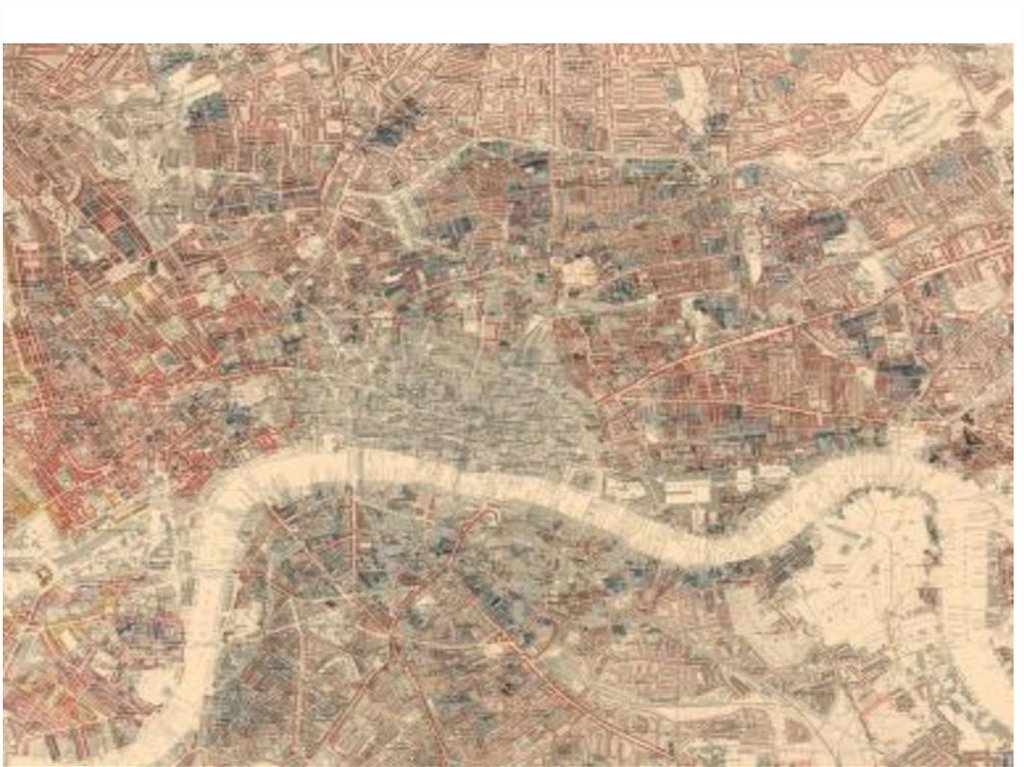
Charles Booth
1840-1916
Labour & Life of the People
1886-1903
6.
7.
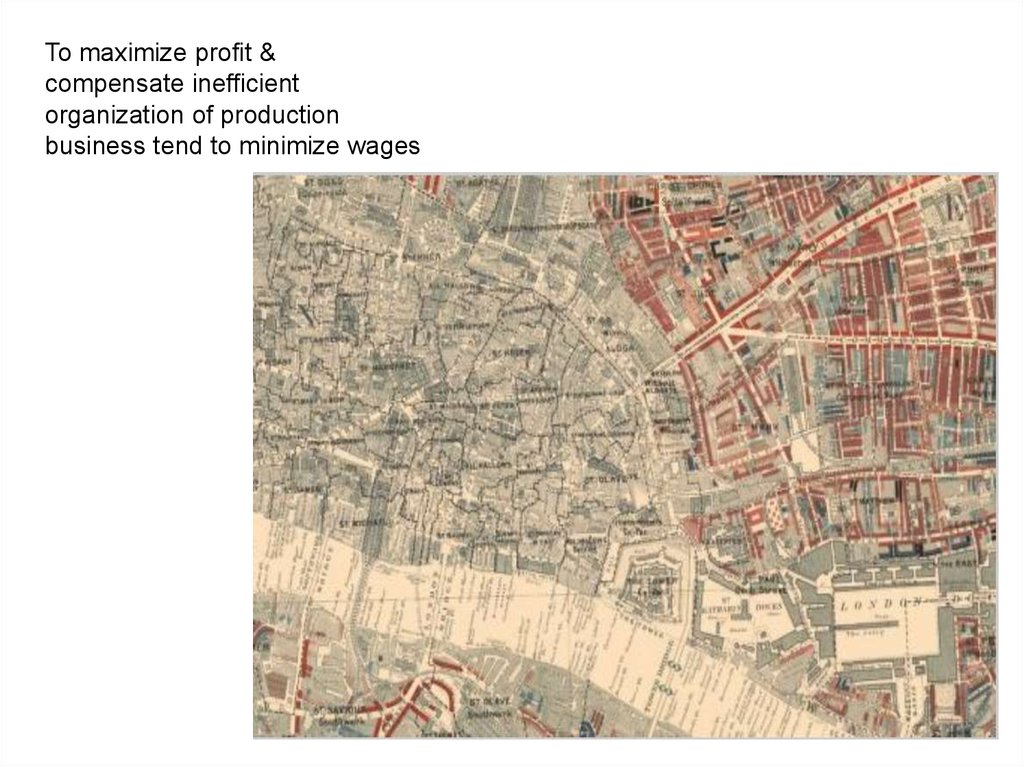
To maximize profit &compensate inefficient
organization of production
business tend to minimize wages
8.
9.
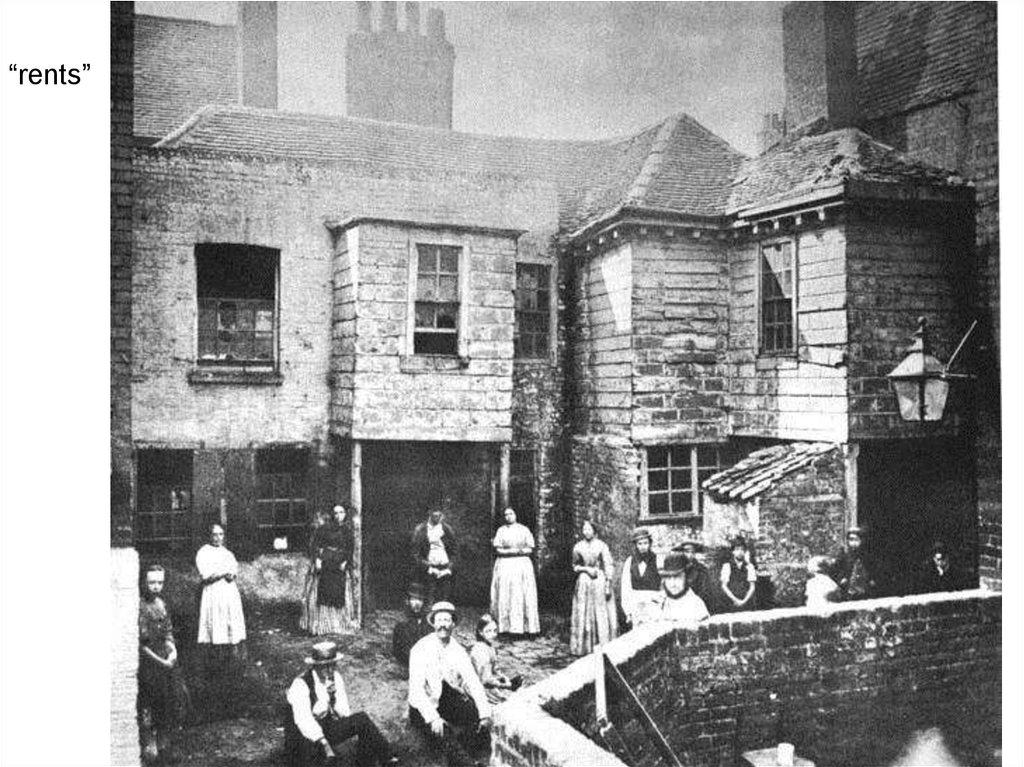
“rents”10.
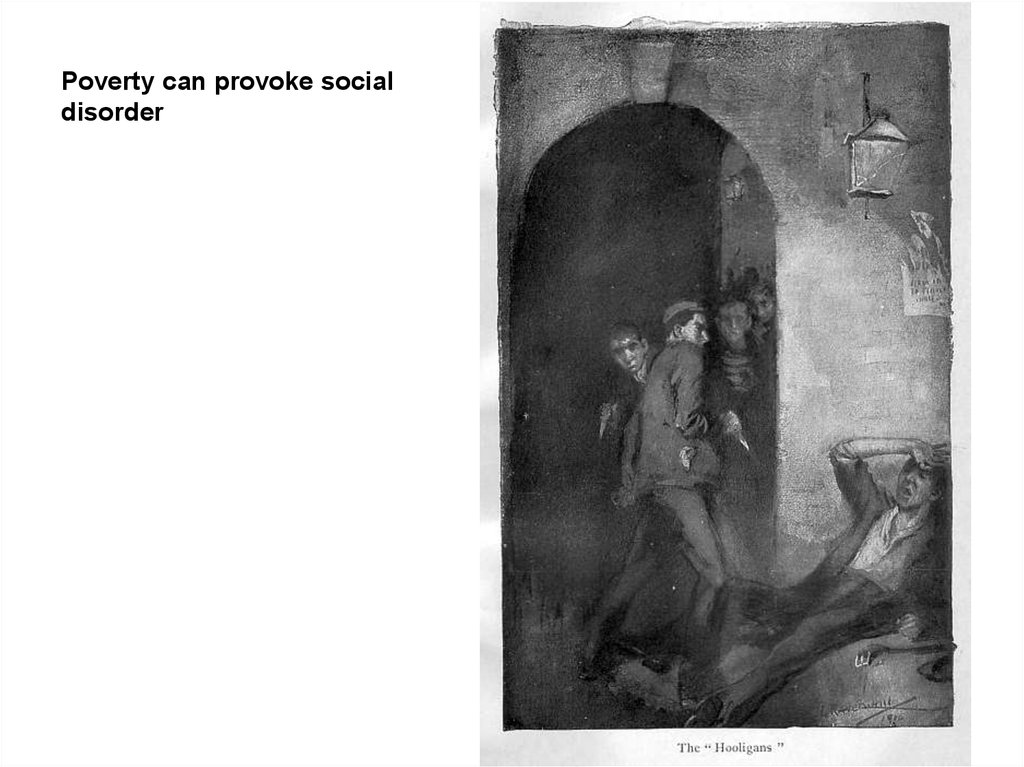
Poverty can provoke socialdisorder
11.
Poverty reduces chances of children for development andachievement
12.
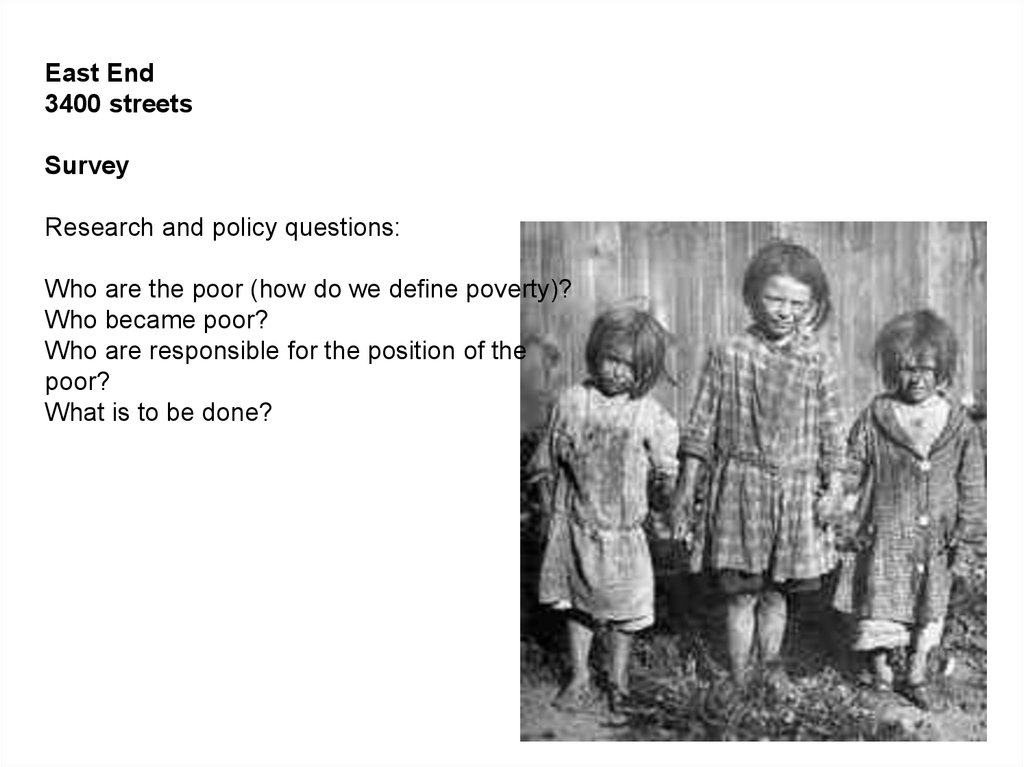
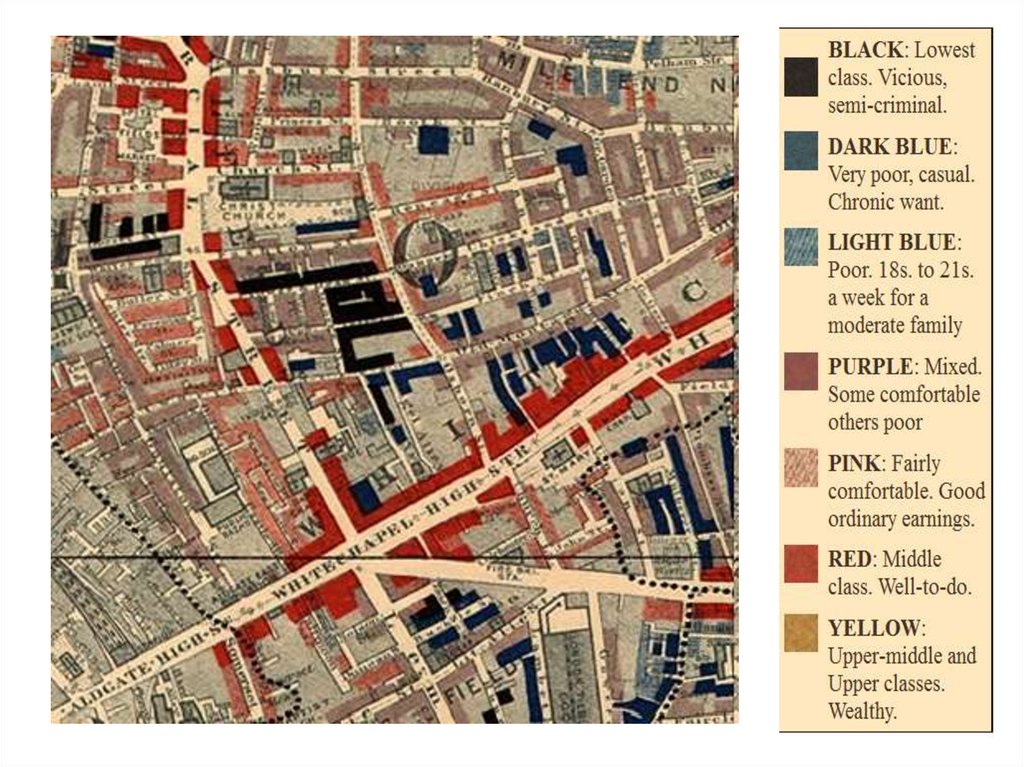
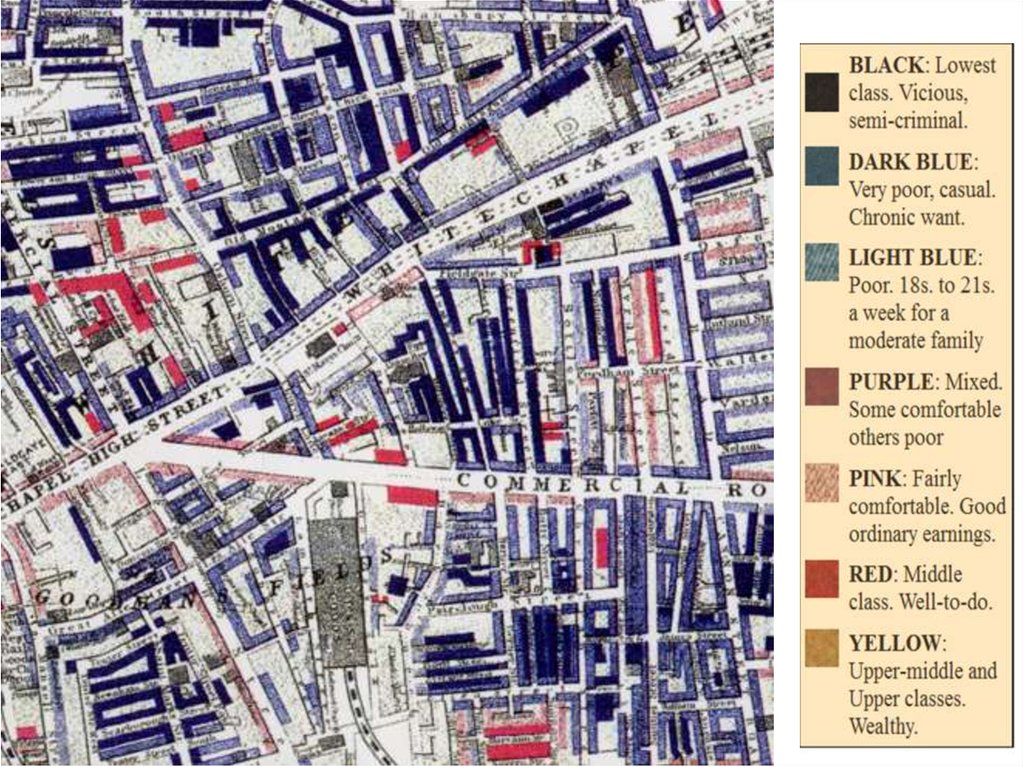
East End3400 streets
Survey
Research and policy questions:
Who are the poor (how do we define poverty)?
Who became poor?
Who are responsible for the position of the
poor?
What is to be done?
13.
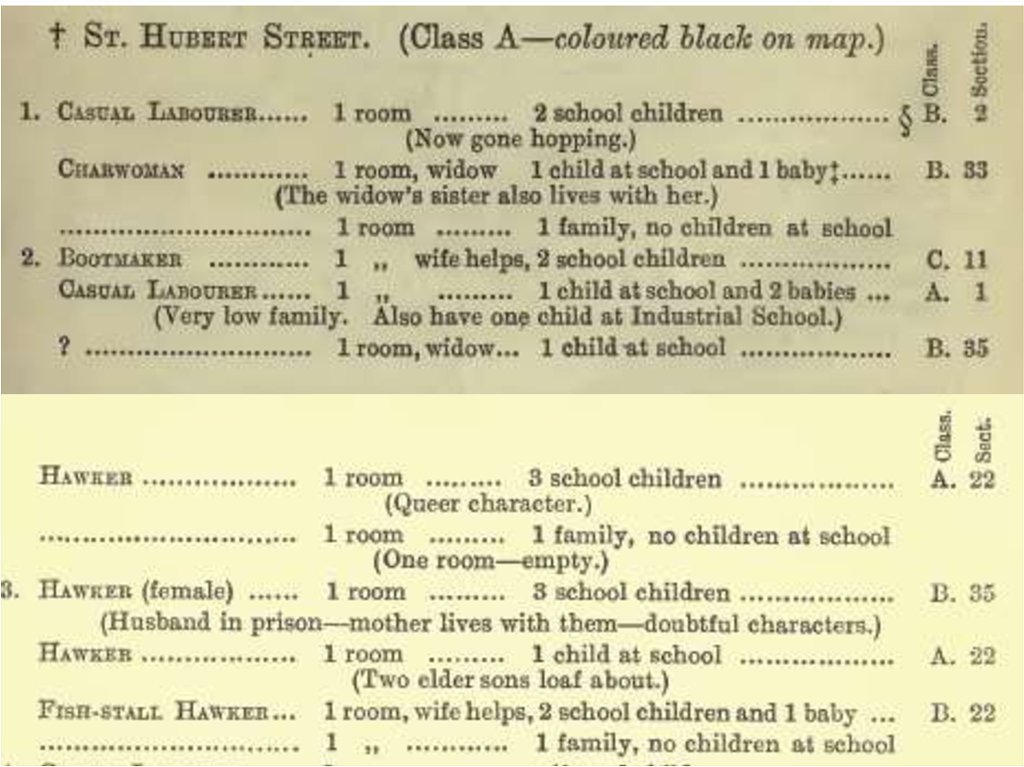
School Board Visitors as guidesVolunteers who helped to check if children attended school
14.
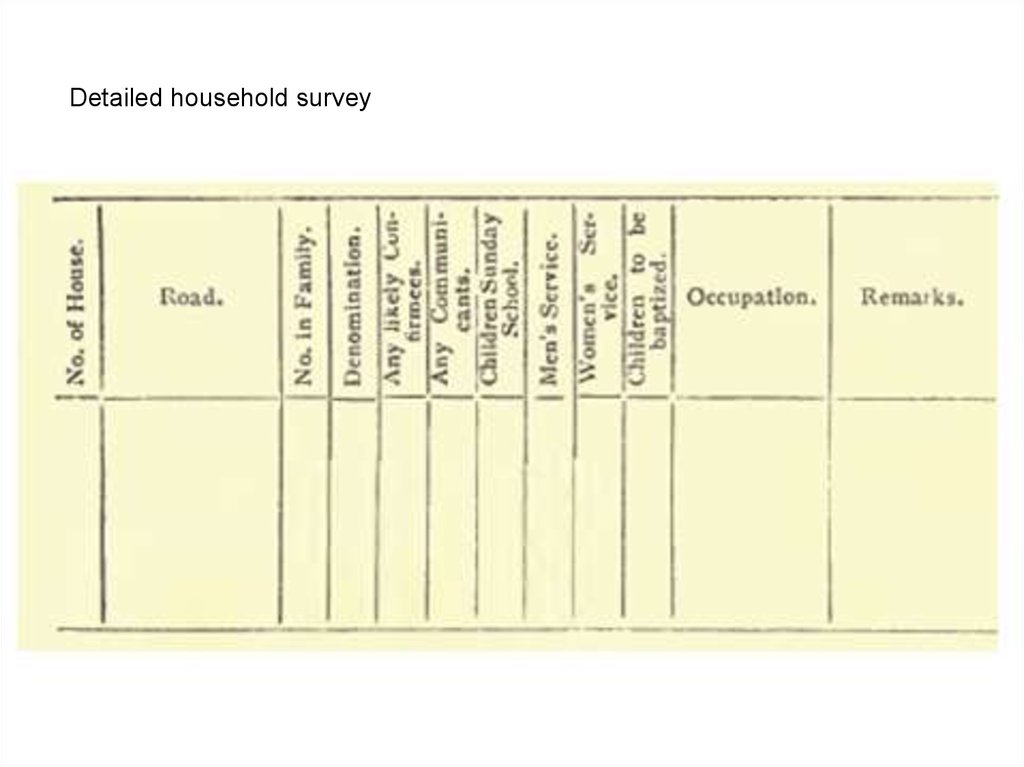
Detailed household survey15.
16.
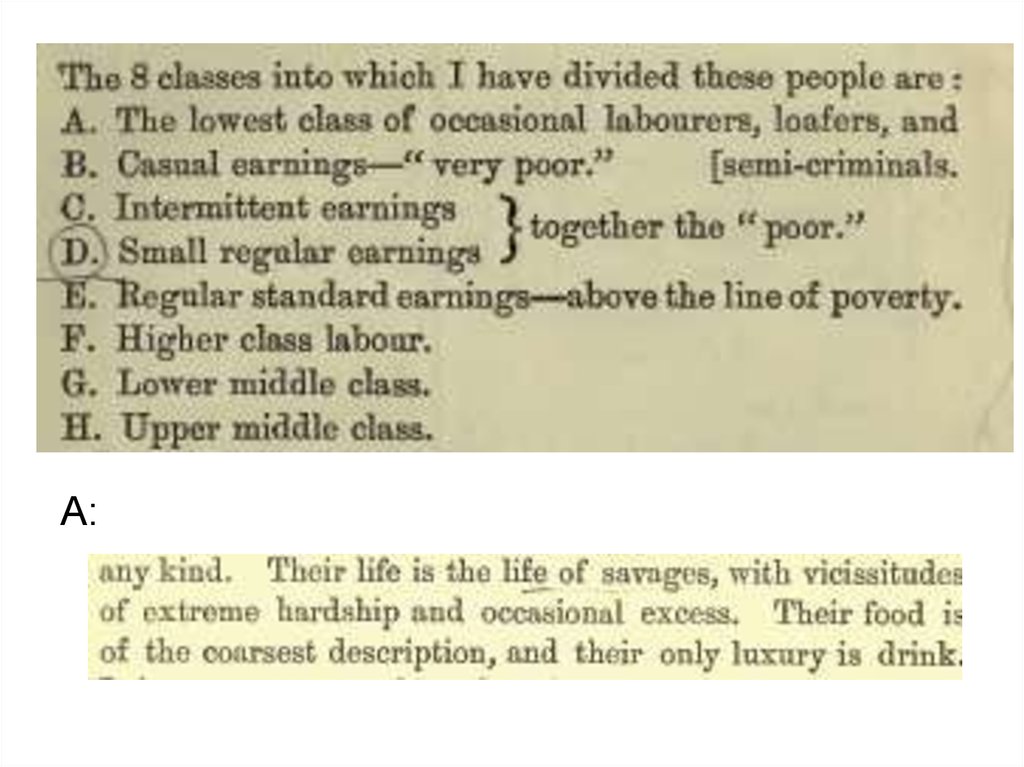
А:17.
18.
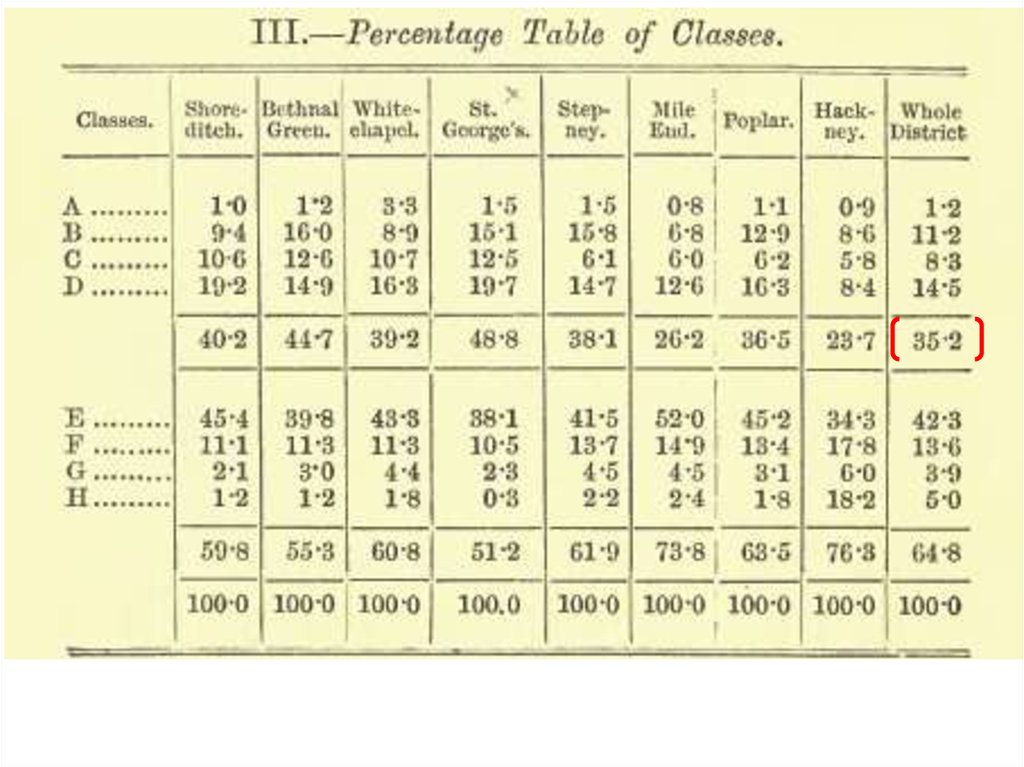
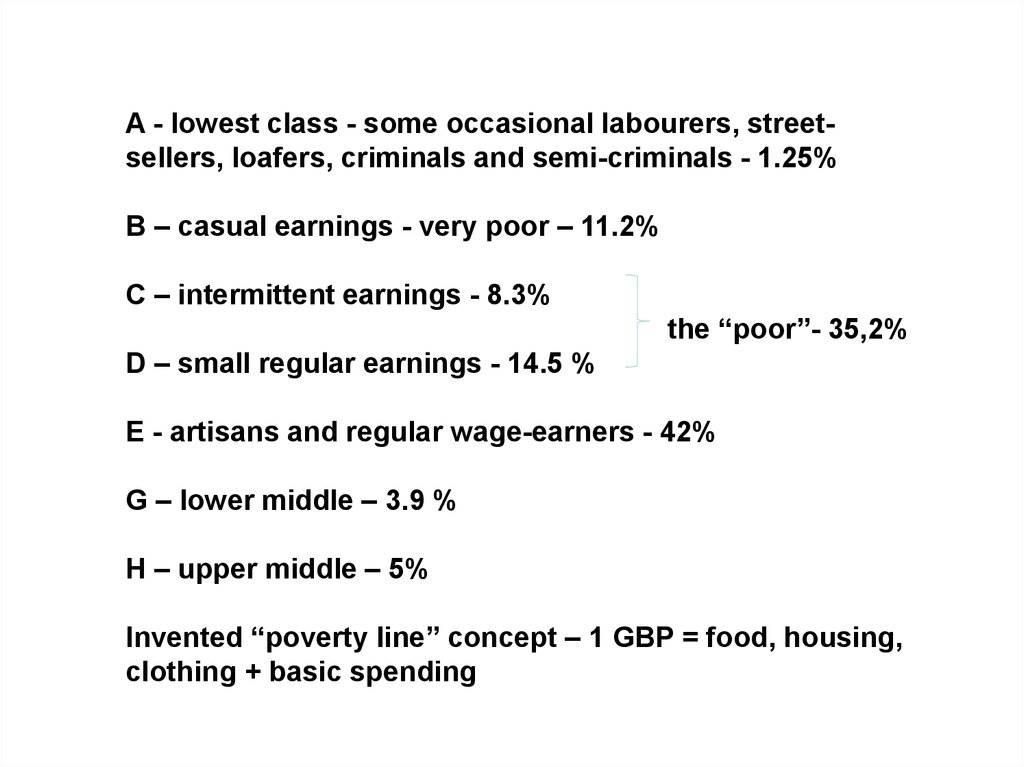
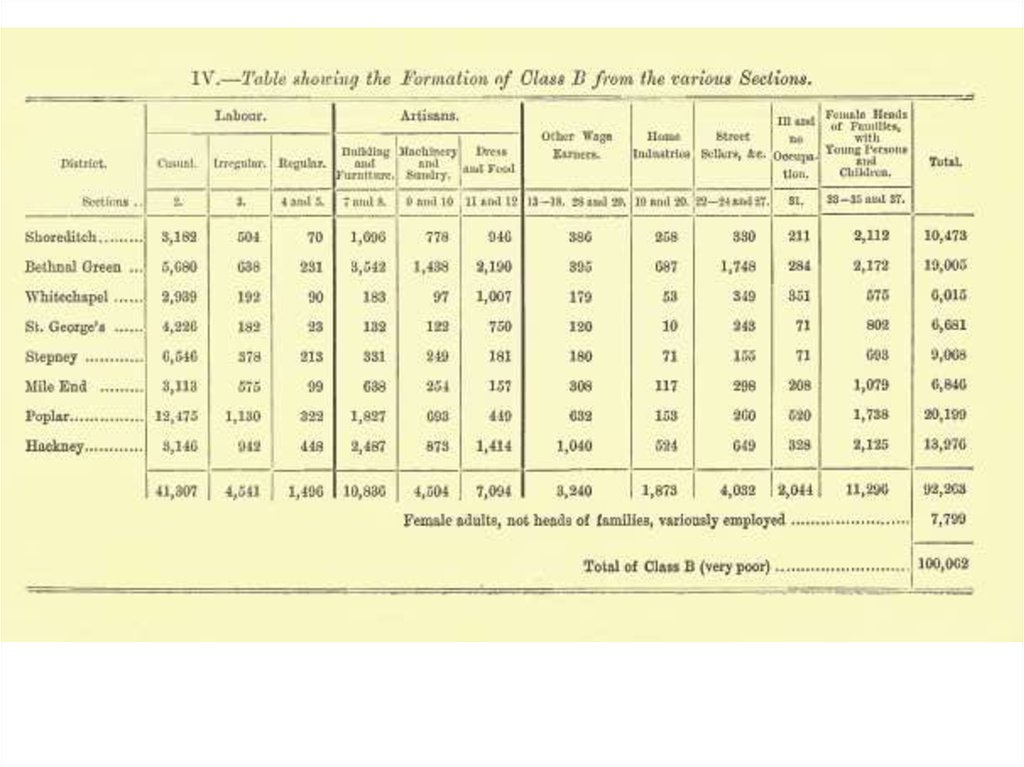
A - lowest class - some occasional labourers, streetsellers, loafers, criminals and semi-criminals - 1.25%B – casual earnings - very poor – 11.2%
С – intermittent earnings - 8.3%
the “poor”- 35,2%
D – small regular earnings - 14.5 %
E - artisans and regular wage-earners - 42%
G – lower middle – 3.9 %
H – upper middle – 5%
Invented “poverty line” concept – 1 GBP = food, housing,
clothing + basic spending
19.
20.
21.
22.
23.
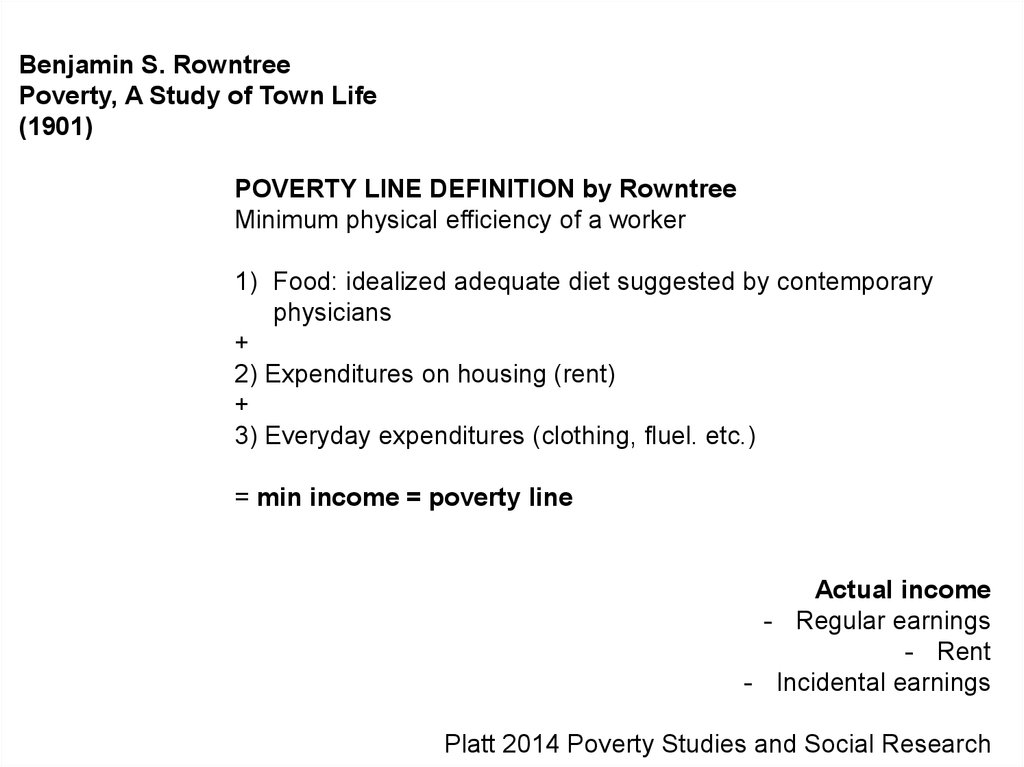
Benjamin S. RowntreePoverty, A Study of Town Life
(1901)
POVERTY LINE DEFINITION by Rowntree
Minimum physical efficiency of a worker
1) Food: idealized adequate diet suggested by contemporary
physicians
+
2) Expenditures on housing (rent)
+
3) Everyday expenditures (clothing, fluel. etc.)
= min income = poverty line
Actual income
- Regular earnings
- Rent
- Incidental earnings
Platt 2014 Poverty Studies and Social Research
24.
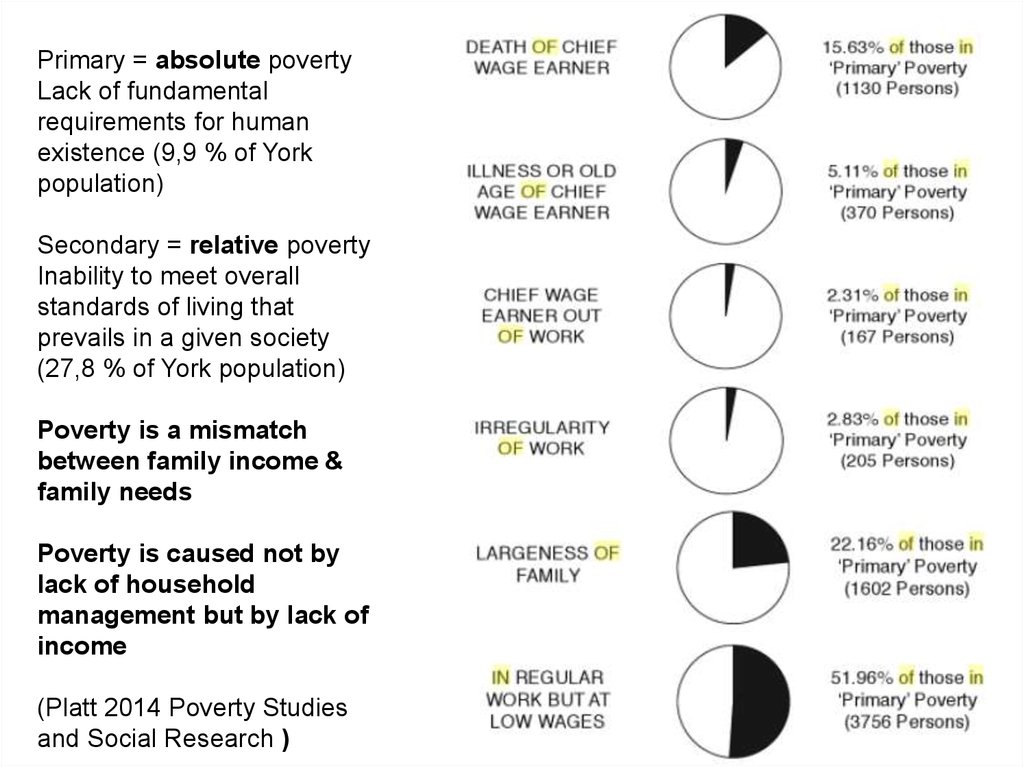
Primary = absolute povertyLack of fundamental
requirements for human
existence (9,9 % of York
population)
Secondary = relative poverty
Inability to meet overall
standards of living that
prevails in a given society
(27,8 % of York population)
Poverty is a mismatch
between family income &
family needs
Poverty is caused not by
lack of household
management but by lack of
income
(Platt 2014 Poverty Studies
and Social Research )
25.
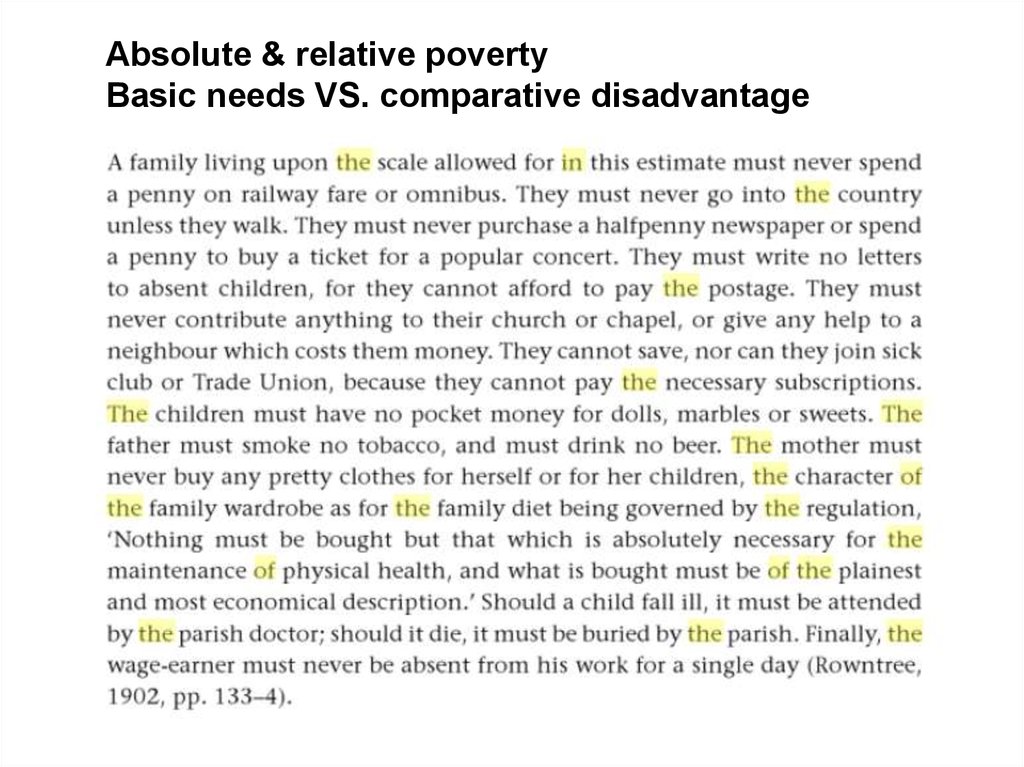
Absolute & relative povertyBasic needs VS. comparatives disadvantage
26.
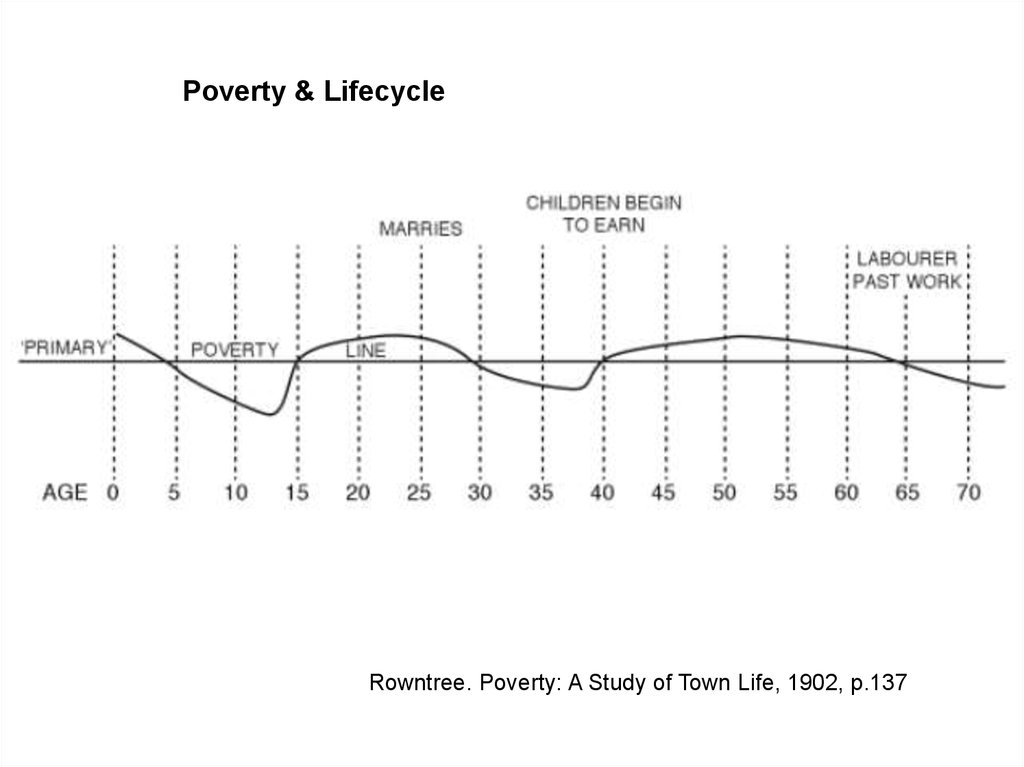
Poverty & LifecycleRowntree. Poverty: A Study of Town Life, 1902, p.137
27.
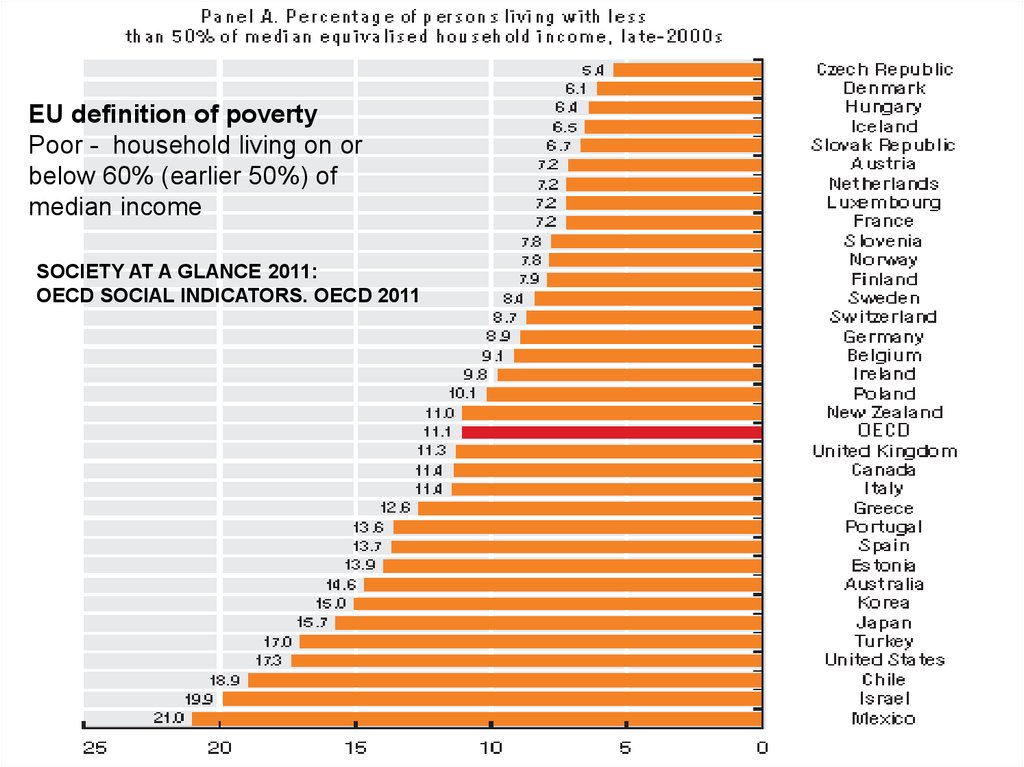
EU definition of povertyPoor - household living on or
below 60% (earlier 50%) of
median income
SOCIETY AT A GLANCE 2011:
OECD SOCIAL INDICATORS. OECD 2011
28.
29. Income inequality among squirrels ;)
30. Mean is a bad model
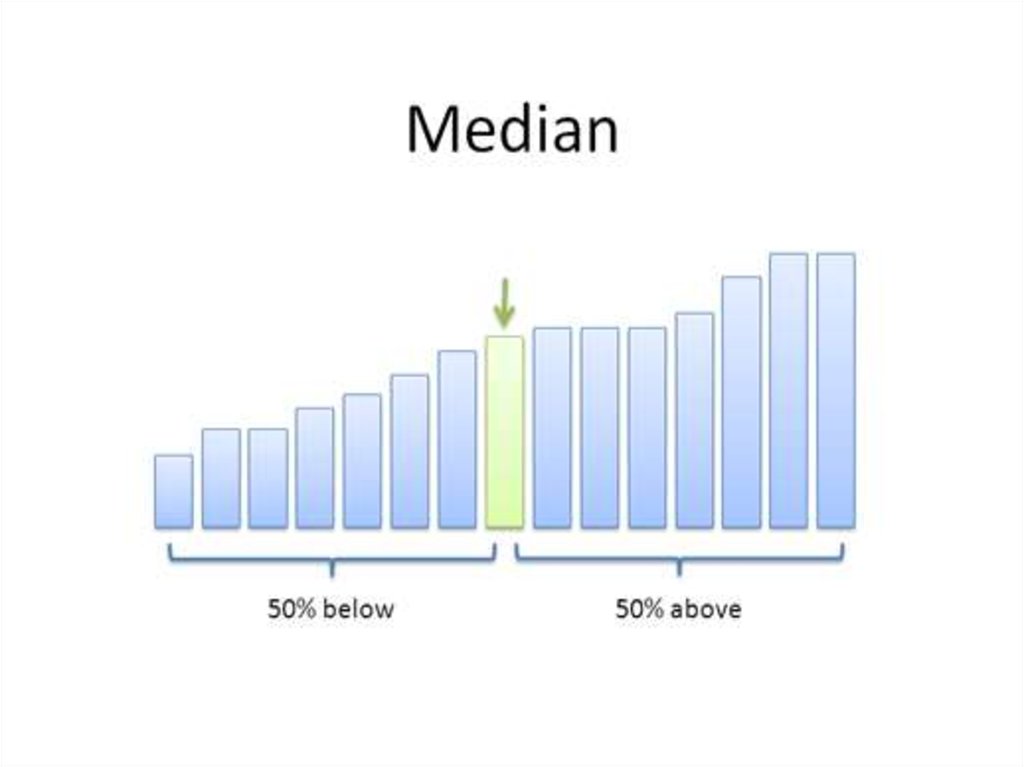
31. Median is better
32.
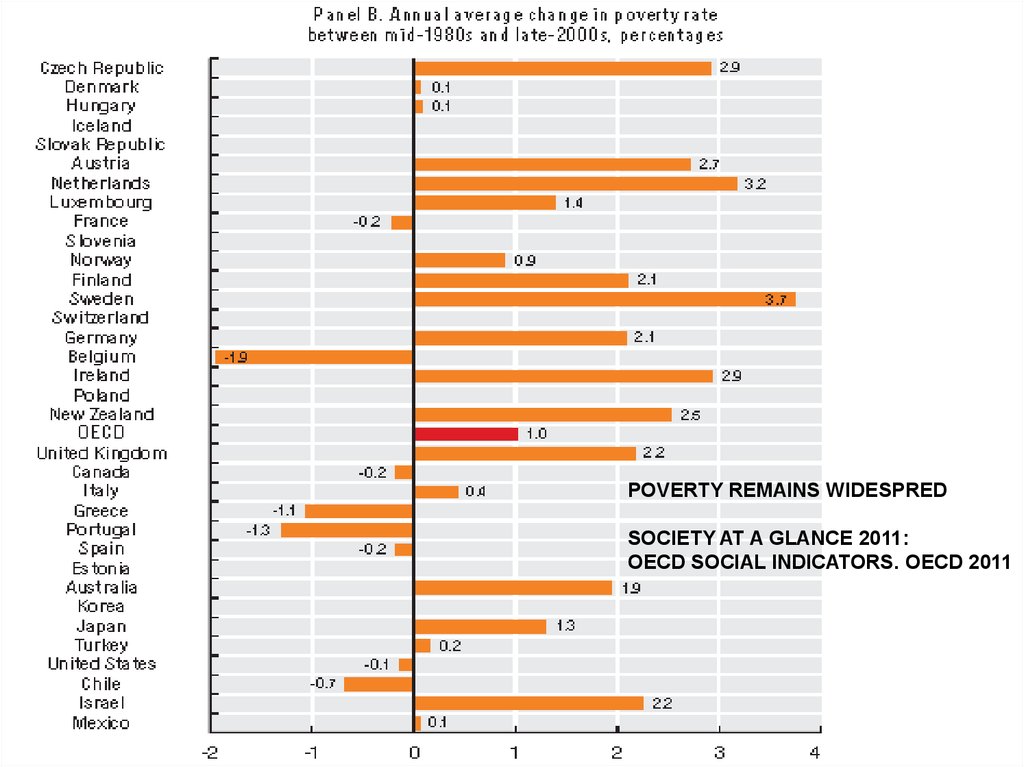
POVERTY REMAINS WIDESPREDSOCIETY AT A GLANCE 2011:
OECD SOCIAL INDICATORS. OECD 2011
33.
SOCIETY AT A GLANCE 2011:OECD SOCIAL INDICATORS. OECD 2011
34.
SOCIETY AT A GLANCE 2011:OECD SOCIAL INDICATORS. OECD 2011
35.
Absolute & relative povertyBasic needs VS. comparative disadvantage