


 Математика
Похожие презентации:


")
")


")
")
Review of Basic Concepts in Statistics
1. Session 2:
Review of Basic Concepts inStatistics
2. What is Statistics?
• The science of collecting, analyzing and making inference from the collecteddata.
• It is called as science and it is a tool.
Nazarbayev University
2
3. Statistic vs Statistics
• Statistic:• It means a measured (or) counted fact (or) piece of information stated as figure.
• e.g., height of one person, birth of a baby, etc.,
• Statistics:
• It is also called Data.
• It is Plural.
• Stated in more than one figures.
• e.g., height of 2 persons, birth of 5 babies etc. They are collected from experiments, records,
and surveys.
Nazarbayev University
3
4. Why Statistics?
• Statistics is used in many fields:Medical statistics
Agricultural statistics
Educational statistics
Mathematical statistics
And so on…
Nazarbayev University
4
5. Types of Statistics
Nazarbayev University5
6. Descriptive vs Inferential
Descriptive Statistics:• Once the data have been collected, we can organize and summaries in such a manner as
to arrive at their orderly presentation and conclusion.
• This procedure can be called Descriptive Statistics.
Inferential Statistics:
• The number of birth and deaths in a state in a particular year.
Nazarbayev University
6
7. Sample vs Population
• Information is gathered in the form of samples, or collections ofobservations.
• Samples are collected from populations that are collections of all individuals
or individual items of a particular type.
Nazarbayev University
7
8. The Role of Probability
• Elements of probability allow us to quantify the strength or “confidence” in ourconclusions.
• Major component that supplements statistical methods and help gauge the strength
of the statistical inference.
• The discipline of probability provides the transition between descriptive statistics
and inferential methods.
Nazarbayev University
8
9. Probability vs Inferential Statistics
For a statistical problem, the sample along withinferential statistics allows us to draw
conclusions about the population, with
inferential statistics making clear use of elements
of probability.
Nazarbayev University
Problems in probability allow us to draw
conclusions about characteristics of hypothetical
data taken from the population based on known
features of the population.
9
10. Sampling Procedures
1. Simple Random Sampling2. Experimental Design
Nazarbayev University
10
11. Simple Random Sampling
• Implies that any particular sample of a specified sample size has thesame chance of being selected as any other sample of the same size.
• Sample size: the number of elements in the sample.
• Biased sample: A non-random sample of a population in which all
elements are not equally balanced or objectively represented.
Nazarbayev University
11
12. Experimental Design
• A set of treatments or treatment combinations becomes thepopulations to be studied or compared.
• The concept of randomness or random assignment plays a role in the
area of experimental design.
Nazarbayev University
12
13. Sampling Terms
Samples:Collections of observations
Populations: Collections of ALL individuals or items of a
particular type
Variation:
Change from one observation to another
Variability:
Measure of degree of variation about the
mean
Descriptive
statistics:
Set of single number statistics that
describe a population, such as average,
median, standard deviation
13
14. Symmetrical Vs Skewed Data
• Symmetrical• Skewed
• Mean, mode, and median
Nazarbayev University
f(x)
0
1
2
3
4
0
1
2
3
4
f(x)
14
15. Skewness of Data
Nazarbayev University15
16.
Nazarbayev UniversitySkewness?
16
17. Measures of Location: Sample Mean
• Suppose that the observations in a sample are• The sample mean, denoted by
Nazarbayev University
.
17
18. Measures of Location: Sample Median
• The purpose of the sample median is to reflect the central tendencyof the sample in such a way that it is uninfluenced by extreme
values or outliers.
• Suppose that the observations in a sample are
• The sample median, denoted by
Nazarbayev University
.
18
19. Measures of Location: Trimmed Means
• A trimmed mean is computed by “trimming away” a certain percent of boththe largest and smallest set of values.
• E.g., the 10% trimmed mean is found by eliminating the largest 10% and
smallest 10% and computing the average of the remaining values.
• The trimmed means, denoted by
Nazarbayev University
19
20. Sample Range
Q: What is the sample range for the following data?Nazarbayev University
20
21. Sample Standard Deviation
• Suppose that the observations in a sample are• The sample variance, denoted by
.
• The sample standard deviation, denoted by s
Nazarbayev University
21
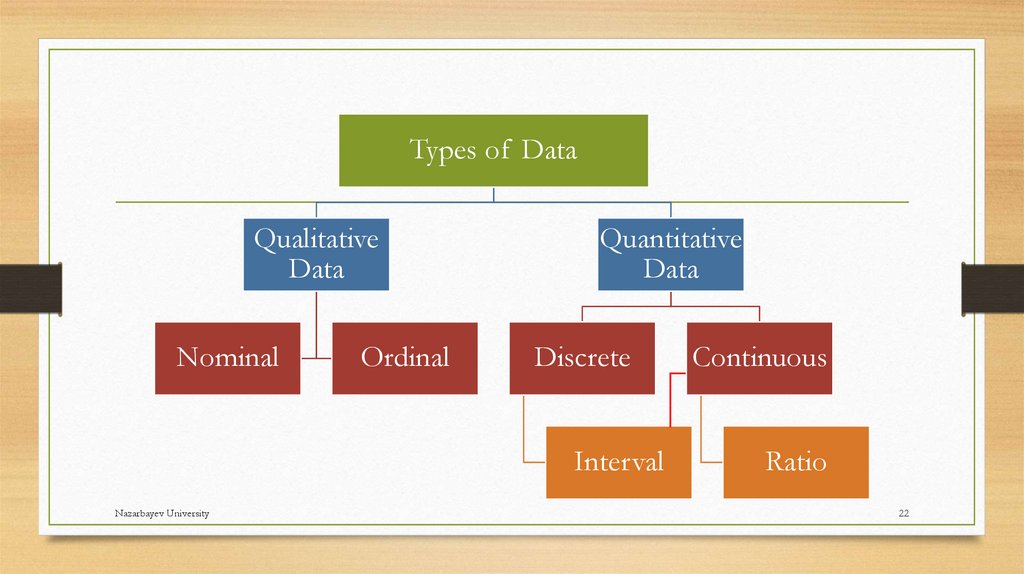
22.
Types of DataQualitative
Data
Nominal
Ordinal
Quantitative
Data
Discrete
Interval
Nazarbayev University
Continuous
Ratio
22
23. Level of Measurement
Categorical (entities are divided into distinct categories):• Binary variable: There are only two categories.
• Nominal variable: There are more than two categories.
• Ordinal variable: The same as a nominal variable but the categories have a logical order.
Continuous (entities get a distinct score):
• Interval variable: Equal intervals on the variable represent equal differences in the property
being measured.
• Ratio variable: The same as an interval variable, but the ratios of scores on the scale must
also make sense.
Nazarbayev University
23
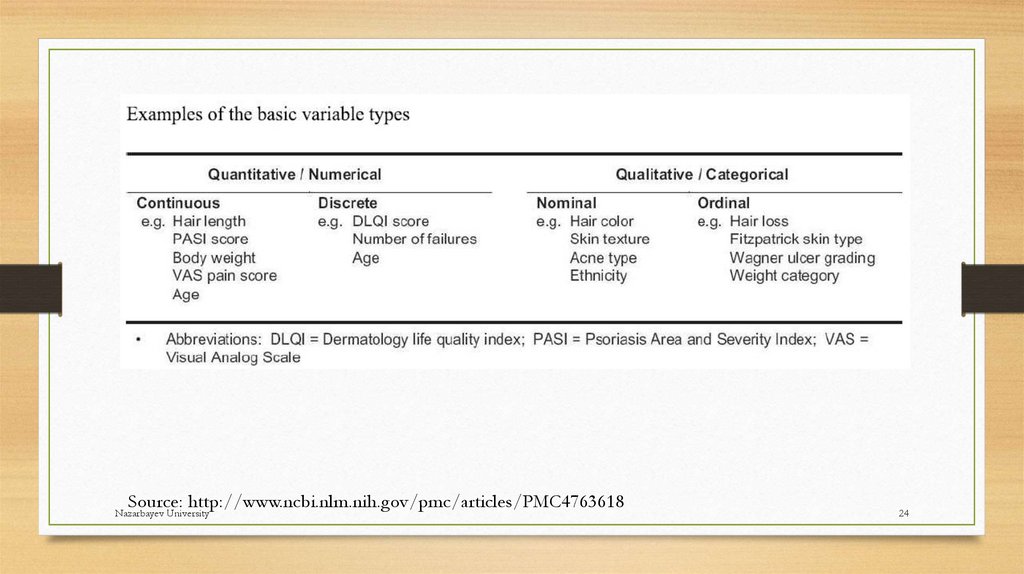
24.
Source: http://www.ncbi.nlm.nih.gov/pmc/articles/PMC4763618Nazarbayev University
24
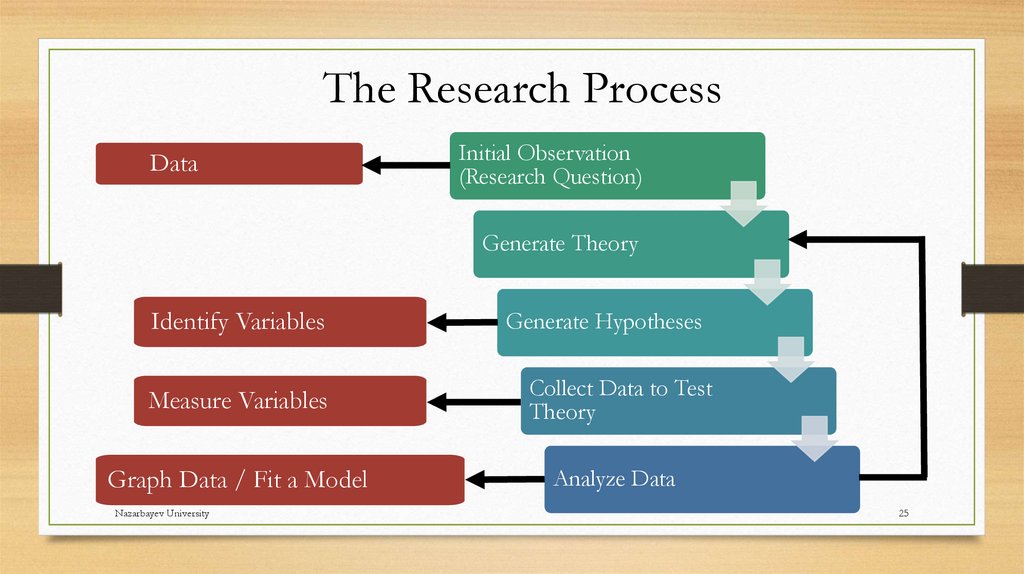
25.
The Research ProcessData
Initial Observation
(Research Question)
Generate Theory
Identify Variables
Generate Hypotheses
Measure Variables
Collect Data to Test
Theory
Graph Data / Fit a Model
Analyze Data
Nazarbayev University
25