


")


 Математика
Похожие презентации:
")
")


")

")


Getting your data: Sources and samples
1. Getting your data: Sources and samples
2. Sources of psychological data and Data collection methods
Data sourcesData collection methods
• Behavior
• Observation
• Physiological data
• Measurement
• Self-reports
• Focus-groups
• Peer-reports
• Survey
• Activity reports
(objective/projective)
• «Archival data»: databases,
papers
• Biographical or archival data
3.
Why experiment is not a method of data collection?Because it is a method of study organization
4. Data collection exercise - 15 mins -
Data collection exercise - 15 minsIn groups of 4 think of a Research Question/ Hypothesis
What type of data is the most suitable for your RQ or H?
What data collection method is the most suitable?
WHY?
5. Sample
What does Sample mean?Sample is a limited set of research objects (units) which
we use to make general conclusions about the whole
population.
Why do we need samples?
6. Sample and distribution
What is distribution?Values of variable
- a relationship between the values of a
random variable and the frequency (or the
probability) with which each of these
values can be found in a sample (or a
population).
Distribution of values
7. Descriptive statistics…
8. Exercise
A survey of 20 students was conducted to find out how many books they hadread during the past three months (including books for school). The results from
those 20 students are shown below. Find the mean, median, and mode for this
data.
2, 4, 5, 1, 3, 2, 5, 6, 1, 2, 4, 3, 6, 10, 12, 10, 2, 8, 6, 7
Answers:
Mean = 4.95.
Median = 4.5
Mode = 2.
9. Normal distribution
Properties of any theoretical normaldistribution:
1) The curve never approaches
horizontal axis.
2) Symmetrical around the mean.
3) Skewness = 0 and kurtosis = 0.
Standard normal distribution is a
special case of theoretical n.d. with 2
properties:
1) = 0, = 1;
2) area under the curve = 1, and
integral of (-∞; z] can be interpreted
as probability of finding values equal
to or below Z.
10. Normal distribution
Skewness =asymmetry
Kurtosis =
flatness
11. Where is NORMAL distribution?
12. What do we know about STANDARD normal distribution?
1) The curve never approaches horizontal axis2) Symmetrical around the mean
3) Skewness = 0 and kurtosis = 0
4) Mean = 0, SD = 1
5) Mean= mode= median =0
Example 1. If you get a score of 90 in
Math and 95 in English, you might
think that you are better in English
than in Math. However, in Math, your
score is 2 standard deviations above
the mean. In English, it’s only one
standard deviation above the mean. It
tells you that in Math, your score is
far higher than most of the students
(your score falls into the tail)
13. Why is it important to know what kind of distribution your variables have?
Non-parametric testsParametric tests
14. Descriptive statistics…
the sum of the squared differences from the M of eachscore, divided by the total number of scores minus 1
Provides info HOW FAR scores are spread out
Standard deviation(SD)
- square root of variance
It is a quantification of scores variation, and it’s
expressed in the same units as the data
Variance
- is
Difference from M of
ind.score
M
15. Are you tall?
16. When you know so much about distributions, you can compute a height distribution in your group
mean heightyour personal height
sample size
17. When you know Mean and SD, you can estimate whether you are tall or not
Less than averageaverage
More than average
18. Is this result applicable in other groups? Are you tall in other groups? In HSE? In Russia? To answer this question we should
But…Is this result applicable in other groups?
Are you tall in other groups?
In HSE?
In Russia?
To answer this question we should use standard scores
19. Standard scores (Z-scores)
your individual heightmean height in a given sample
standard deviation in a given sample
A very good explanation of Z-scores: https://statistics.laerd.com/statistical-guides/standard-score.php
20. Standard normal table
Shows you a PROBABILITY that all observedvalues in your sample are lower than Z
The label for rows contains the
integer part and the first decimal
place of Z.
The label for columns contains the
second decimal place of Z.
The values within the table are the
probabilities corresponding to the table
type.
21. What is the probability to find people taller than you in…
…Guatemala?…Hong Kong?
Mean = 147.3 cm
Mean = 160.1 cm
SD = 6.3
SD = 5.7
your Z = (your cm - 147.3)/ 6.3
your Z = (your cm - 160.1)/ 5.7
Then look in Z-table
Then look in Z-table
22.
23. Sample size and standard error
We know M and SD in your groupAnd we know M and SD in Guatemala
Which stats provide more trustworthy
description of height in a country?
Why?
24.
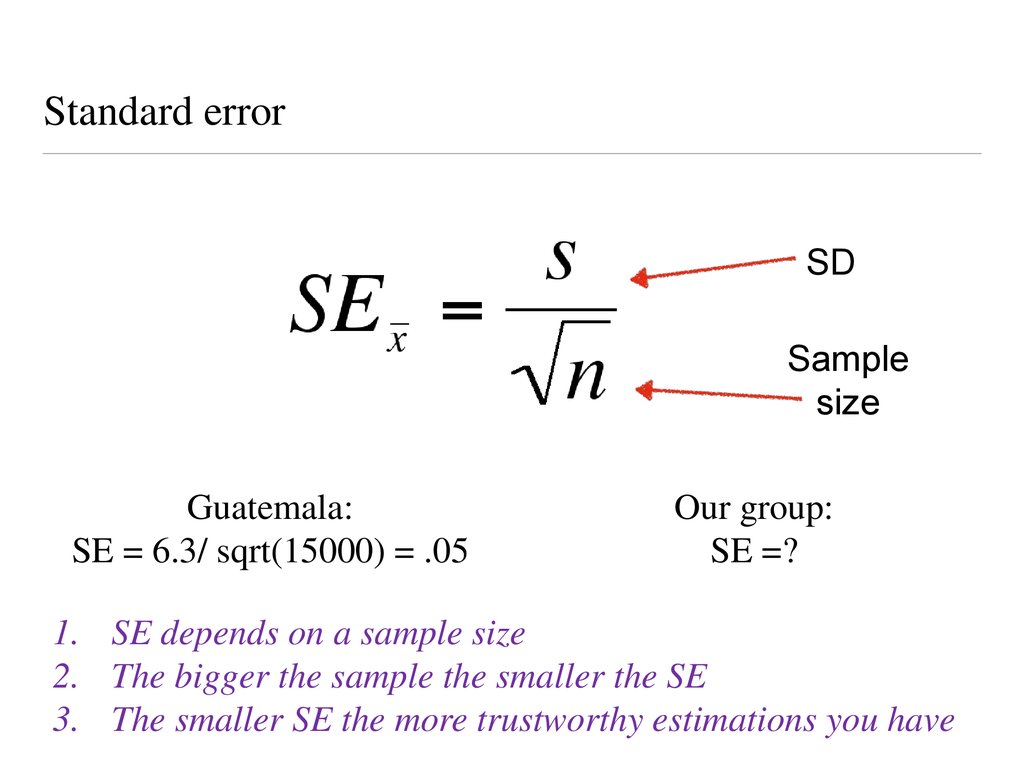
Standard errorSD
Sample
size
Guatemala:
SE = 6.3/ sqrt(15000) = .05
Our group:
SE =?
1. SE depends on a sample size
2. The bigger the sample the smaller the SE
3. The smaller SE the more trustworthy estimations you have
25. Why do bigger samples provide better estimation?
Law of Large NumbersIn the end the distribution of
heads vs tails becomes
NORMAL (50/50)
26. Sampling strategies
Probability strategyTrue random sampling
using a random number table (a computer) to select
people from a list, a phone book, etc. (a variety is called
‘systematic random sampling’ = select every nth person);
Stratified sampling / quota sampling
we define the target groups (strata) within our sample
(genders, age groups, etc.) and collect respondents from
each stratum to get the % you need
Cluster sampling
select the most representative group from a set (a class
from a school, a neighborhood from a city
Multi-stage strategies
different strategies used at different sampling stages: e.g.,
1) select a school from a city, and 2) select a number of
students from that school
Non-probability strategy
Snowball approach:
start with some respondents (e.g.,
friends), asking each to recruit
more people to the study.
Convenience sample:
people at work, students, etc.
Self-selecting sample:
those who agrees to take part in
the study; «volunteer bias».
27. Exercise: Match the statement with the appropriate term
A. The process of randomsampling
A 1. Get a list of everyone in the population
2. Select every Nth (e.g. 10th) person in the list until you
have enough participants.
B. The process of stratified
sampling
B 1. Get a list of everyone in the population
2. Identify relevant sub-groups, and divide up the
population into these groups.
3. Select randomly from these groups in the correct
proportions until you have enough participants.
C. The process of
systematic sampling
C 1. Ask known individuals to take part.
2. Ask these participants to identify others that should
participate in the study.
D. The process of
snowball sampling
D 1. Get a list of everyone in the population
2. Put all the names into a spreadsheet
3. Use software to select randomly from the spreadsheet
until you have enough participants.
28. I want to study cultural differences…/ I want to study how culture influence…
This is possible only with representative samples collectedin few countries!!!!
A non-representative or a sample from 1 country only cannot
help you with this kind of RQ
Open access data:
European Social Survey http://www.europeansocialsurvey.org/
World Values Survey http://www.worldvaluessurvey.org/wvs.jsp
European Values Survey http://www.europeanvaluesstudy.eu/
29.
Recommended reading:Howitt & Cramer, 2011, p. 232-246 (Samples).
Supplementary reading:
Bakeman, 2000 (Chapter 7 in Reis & Judd,
2000) (Observation)
Cramer, 2007 (in Robins, Fraley, Krueger,
2007) (Archival method)
Diamond & Otter-Henderson, 2007 (in Robins,
Fraley, Krueger, 2007) (Physiological
measures)
Fraley, 2007 (in Robins, Fraley, Krueger, 2007)
(Internet studies)
Wilkinson, Joffe, & Yardley, 2004 (Interviews
and focus groups)
30. Why Standardize ... ?
Example 2. Here are the students results (out of 60 points):20, 15, 26, 32, 18, 28, 35, 14, 26, 22, 17
Most students didn't even get 30 out of 60, and most will fail.
The test must have been really hard, so the Prof decides to Standardize
all the scores and only fail people 1 standard deviation below the
mean.
How many students will fail?
Answer:
The Mean is 23, and the Standard Deviation is 6,6, and these are the
Standard Scores:
-0,45, -1,21, 0,45, 1,36, -0,76, 0,76, 1,82, -1,36, 0,45, -0,15, -0,91
Only 2 students will fail (the ones who scored 15 and 14 on the test)