


 Математика
Похожие презентации:


")
")

")


Introductory statistics
1.
Introductory StatisticsLesson 2.5 A
Objective:
SSBAT find the first, second and third quartiles of a data set.
SSBAT find the interquartile range of a data set.
SSBAT represent data using a box and whisker plot.
Standards: M11.E.2.1.2, M11.E.1.1.2
2.
FractilesNumbers that partition or divide an ordered data set
into equal parts.
The median of a data set is a fractile
3.
QuartilesApproximately divide a data set into 4 equal parts
There are 3 quartiles: First, Second, Third
4.
2nd Quartile, Q2The Median of the entire data set
Half the data entries lie on or below Q2 and the other
half lies on or above Q2
5.
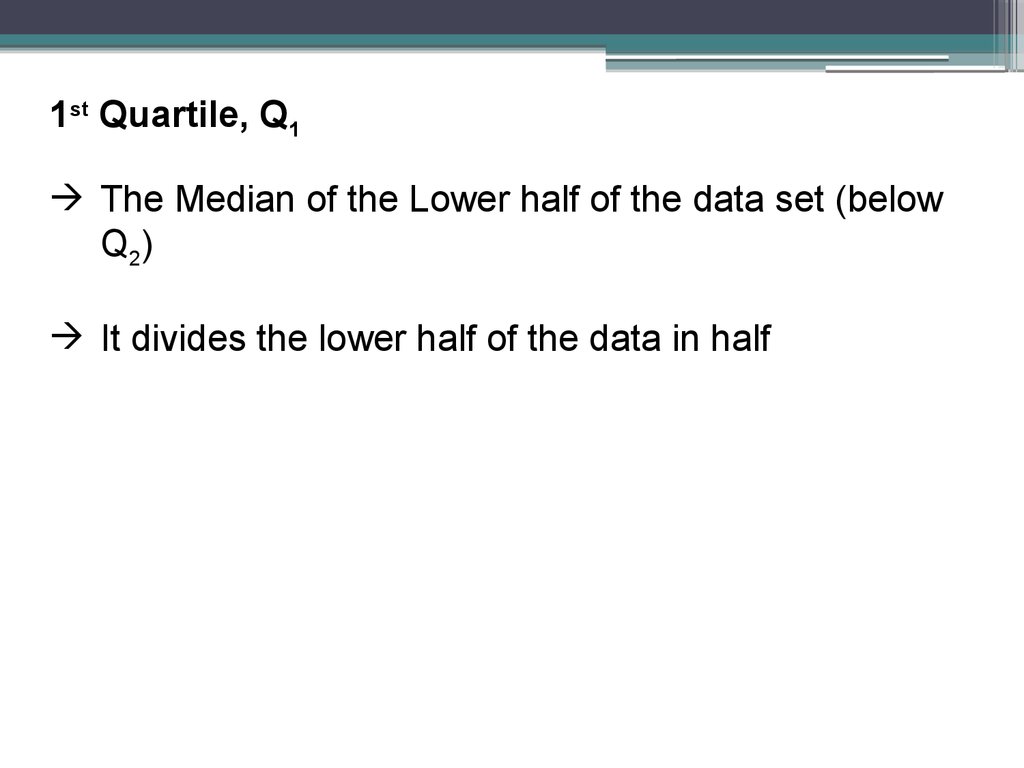
1st Quartile, Q1The Median of the Lower half of the data set (below
Q2)
It divides the lower half of the data in half
6.
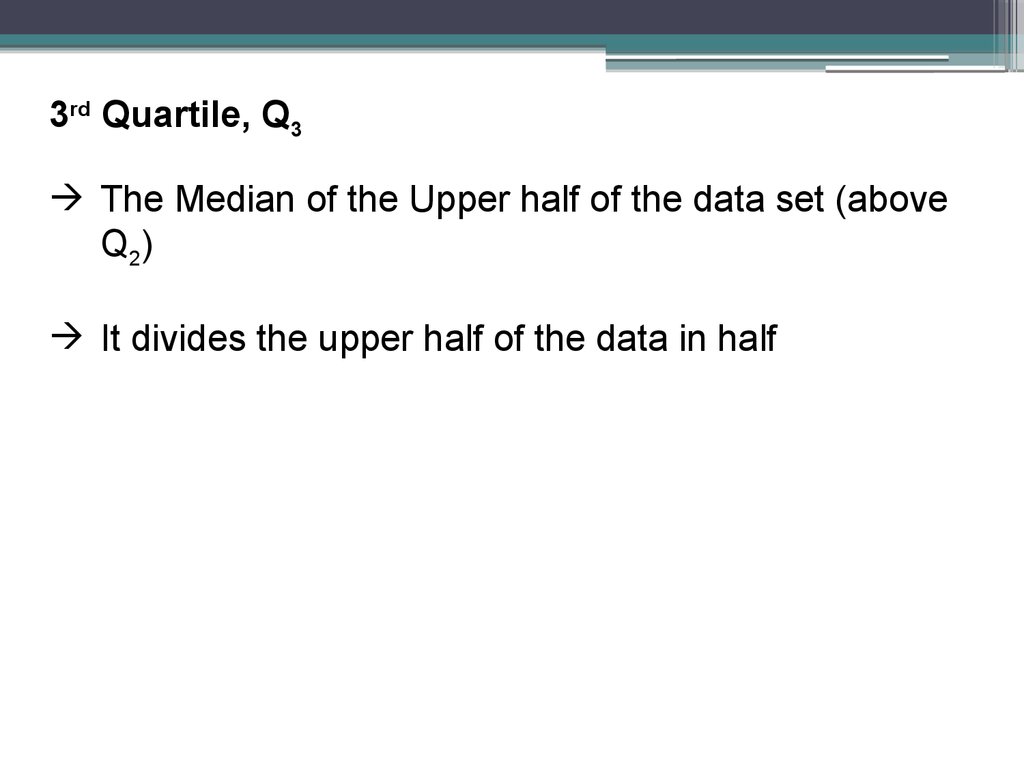
3rd Quartile, Q3The Median of the Upper half of the data set (above
Q2)
It divides the upper half of the data in half
7.
Lower Half7
8
10
Q1
13
Upper Half
13
16
Q2
17
19
22
Q3
24
25
8.
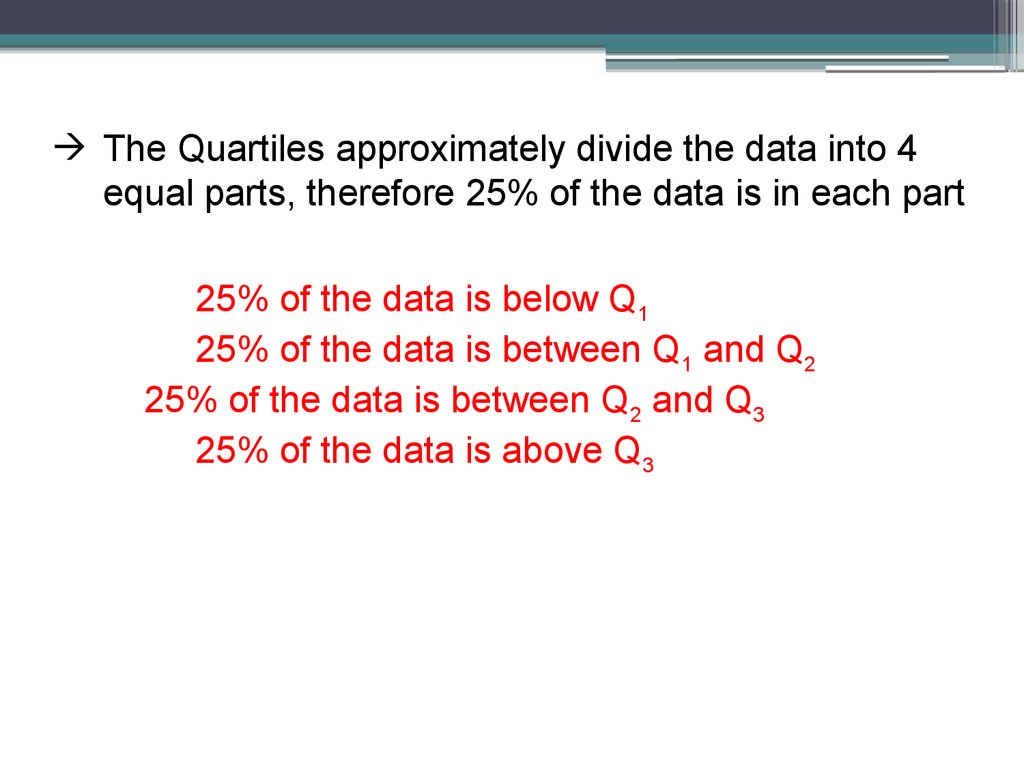
The Quartiles approximately divide the data into 4equal parts, therefore 25% of the data is in each part
25% of the data is below Q1
25% of the data is between Q1 and Q2
25% of the data is between Q2 and Q3
25% of the data is above Q3
9.
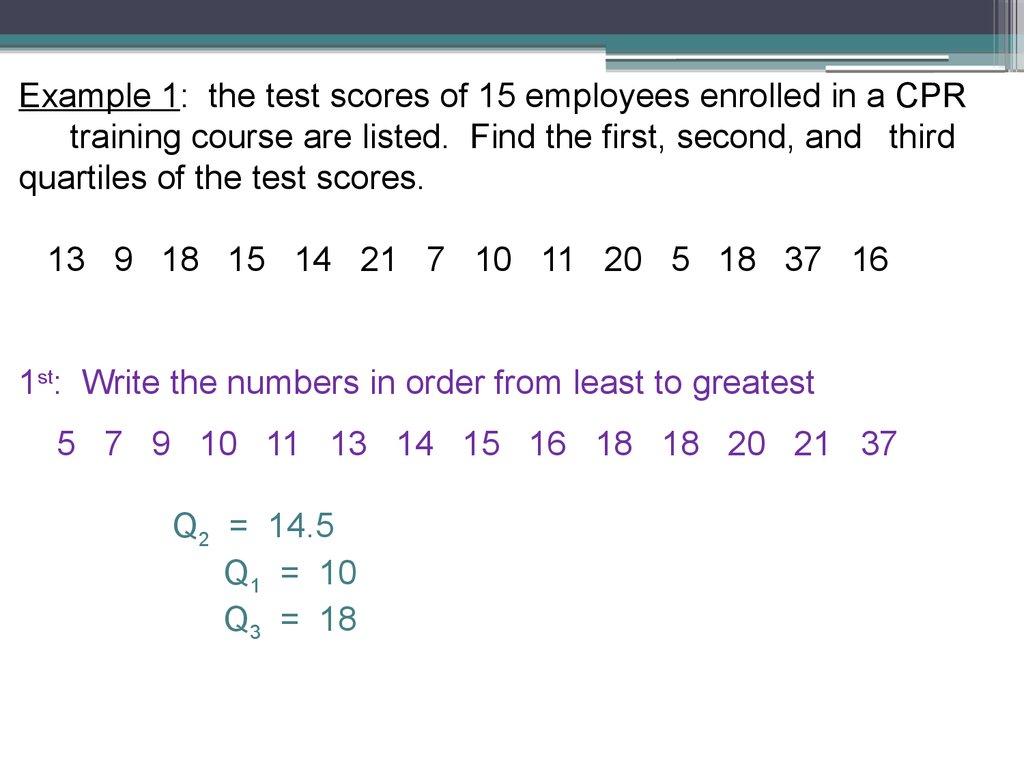
Example 1: the test scores of 15 employees enrolled in a CPRtraining course are listed. Find the first, second, and third
quartiles of the test scores.
13 9 18 15 14 21 7 10 11 20 5 18 37 16
1st: Write the numbers in order from least to greatest
5 7 9 10 11 13 14 15 16 18 18 20 21 37
Q2 = 14.5
Q1 = 10
Q3 = 18
10.
Example 2: The tuition costs (in thousands of dollars) for 11universities are listed. Find the first, second, and third quartiles.
20, 26, 28, 19, 31, 17, 15, 21, 31, 32, 16
1st: Write the numbers in order from least to greatest
15
16
17
19
Q2 = 21
Q1 = 17
Q3 = 31
20
21
26
28
31
31
32
11.
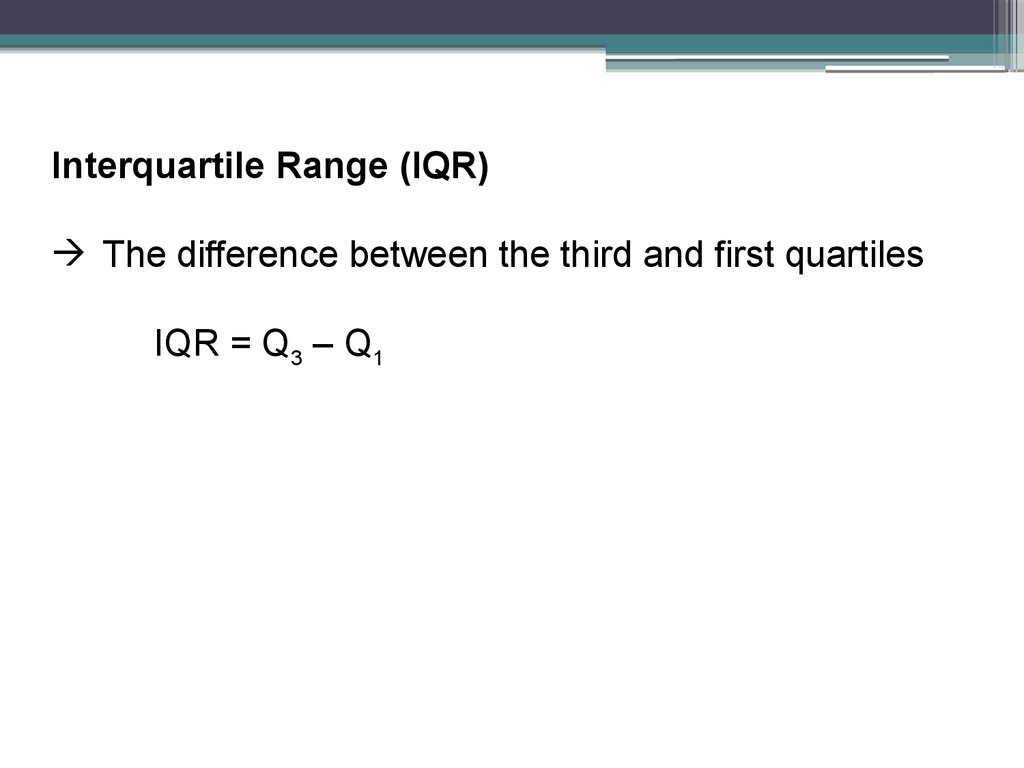
Interquartile Range (IQR)The difference between the third and first quartiles
IQR = Q3 – Q1
12.
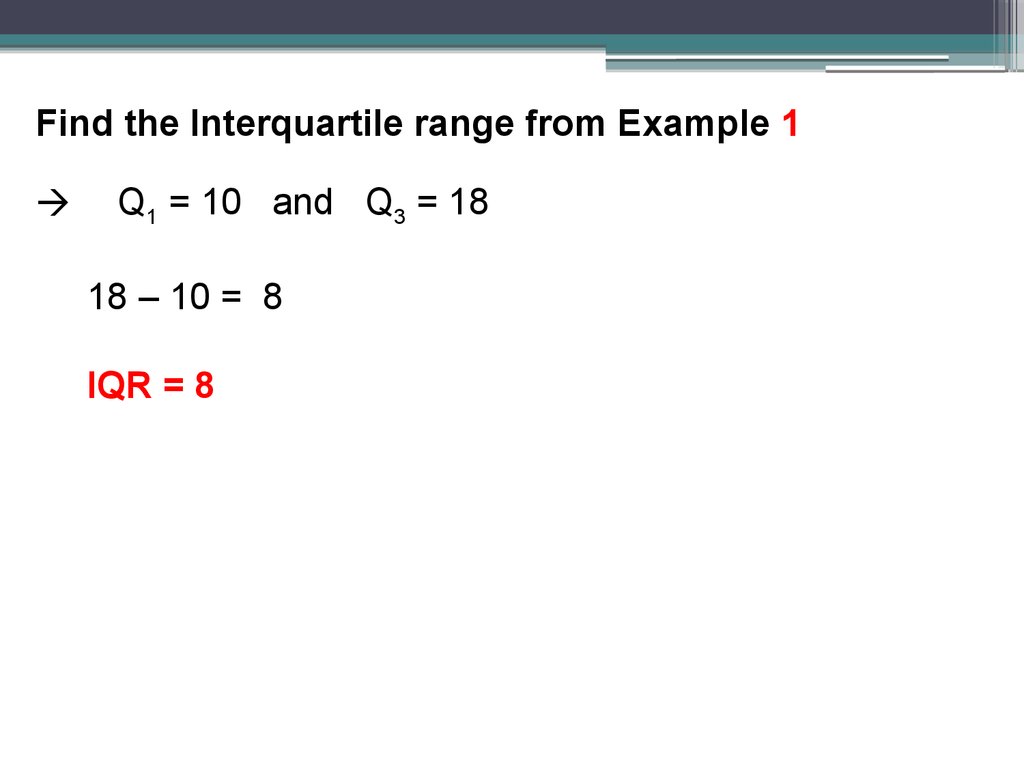
Find the Interquartile range from Example 1Q1 = 10 and Q3 = 18
18 – 10 = 8
IQR = 8
13.
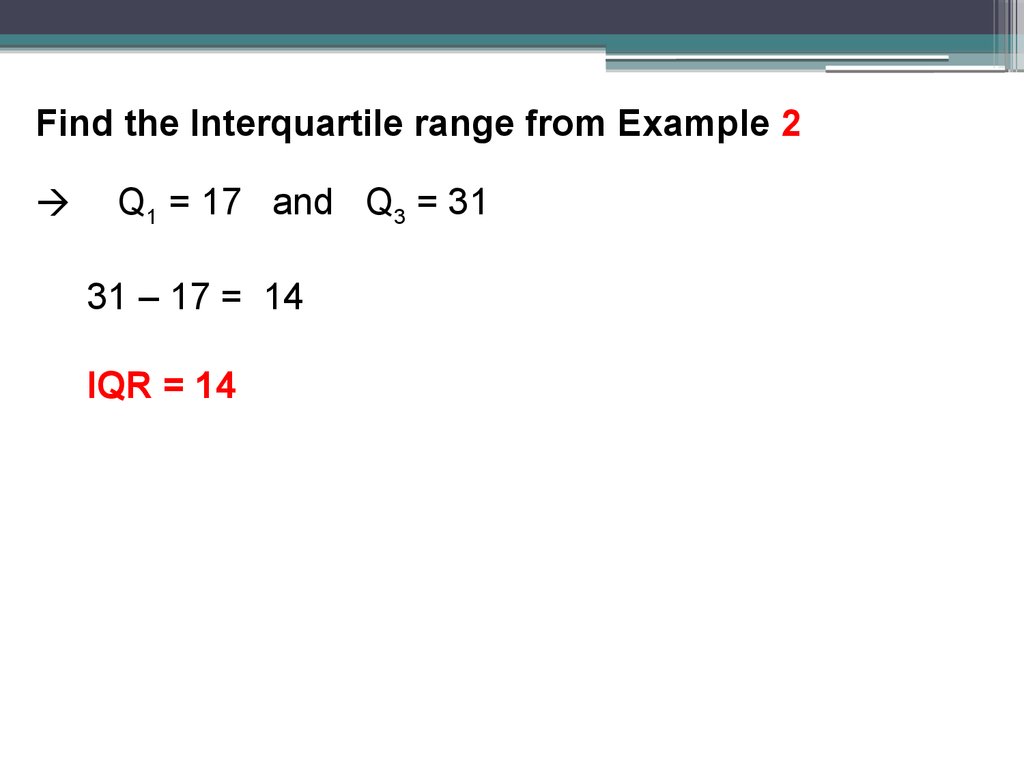
Find the Interquartile range from Example 2Q1 = 17 and Q3 = 31
31 – 17 = 14
IQR = 14
14.
IQR – Interquartile Range(Q3 – Q1)
Gives an idea of how much the middle 50% of the
data varies
It can also be used to identify Outliers
- Any number that is more than 1.5 times the IQR
to the left of Q1 or to the right of Q3 is an outlier
15.
Take a look at Example 1 The IQR is 85 7 9 10 11 13 14 15 16 18 18 20 21 37
Q2 = 14.5 Q1 = 10
Q3 = 18
Check for Outliers: Multiply 1.5 times the IQR
(1.5)(8) = 12
Add 12 to Q3 30
Any number greater than 30 in the set is an outlier
therefore 37 is an outlier
Subtract 12 from Q1 -2
Any number less than -2 is an outlier there are none
16.
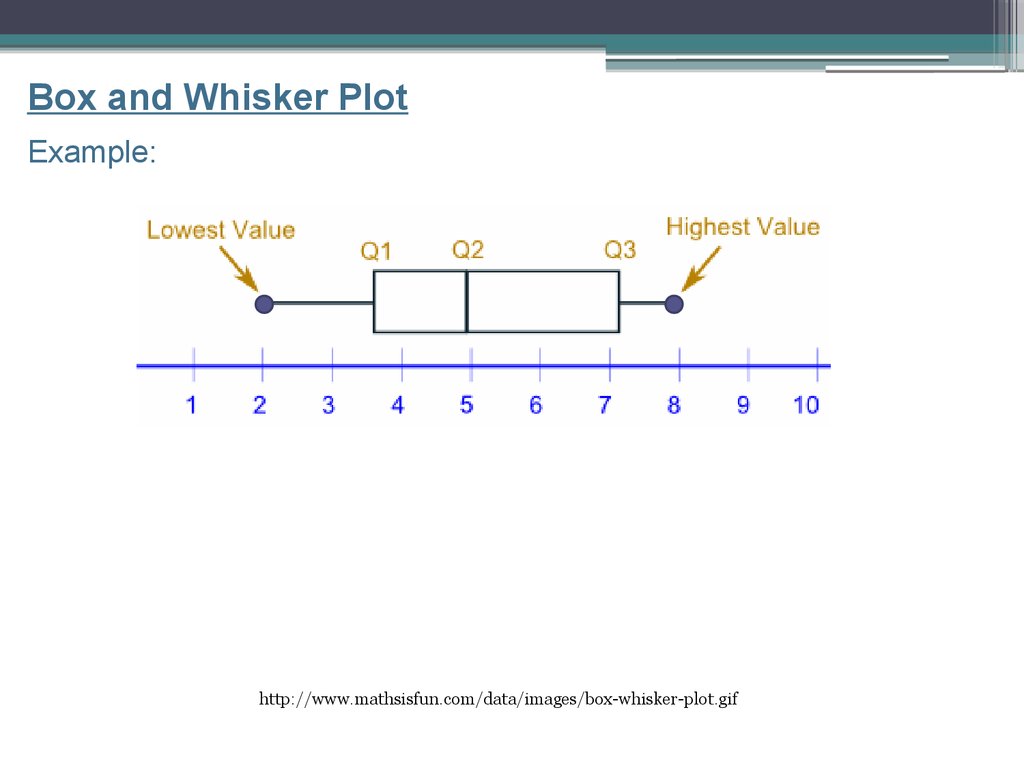
Box and Whisker PlotExample:
http://www.mathsisfun.com/data/images/box-whisker-plot.gif
17.
Box and Whisker PlotA graph that shows the Median (Q2), Quartile 1,
Quartile 3, the lowest number in the set and the
highest number in the set
About 25% of the data set is in each section
25%
25%
25%
25%
18.
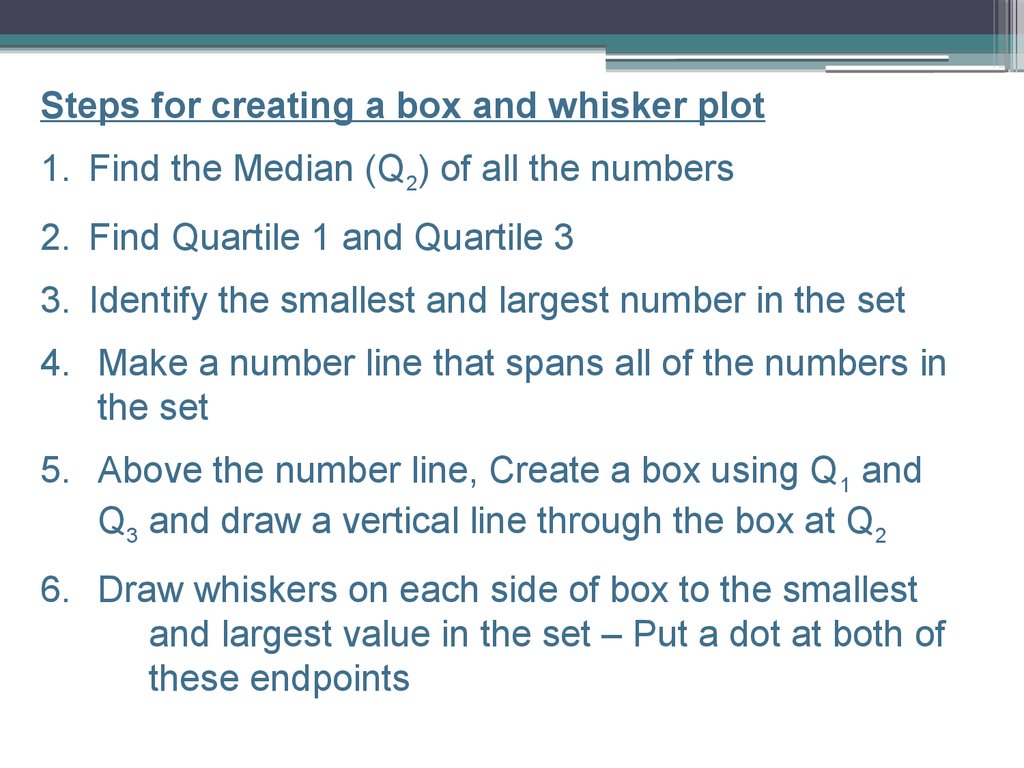
Steps for creating a box and whisker plot1. Find the Median (Q2) of all the numbers
2. Find Quartile 1 and Quartile 3
3. Identify the smallest and largest number in the set
4. Make a number line that spans all of the numbers in
the set
5. Above the number line, Create a box using Q1 and
Q3 and draw a vertical line through the box at Q2
6. Draw whiskers on each side of box to the smallest
and largest value in the set – Put a dot at both of
these endpoints
19.
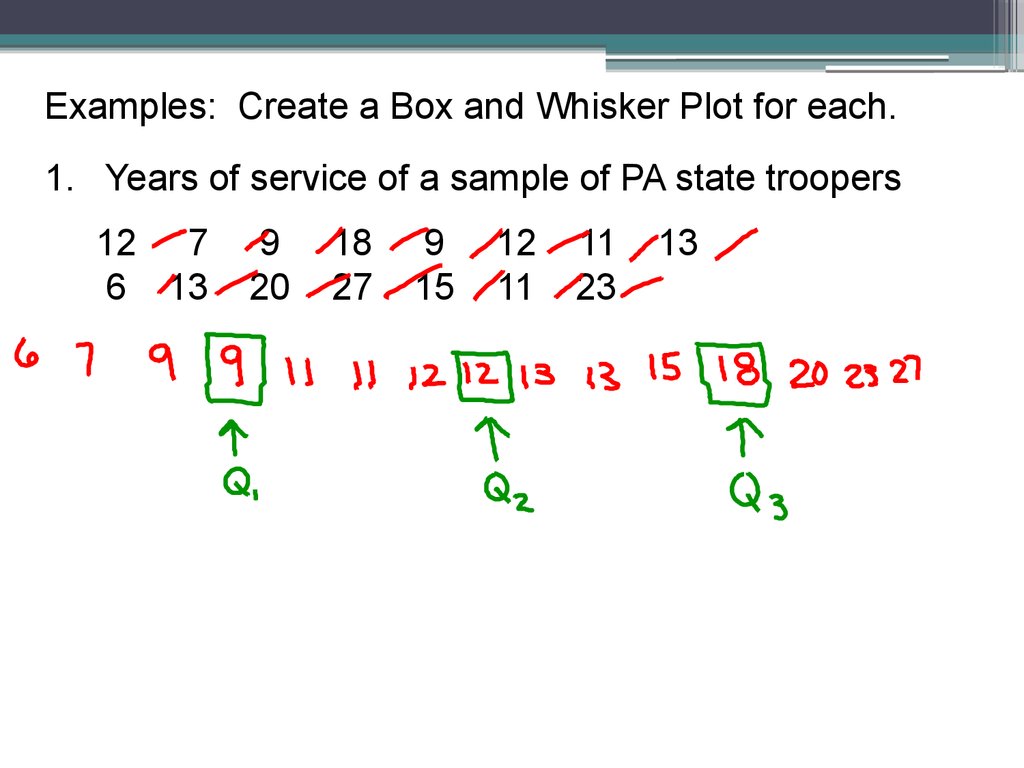
Examples: Create a Box and Whisker Plot for each.1. Years of service of a sample of PA state troopers
12 7
6 13
9
20
18
27
9
15
12
11
11
23
13
20.
21.
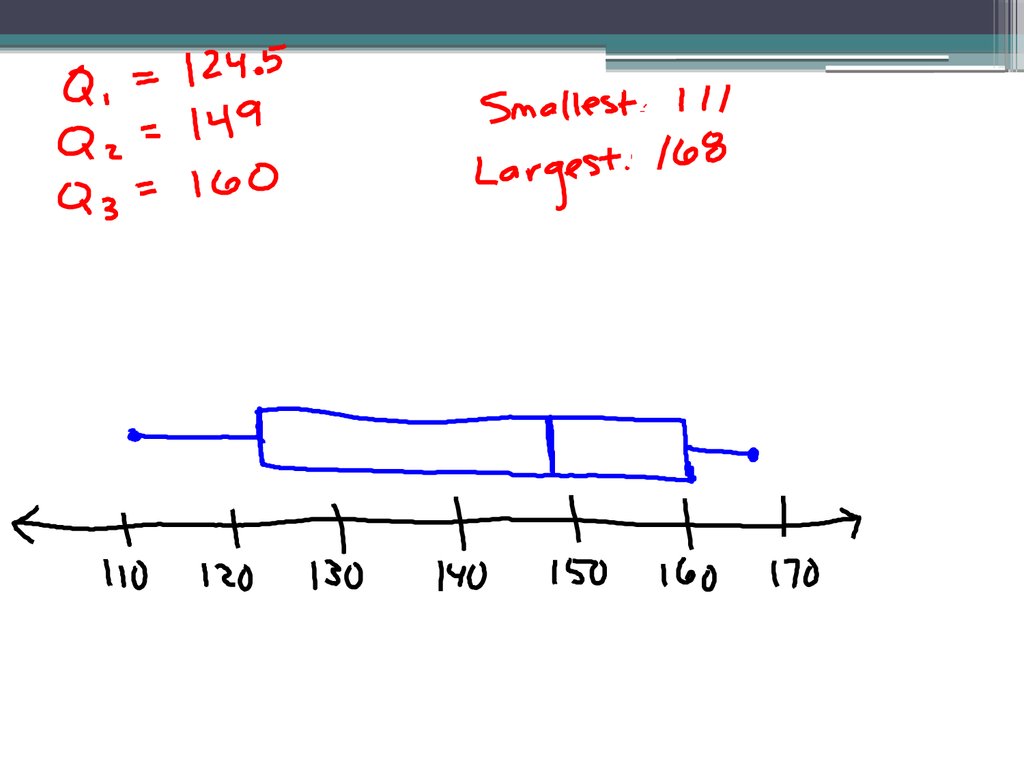
2.111 115 122 127 127 147
151 159 160 160 163 168
22.
23. Distribution Shape Based on Box and Whisker Plot
• If the median is near the center of the box and eachwhisker is approximately the same length, the
distribution is roughly Symmetric.
• If median is to the left of center of the box or right
whisker is substantially longer than the left, the
distribution is Skewed Right.
• If median is to the right of center of the box or the
left whisker is substantially longer than the right,
the distribution is Skewed Left.
24.
Complete together #11 on page 109Homework
Page 109 – 110
#1, 12, 14, 18, 19, 20