


 Промышленность
Похожие презентации:


NIR Systems
1.
CEMTREX, INC.MODCON SYSTEMS LTD
NIR Systems
July 2010
2.
NIR Spectroscopy PrincipleBeer–Lambert law
Logarithmic dependence between the transmission T, of light
through a substance and the product of the absorption A
coefficient of the substance, α, and the distance the light travels
through the material (i.e. the path length), ℓ.
3.
NIR Analyzers Advantage• Low Cost of Ownership
• Optimized production processes by real
time monitoring
• Improved process knowledge
• Expensive and time consuming
laboratory analyses are no longer
necessary
• Improved quality assurance
• Minimal maintenance required
• Easy to calibrate - automatic calibration
model updating
• Powerful communication system
4.
Beacon 3000 NIR Analyzer Advantage• Connection to up to 8 process
stream sensors
• No longer location-specific can be
situated up to 2 miles (3,2km)
away from main analyzer
• Use of standard
telecommunication fiber optics
• Contains no moving parts
• No electricity required
5.
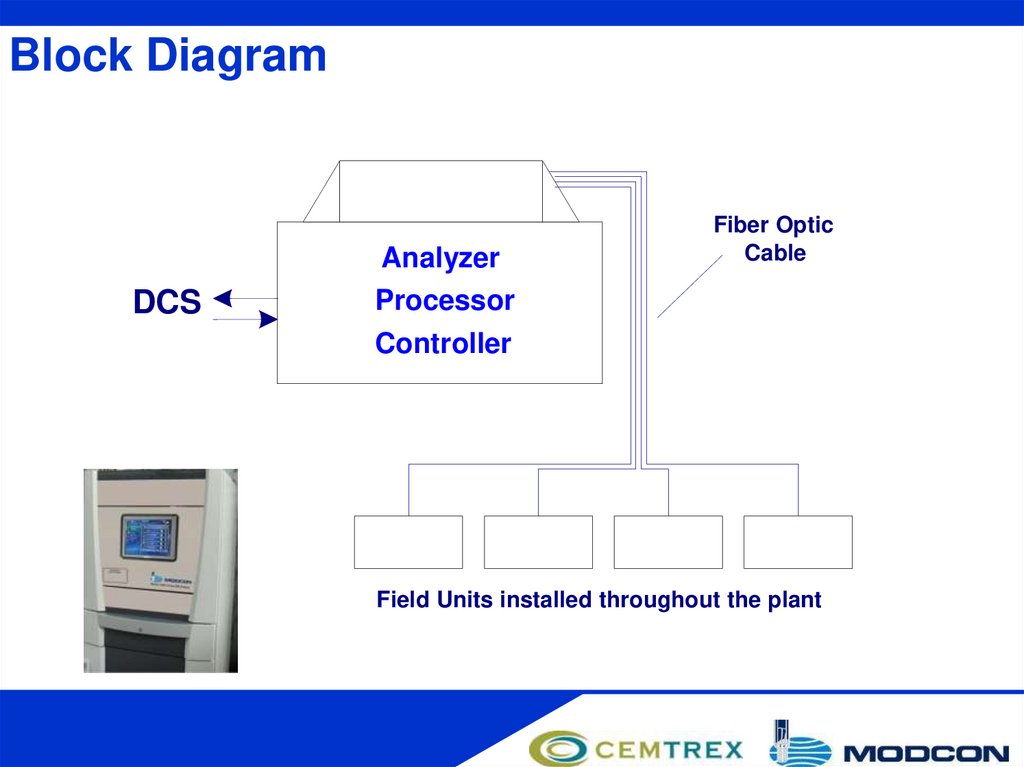
Block DiagramDCS
Analyzer
Processor
Controller
Fiber Optic
Cable
Field Units installed throughout the plant
6.
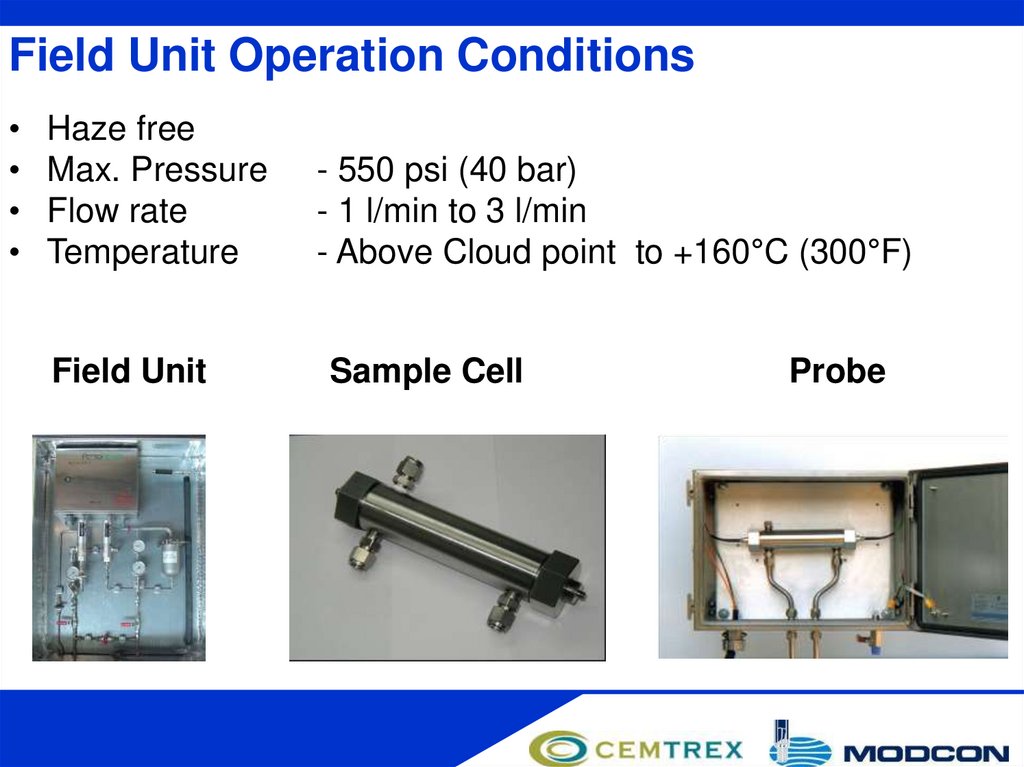
Field Unit Operation ConditionsHaze free
Max. Pressure
Flow rate
Temperature
Field Unit
- 550 psi (40 bar)
- 1 l/min to 3 l/min
- Above Cloud point to +160°C (300°F)
Sample Cell
Probe
7.
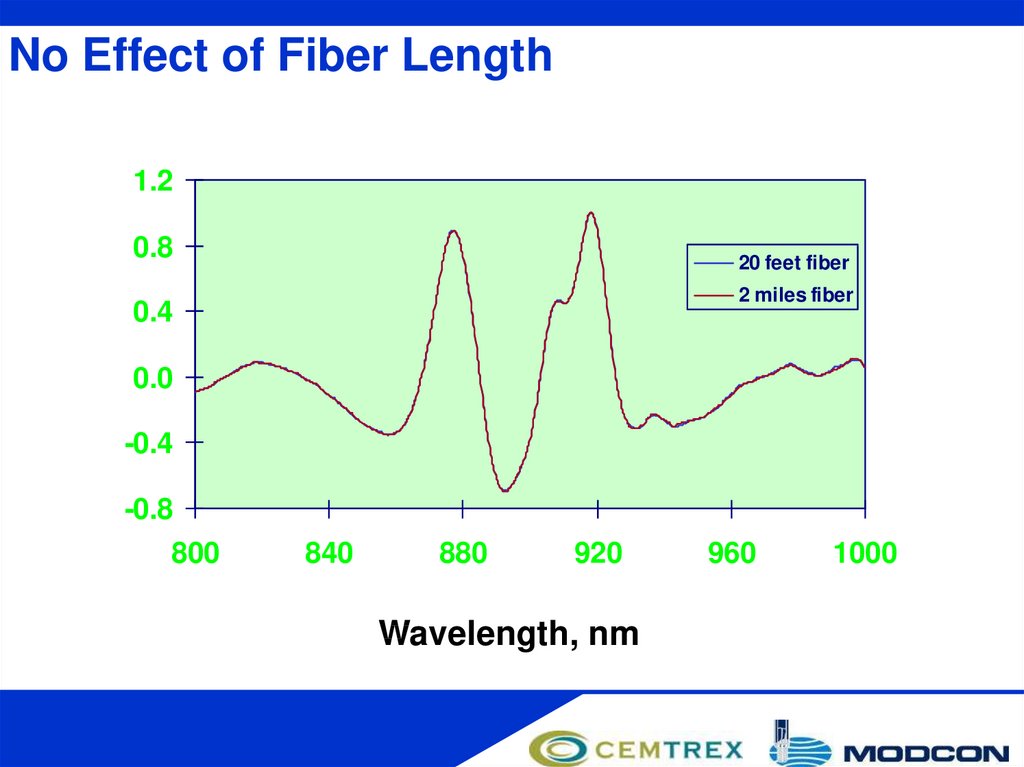
No Effect of Fiber Length1.2
0.8
20 feet fiber
2 miles fiber
0.4
0.0
-0.4
-0.8
800
840
880
920
Wavelength, nm
960
1000
8.
From Spectral Information to Electronic DataLight
Source
Field Unit
Reports
Detector
Module
Measured Spectra
Measured Spectra
3.00
Properties
Calculation
2.00
Processor
1.00
0.00
-1.00
-2.00
800
850
900
950
1000
9.
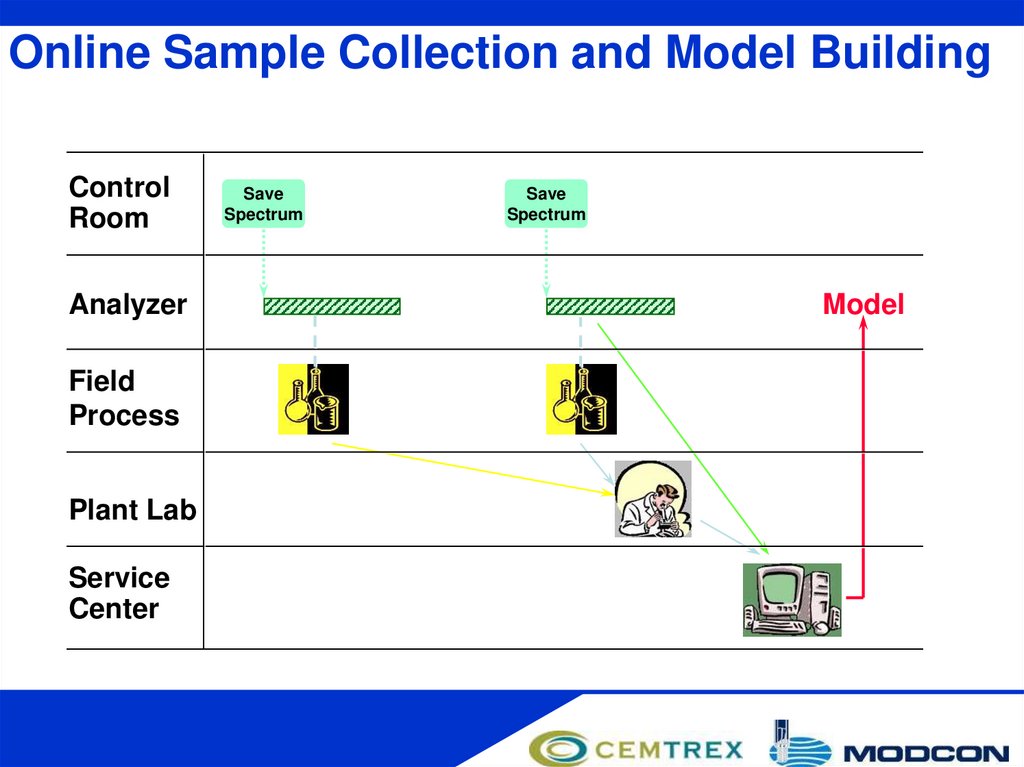
Online Sample Collection and Model BuildingControl
Room
Analyzer
Field
Process
Plant Lab
Service
Center
Save
Spectrum
Save
Spectrum
Model
10.
Principles of Chemo-metricsCalibration Phase
Reference Spectra
Reference Measurements
mix#
0.25
0.2
0.15
0.25
0.1
0.2
0.05
0.15
0
0.1
0.2
-0.05
810 0.05
0.15
860
0.1
0.2
-0.1
0
-0.05
810 0.05
0.15
860
-0.15
0.25
0.25
910
-0.1
0
0.1
-0.15
-0.05
810 0.05
-0.1
0
-0.15
-0.05
960
1010
910
860
810
960
910
860
+
1060
1010
960
910
1060
1010
960
1060
1010
1060
HCl
0
1
2
3
4
5
6
7
8
9
10
11
12
13
14
0
1.178964
0.790395
1.090314
1.06258
0.852719
0.99566
0.873404
0.988138
0.849897
1.000474
1.102819
1.135659
0.799425
0.950737
Calibration Model
HF
0
0.39912
0.442637
0.496751
0.543865
0.593886
0.634382
0.669103
0.721126
0.778561
0.81478
0.853354
0.893109
1.009638
0.958367
-0.1
-0.15
Measurement Phase
Unknown Spectra
Real Time Results
Calibration Model
0.25
0.2
+
0.15
0.1
0.05
A1(t)
A2(t)
tote changeover
new lot changeover
0.04
0.03
0.02
0.01
0.05
0
0
-0.05
-0.01
-0.1
-0.02
-0.15
-0.03
-0.04
-0.2
-0.05
-0.25
Wed
07/7
Fri
09/7
Sun
11/7
Tue
13/7
Thu
15/7
Sat
17/7
Mon
19/7
Wed
21/7
Fri
23/7
Sun
25/7
Tue
27/7
Thu
29/7
Sat
31/7
Mon
02/8
Wed
04/8
Fri
06/8
11.
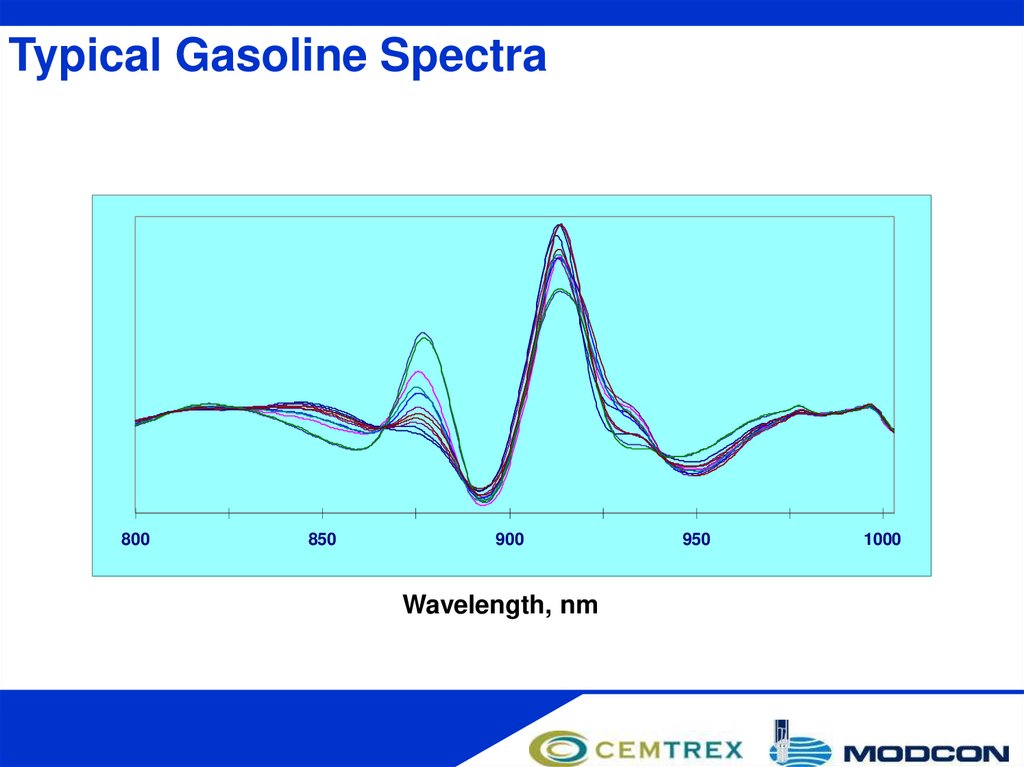
Typical Gasoline Spectra800
850
900
Wavelength, nm
950
1000
12.
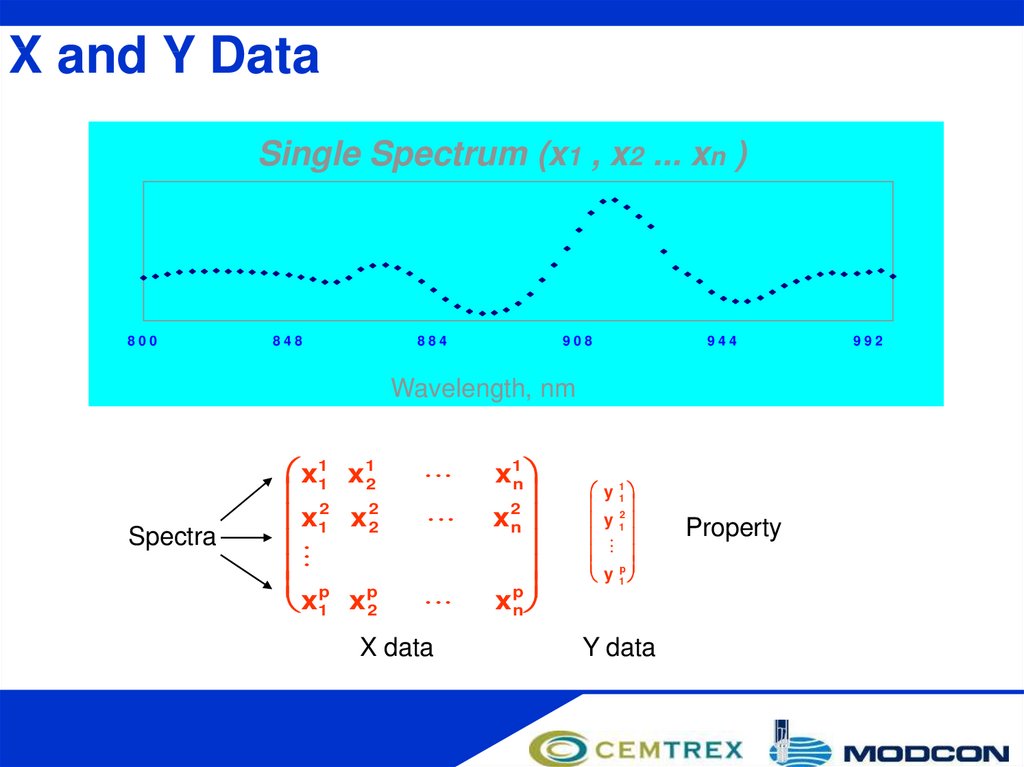
X and Y DataSingle Spectrum (x1 , x2 ... xn )
x11 x12
2 2
x1 x 2
p p
x1 x 2
800
848
884
908
944
Wavelength, nm
Spectra
x11 x12
2
x1 x 22
p p
x1 x 2
X data
x1n
2
xn
p
xn
y 11
y 12
y 1p
Y data
Property
x1n
x n2
x pn
992
13.
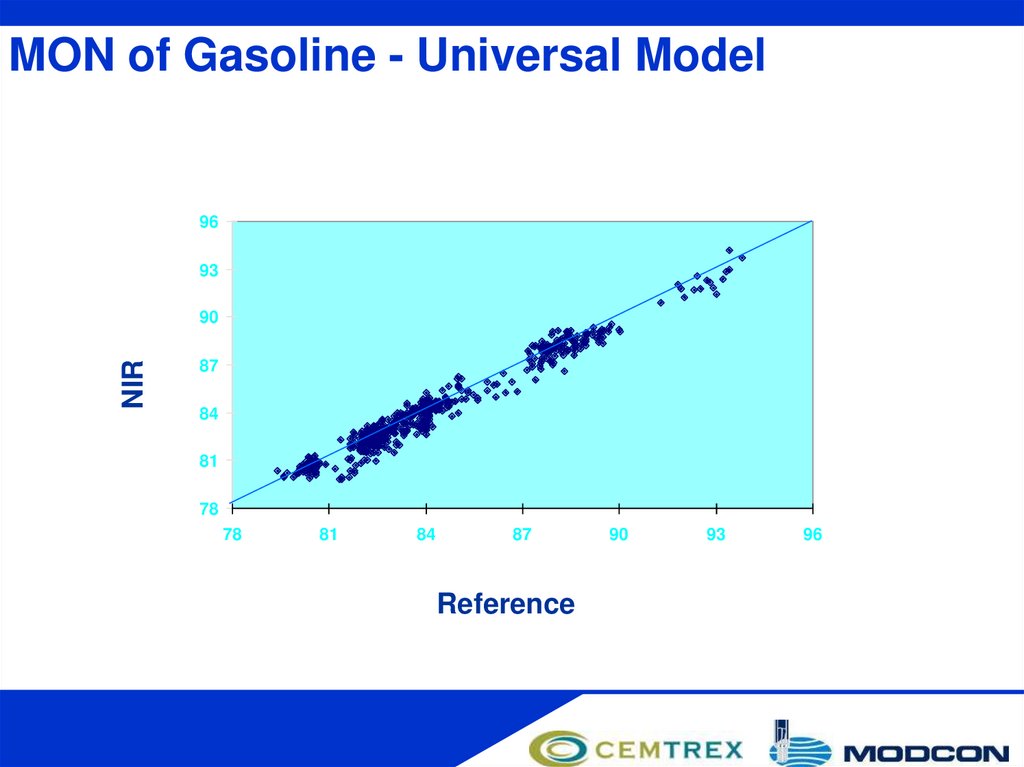
MON of Gasoline - Universal Model96
93
NIR
90
87
84
81
78
78
81
84
87
Reference
90
93
96
14.
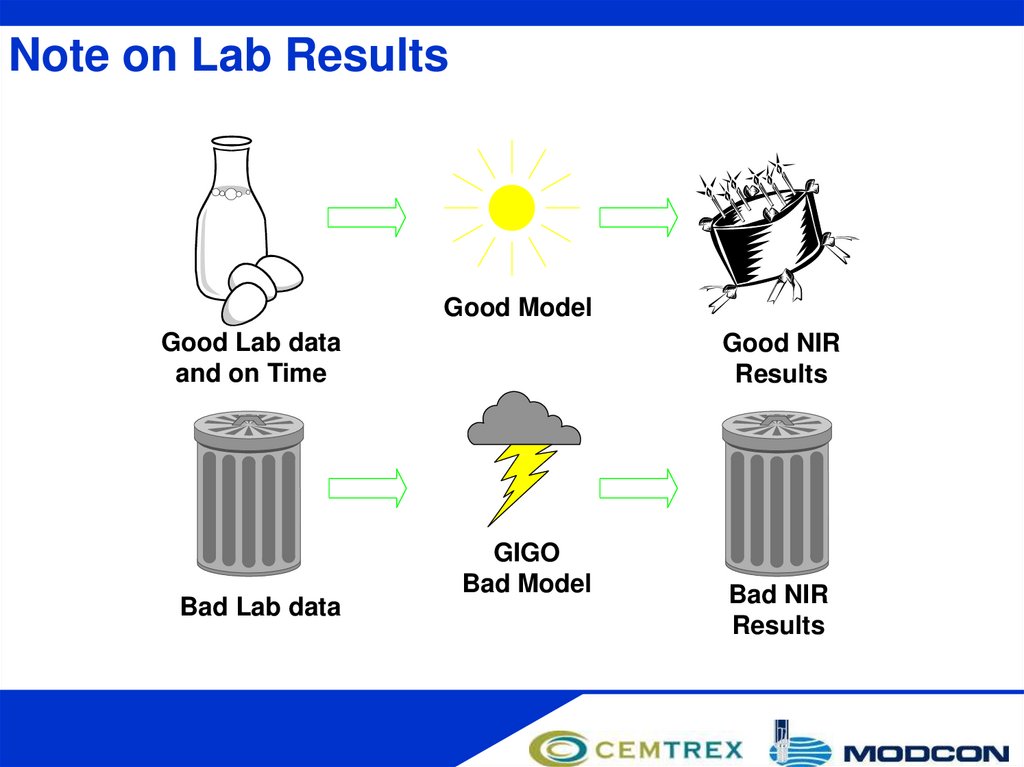
Note on Lab ResultsGood Model
Good Lab data
and on Time
Bad Lab data
Good NIR
Results
GIGO
Bad Model
Bad NIR
Results
15.
Statistic NomenclatureRoot Mean Square Error of Prediction
n
2
(
ŷ
y
)
i i
RMSEP
i 1
n
ŷ - laboratory reference
y - calculated value
Standard Error of Prediction
n
2
(
ŷ
y
Bias)
i i
SEP
i =1
n -1
Average Difference between ŷ and
n
Bias
i 1
( yˆ i yi )
n
y in Prediction Set
16.
Modcon SolutionFree-tune Software
This software program is composed of two sequential blocks:
I. PLS regression is used to build a localized sensitive model (LSM) based on
just a small number of samples. One of the characteristics of this model is its
sensitivity to short term (hours) process variations. Since it is localized, the
model can be quickly built and validated. This procedure takes up to one week
and can be performed prior to startup.
II. A proprietary software program processes the model, together with the
specified plant data, to accurately quantify the properties. This part deals with
predicting the long-term product variability.
Monitored Variable
NIR Spectra
PreProcessing
Laboratory Data
LSM
Advanced
Processing
Validity Flag
17.
Model UpdatingModel updating during the crude switching
18.
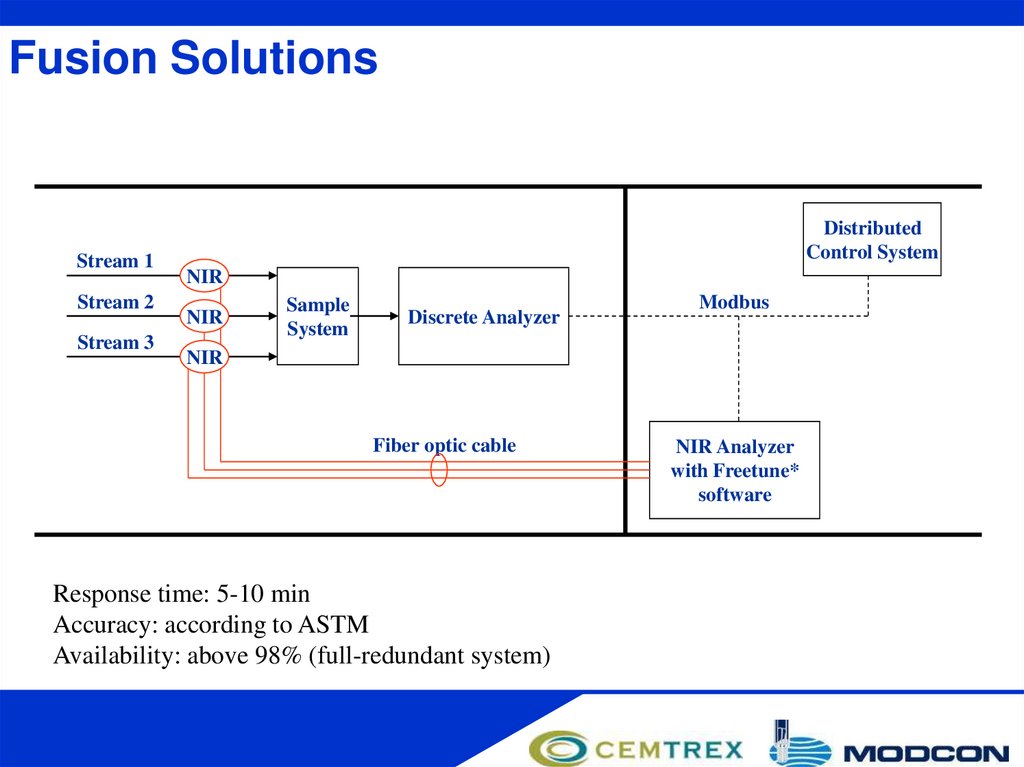
Fusion SolutionsStream 1
Stream 2
Stream 3
Distributed
Control System
NIR
NIR
Sample
System
Discrete Analyzer
Modbus
NIR
Fiber optic cable
Response time: 5-10 min
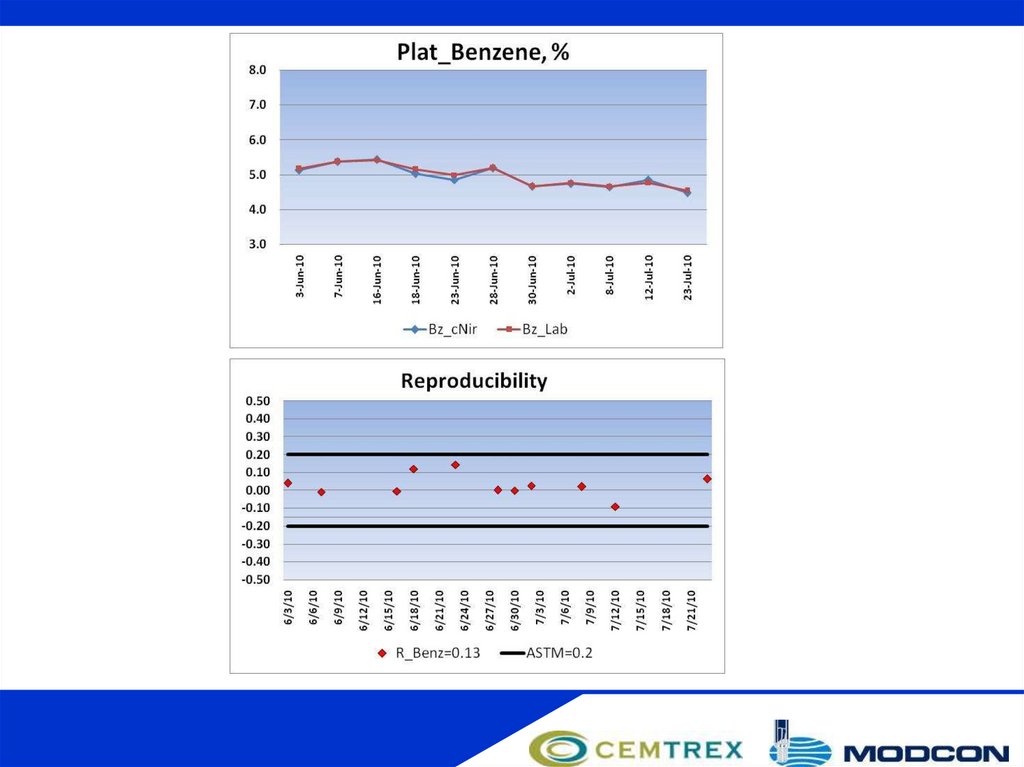
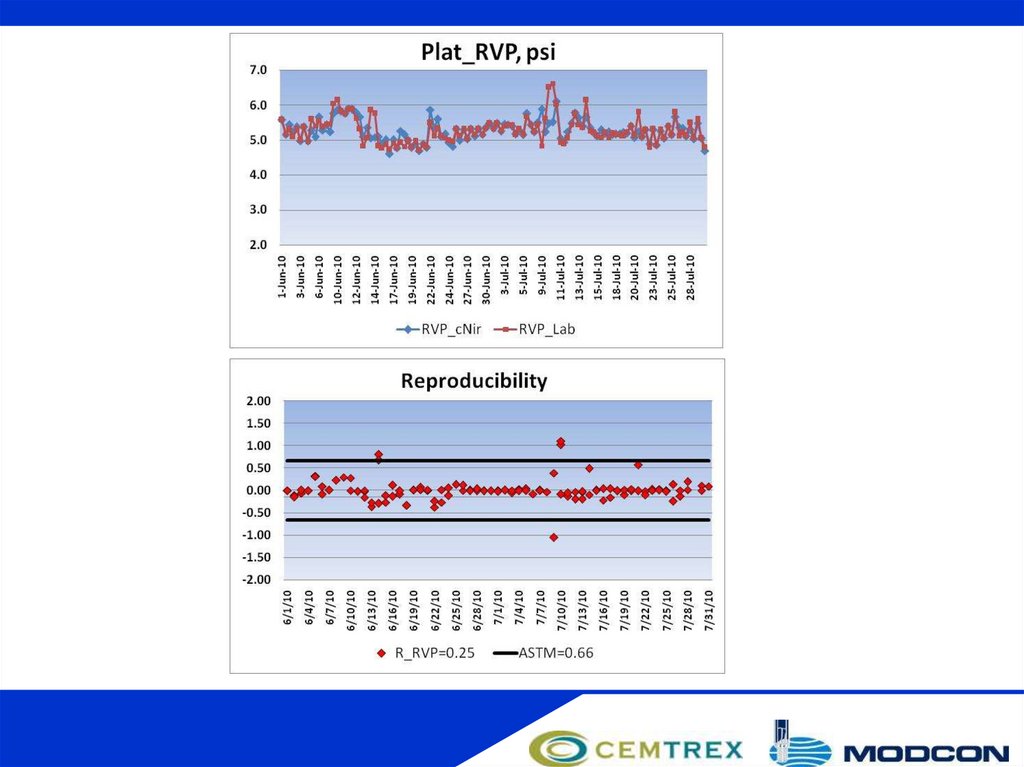
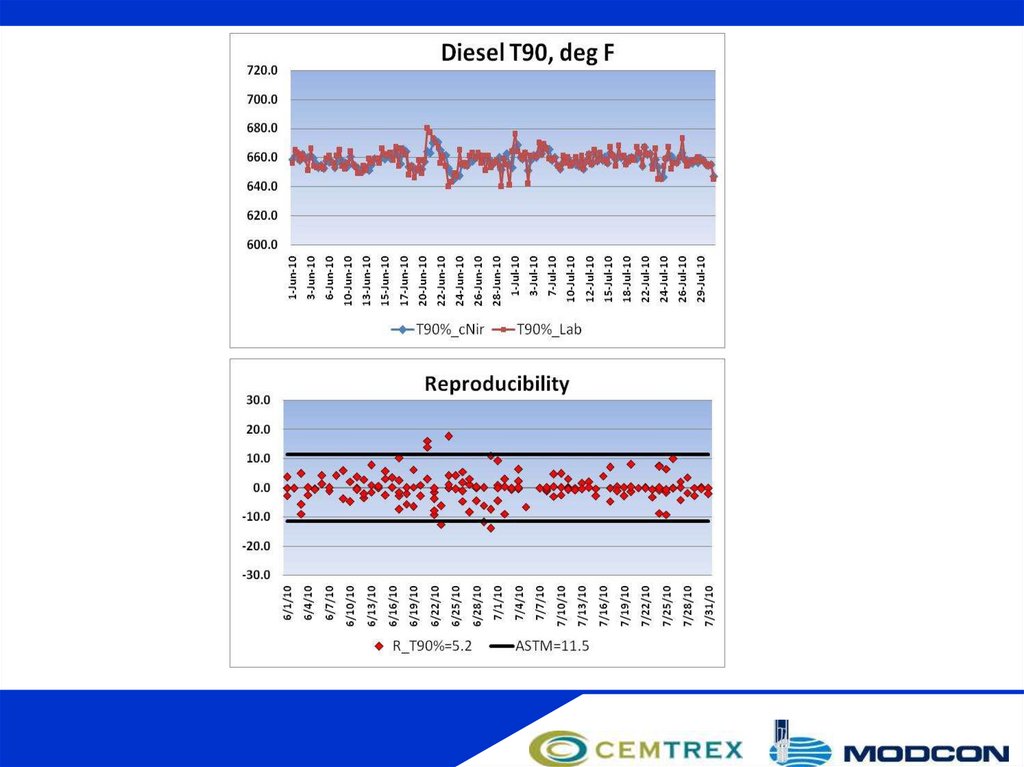
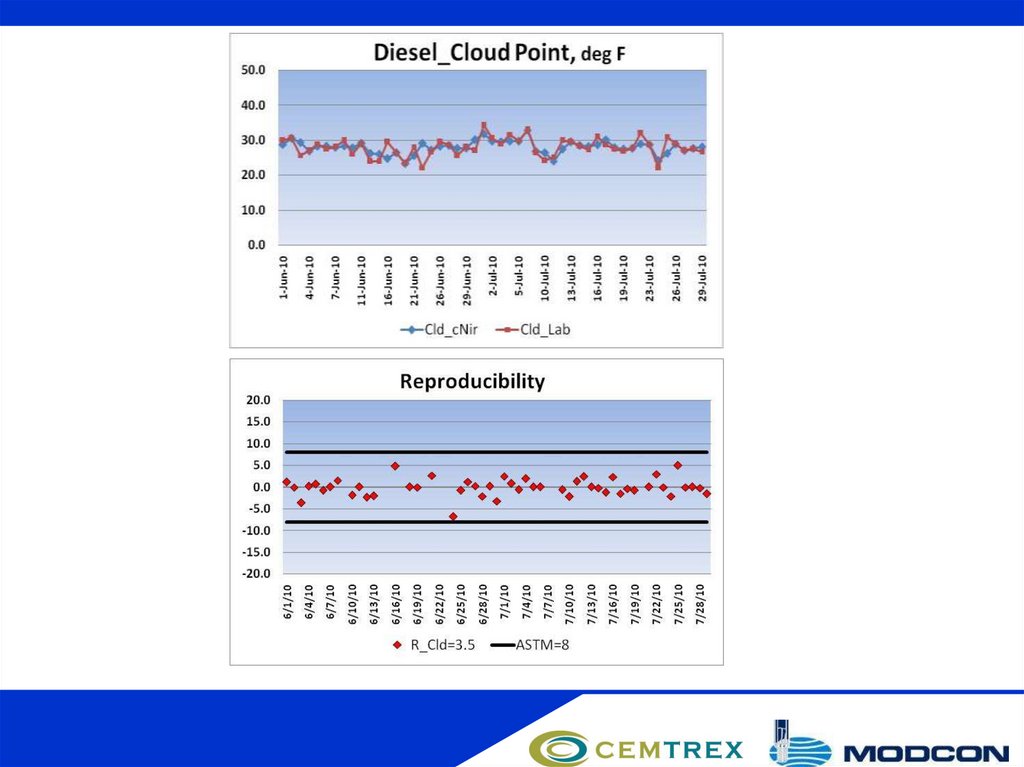
Accuracy: according to ASTM
Availability: above 98% (full-redundant system)
NIR Analyzer
with Freetune*
software