


 Бизнес
Похожие презентации:


Business Statistics
1.
Business StatisticsShirley
SHAO
2020.3
2.
Brief Introduction of the lecturerShirley SHAO
Bachelor of Finance, Liaoning University
Master of Finance, University of Sydney,
Australia
Ph.D. of Economics, Liaoning University
Visiting scholar, Fort Hays State University,
USA
Visiting scholar, Middlesex University, UK
Email shaoruo2008@163.com
Chap 1-2
3.
In Today’s Business World YouCannot Escape From Data
In today’s digital world ever increasing amounts
of data are gathered, stored, reported on, and
available for further study.
You hear the word data everywhere.
Data are facts about the world and are
constantly reported as numbers by an ever
increasing number of sources.
4.
Each Business Person Faces A Choice Of HowTo Deal With This Explosion Of Data
They can ignore it and hope for the best.
They can count on other people’s summaries of
data and hope they are correct.
They can develop their own capability and
insight into data by learning about statistics and
its application to business.
5.
Statistics Is Evolving So Businesses CanUse The Vast Amount Of Data Available
The emerging field of Business Analytics makes
“extensive use of:
Data
Statistical and quantitative analysis
Explanatory & predictive models
Fact based management
to drive decisions and actions.”
6.
What is Meant by Statistics?Statistics is the science of collecting,
organizing, presenting, analyzing, and
interpreting numerical data to assist in
making more effective decisions.
Chap 1-6
7.
Why Study Statistics?Numerical information is everywhere
•2.5 EB bytes of data is created every
day. •2,500,000,000,000,000,000 bytes
•More than 30 million sensors are being
used. •More than 5 billion people were
using mobile phones in 2017.
Chap 1-7
8.
Why Study Statistics?Today, there are 1.8 billion young people
between the ages of 10 and 24 in the world.
One point eight billion young women and young
men are standing at the door of adulthood.
Are they ready?
Right now, too few of them are.
Chap 1-8
9.
Why Study Statistics?Every month, 10 million young people reach
working age. It’s a staggering number. Some
will go on for further education, but many will
enter the workforce.
And our world is not creating 10 million new
jobs each month. The competition is fierce for
the jobs that are available.
So, imagine being a young person today,
needing a job, seeking a livelihood, ready to
build a future, and opportunities are hard to
find.
Chap 1-9
10.
Why Study Statistics?We are finding ourselves at a time in the world
when the world is changing so fast for work.
We’re in the fourth industrial revolution.
Young people do not want to be on the farms and in
rural communities. They want to go to the cities.
They want to learn future skills for future work.
They want to learn digital technology.
They want to learn business and entrepreneurship, so
that they can create a business of their own.
Chap 1-10
11.
Who Uses Statistics?A teacher?
A researcher?
A coach?
A businessman?
A government policy maker?
etc...
Chap 1-11
12.
Who Uses Statistics?Statistical techniques are used extensively
by marketing, accounting, finance, quality
control, consumers, professional sports
people, hospital administrators, educators,
politicians, physicians, etc...
Chap 1-12
13.
Howshall we learn for this lesson ?
1. To get the principal knowledge through
the lesson. Take down lecture notes)
2. To consolidate the knowledge through
self-learning with supplementary materials,
and by doing exercises after lesson.
3. To have discussions on the subject
between students, or between students
and the teacher in the lesson or after the
lesson.
PPT & Textbook
13
14.
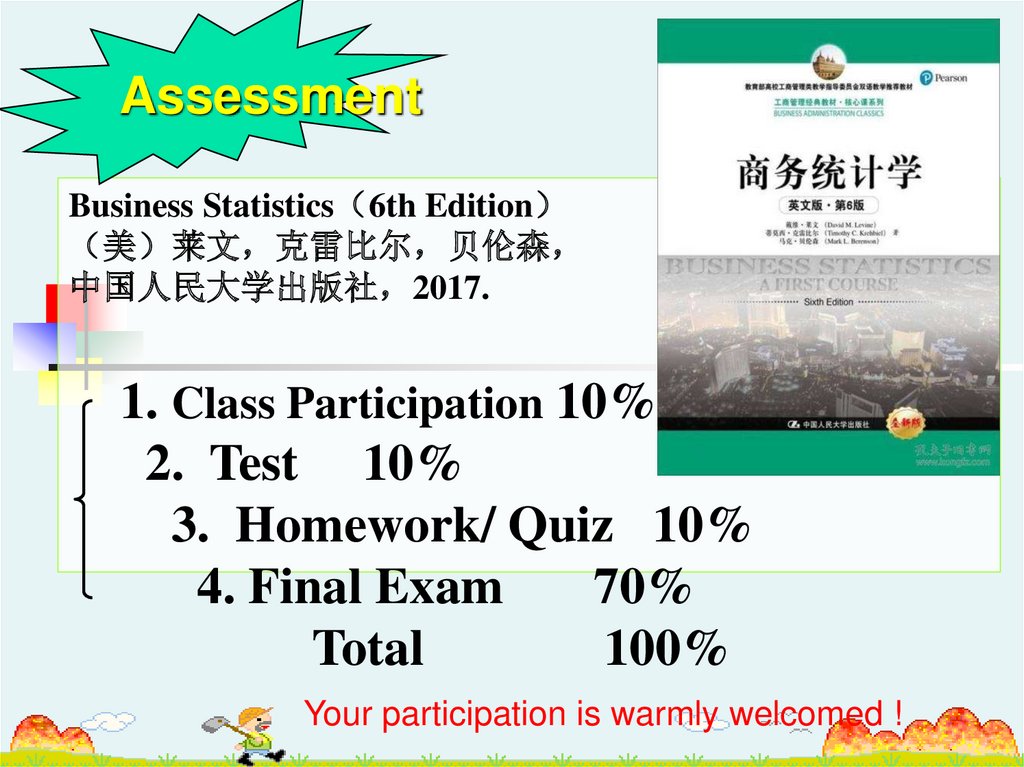
AssessmentBusiness Statistics 6th Edition
美 莱文 克雷比尔 贝伦森
中国人民大学出版社 2017.
1. Class Participation 10%
2. Test 10%
3. Homework/ Quiz 10%
4. Final Exam
70%
Total
100%
Your participation is warmly welcomed !
15.
SMART16.
Business Statistics: A First Course6th Edition
Chapter 1
Introduction
Copyright ©2013 Pearson Education, Inc. publishing as Prentice Hall
Chap 1-16
17.
Learning ObjectivesIn this chapter you learn:
What statistics is
How statistics is fundamental to business
The basic concepts and vocabulary of
statistics
Copyright ©2013 Pearson Education, Inc. publishing as Prentice Hall
Chap 1-17
18.
GOALS1.Understand why we study statistics.
2.Explain what is meant by descriptive statistics
and inferential statistics.
3.Distinguish between a qualitative variable and a
quantitative variable.
4. Describe how a discrete variable is different
from a continuous variable.
Copyright ©2013 Pearson Education, Inc. publishing as Prentice Hall
Chap 1-18
19.
In Business, Statistics HelpsTransform numbers into useful information for
decision makers
Quantify & identify the risks in a business
decision
You understand and reduce the variation in a
decision making process
Copyright ©2013 Pearson Education, Inc. publishing as Prentice Hall
Chap 1-19
20.
Which is correct?A. The data is . . .
B. The data are . . .
Copyright © 2011 Pearson Education, Inc.
Slide 1- 20
21.
Which of the following is not a step inusing statistics to make business
decisions?
A. Plan
B. Repeat
C. Do
D. Report
Copyright © 2011 Pearson Education, Inc.
Slide 1- 21
22.
Statistics can be used forA. Assessing risk
B. Predicting results
C. Understanding our world
D. All of the above
Copyright © 2011 Pearson Education, Inc.
Slide 1- 22
23.
Statistics is a way of reasoning.A. True
B. False
Copyright © 2011 Pearson Education, Inc.
Slide 1- 23
24.
Statistics helps us make sense of this sowe can learn from data?
A. Variation
B. Constancy
C. Numbers
D. World
Copyright © 2011 Pearson Education, Inc.
Slide 1- 24
25.
Which of the following is not an objectiveof Business Statistics: A First Course 1/e :
A. Develop the insights to think clearly
about questions
B. Use tools to show what the data are
saying
C. Give formulas to memorize
D. Acquire skills to interpret what it all
means
Copyright © 2011 Pearson Education, Inc.
Slide 1- 25
26.
Two Different Branches OfStatistics Are Used In Business
Statistics
Transforms data into useful information for decision
makers.
Descriptive
Statistics
Collecting, summarizing,
visualizing, presenting
and analyzing data
Inferential Statistics
Using data collected from a
small group to draw
conclusions about a larger
group
Chap 1-26
27.
Descriptive StatisticsCollect data
Summarize, visualize, present data
e.g., Survey
e.g., Tables and graphs
Analyze data
e.g., The sample mean
Copyright ©2013 Pearson Education, Inc. publishing as Prentice Hall
Chap 1-27
28.
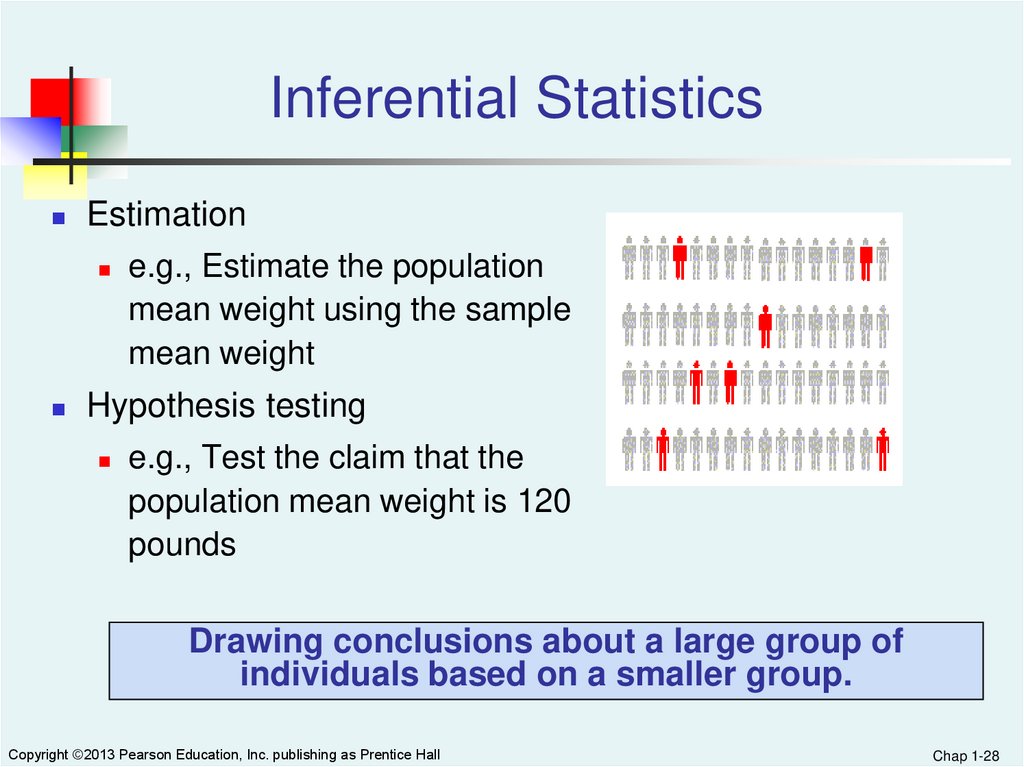
Inferential StatisticsEstimation
e.g., Estimate the population
mean weight using the sample
mean weight
Hypothesis testing
e.g., Test the claim that the
population mean weight is 120
pounds
Drawing conclusions about a large group of
individuals based on a smaller group.
Copyright ©2013 Pearson Education, Inc. publishing as Prentice Hall
Chap 1-28
29.
Understanding Statistics EnhancesA Person’s Numerical Literacy
When do numbers presented represent useful
information?
When are differences in numbers presented
meaningful versus simply due to chance?
When are claims of causality in numbers
presented valid?
When are patterns observed in large amounts
of data meaningful?
Copyright ©2013 Pearson Education, Inc. publishing as Prentice Hall
Chap 1-29
30.
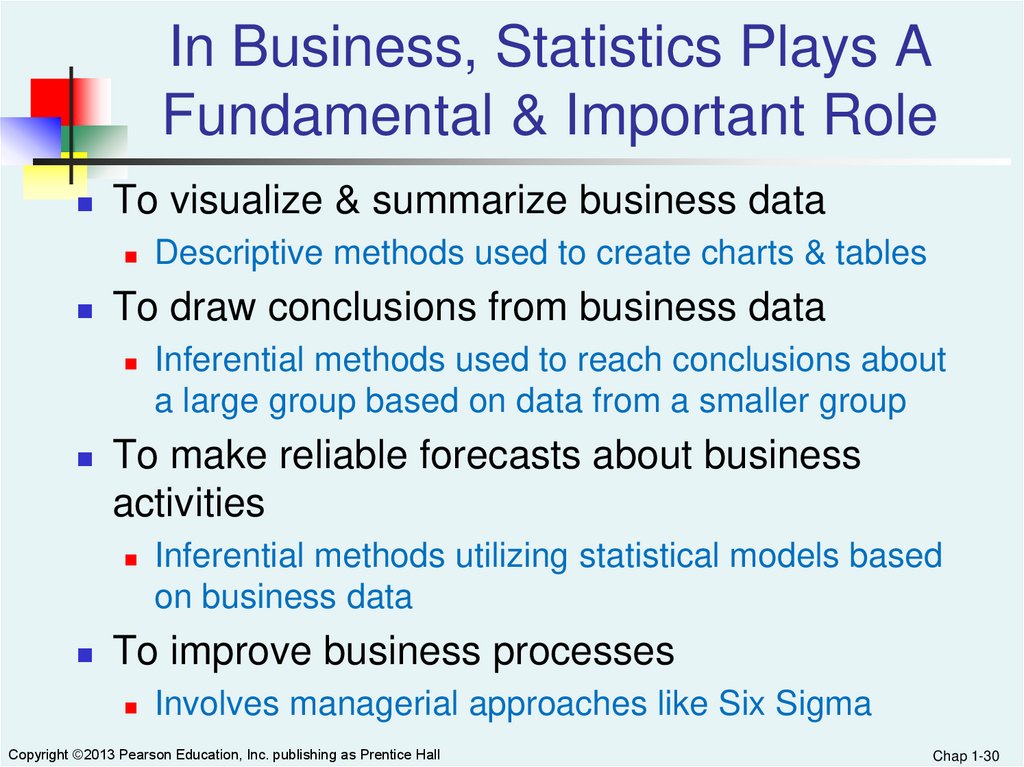
In Business, Statistics Plays AFundamental & Important Role
To visualize & summarize business data
To draw conclusions from business data
Inferential methods used to reach conclusions about
a large group based on data from a smaller group
To make reliable forecasts about business
activities
Descriptive methods used to create charts & tables
Inferential methods utilizing statistical models based
on business data
To improve business processes
Involves managerial approaches like Six Sigma
Copyright ©2013 Pearson Education, Inc. publishing as Prentice Hall
Chap 1-30
31.
Two Trends Are Driving The IncreasingImportance Of Statistics In Business
The increasing amount of data that businesses
can collect, store, & manage
The increasing accessibility of computerized
statistical tools
Copyright ©2013 Pearson Education, Inc. publishing as Prentice Hall
Chap 1-31
32.
Basic Vocabulary Of StatisticsVARIABLE
A characteristic of an item or individual
DATA
The set of individual values associated with a variable
OPERATIONAL DEFINITIONS
Universally accepted meanings that are clear to all
associated with an analysis
Copyright ©2013 Pearson Education, Inc. publishing as Prentice Hall
Chap 1-32
33.
Types of VariablesCategorical (qualitative) variables have values that
can only be placed into categories, such as “yes” and
“no.”
Numerical (quantitative) variables have values that
represent quantities.
Discrete variables arise from a counting process
Continuous variables arise from a measuring process
Copyright ©2013 Pearson Education, Inc. publishing as Prentice Hall
Chap 1-33
34.
Types of VariablesVariables
Categorical
Numerical
Examples:
Marital Status
Political Party
Eye Color
(Defined
categories)
Discrete
Examples:
Number of
Children
Defects per hour
(Counted items)
Continuous
Examples:
Weight
Voltage
(Measured
Chap 1-34
35.
Basic Vocabulary of Statistics (Con’t)POPULATION
All the items or individuals about which you want to draw a
conclusion. The population is the “large group.”
SAMPLE
The portion of a population selected for analysis. The sample is
the “small group.”
PARAMETER
A numerical measure that describes a characteristic of a
population.
STATISTIC
A numerical measure that describes a characteristic of a sample.
Copyright ©2013 Pearson Education, Inc. publishing as Prentice Hall
Chap 1-35
36.
Population vs. SamplePopulation
Measures used to describe the
population are called parameters
Copyright ©2013 Pearson Education, Inc. publishing as Prentice Hall
Sample
Measures used to describe the
sample are called statistics
Chap 1-36
37.
This Book Is Organized To ShowThe Four Uses Of Statistics
To summarize business data (Chapters 2 & 3)
To draw conclusions from business data
(Chapters 4 – 11)
To make reliable forecasts about business
activities (Chapters 12 & 13)
To improve business processes (Chapter 14)
Copyright ©2013 Pearson Education, Inc. publishing as Prentice Hall
Chap 1-37
38.
What are data?A. A bunch of numbers
B. Values along with context
C. Words only
Copyright © 2011 Pearson Education, Inc.
Slide 1- 38
39.
Variables that are numbers are alwaysquantitative.
A. True
B. False
Copyright © 2011 Pearson Education, Inc.
Slide 2- 39
40.
Individuals who answer a survey arecalled:
A. Subjects
B. Participants
C. Respondents
D. Units
Copyright © 2011 Pearson Education, Inc.
Slide 2- 40
41.
The SPCA collects data about the dogsthey house. Which is categorical?
A. Breed
B. Age
C. Weight
D. Veterinary costs
Copyright © 2011 Pearson Education, Inc.
Slide 2- 41
42.
School administrators collect data on thestudents attending the school. Which of
the following is quantitative?
A. Class ( freshman, sophomore, etc.)
B. Grade point average
C. Whether the student is in AP class
D. Whether the student has taken the SAT
Copyright © 2011 Pearson Education, Inc.
Slide 2- 42
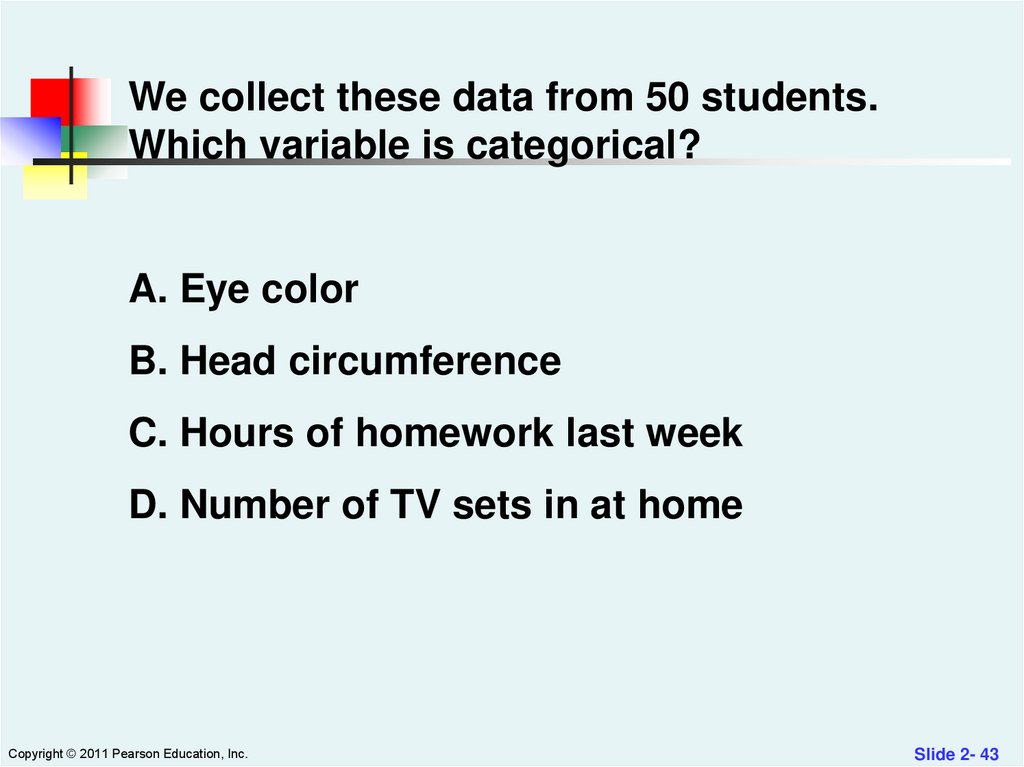
43.
We collect these data from 50 students.Which variable is categorical?
A. Eye color
B. Head circumference
C. Hours of homework last week
D. Number of TV sets in at home
Copyright © 2011 Pearson Education, Inc.
Slide 2- 43
44.
The W’s (Who, What, When, Where,Why) provide ___________ for data
values.
A. Cases
B. Records
C. Context
D. Subjects
Copyright © 2011 Pearson Education, Inc.
Slide 2- 44
45.
Chapter SummaryIn this chapter we have:
Described what statistics is
Discussed why & how statistics is fundamental to
business
Defined the basic concepts and vocabulary of
statistics
Copyright ©2013 Pearson Education, Inc. publishing as Prentice Hall
Chap 1-45
46.
Exercise1. The process of using sample statistics
to draw conclusions about true
population parameters is called
A. statistical inference.
B. the scientific method.
C. sampling.
D. descriptive statistics.
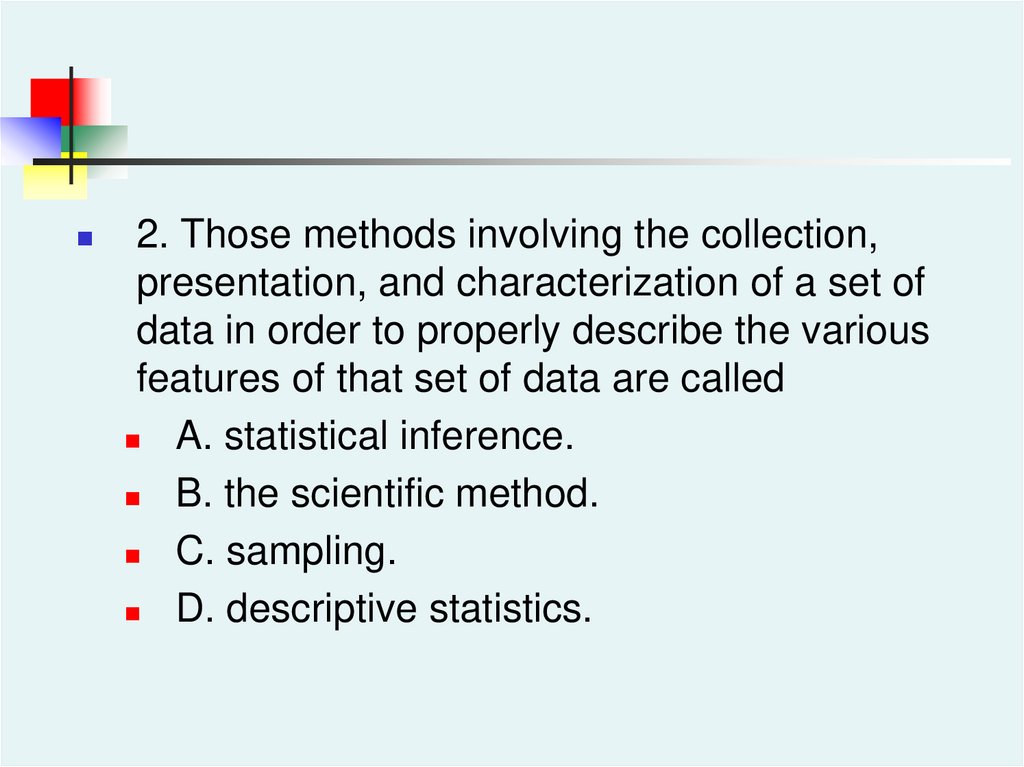
47.
2. Those methods involving the collection,presentation, and characterization of a set of
data in order to properly describe the various
features of that set of data are called
A. statistical inference.
B. the scientific method.
C. sampling.
D. descriptive statistics.
48.
3. The collection and summarization of thesocioeconomic and physical characteristics of
the employees of a particular firm is an
example of
A. inferential statistics.
B. descriptive statistics.
C. a parameter.
D. a statistic.
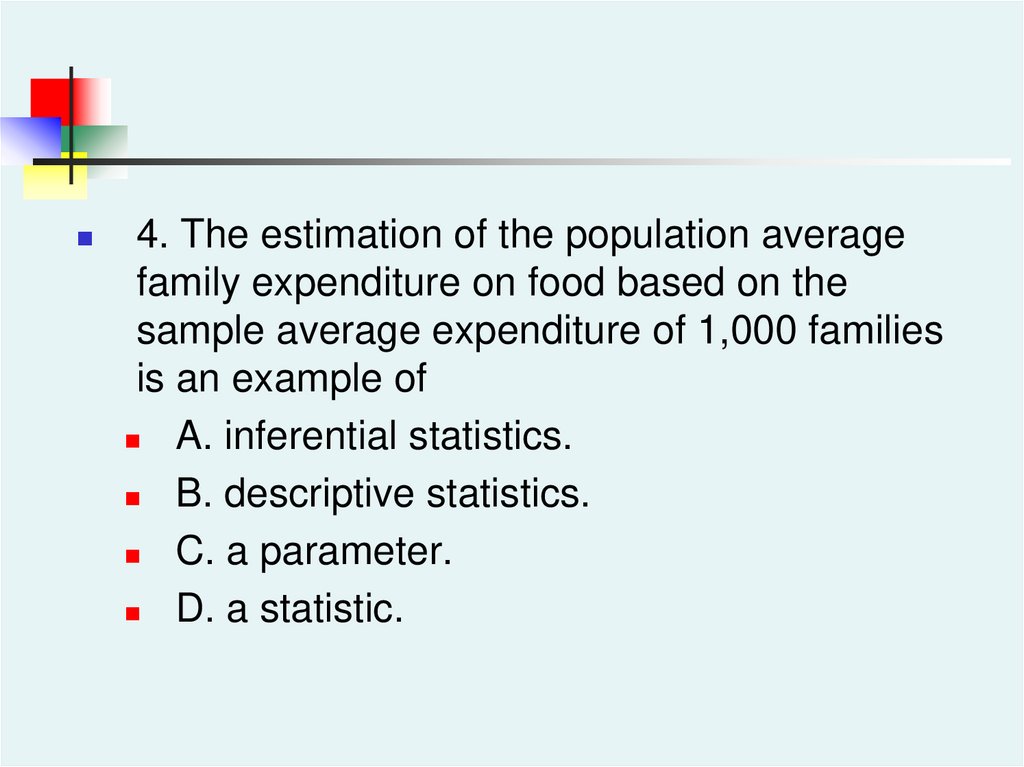
49.
4. The estimation of the population averagefamily expenditure on food based on the
sample average expenditure of 1,000 families
is an example of
A. inferential statistics.
B. descriptive statistics.
C. a parameter.
D. a statistic.
50.
5. The universe or "totality of items or things"under consideration is called
A. a sample.
B. a population.
C. a parameter.
D. a statistic.
51.
6. The portion of the universe that has beenselected for analysis is called
A. a sample.
B. a frame.
C. a parameter.
D. a statistic.
52.
7. A summary measure that is computed todescribe a characteristic from only a sample of
the population is called
a parameter.
a census.
a statistic.
the scientific method.
53.
8. A summary measure that is computed todescribe a characteristic of an entire
population is called
A. a parameter.
B. a census.
C. a statistic.
D. the scientific method.
54.
9. Which of the following is most likely apopulation as opposed to a sample?
A. respondents to a newspaper survey.
B. the first 5 students completing an
assignment.
C. every third person to arrive at the bank.
D. registered voters in a county.
55.
10. Which of the following is most likely aparameter as opposed to a statistic?
A. The average score of the first five students
completing an assignment.
B. The proportion of females registered to vote
in a county.
C. The average height of people randomly
selected from a database.
D. The proportion of trucks stopped yesterday
that were cited for bad brakes.
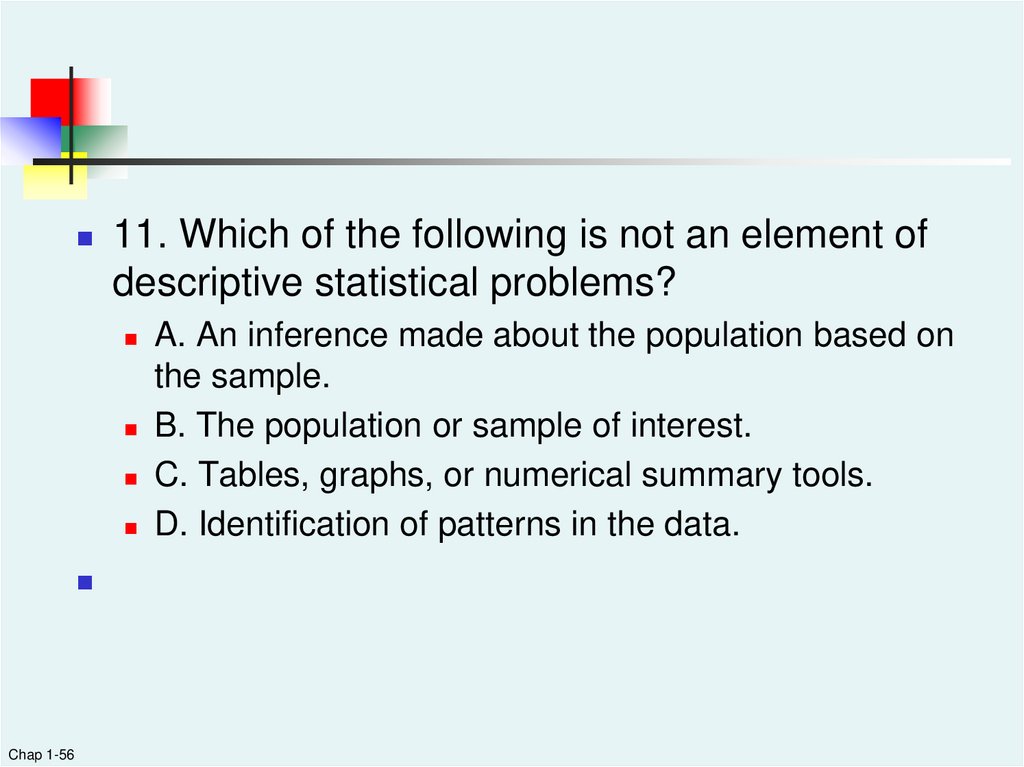
56.
11. Which of the following is not an element ofdescriptive statistical problems?
Chap 1-56
A. An inference made about the population based on
the sample.
B. The population or sample of interest.
C. Tables, graphs, or numerical summary tools.
D. Identification of patterns in the data.
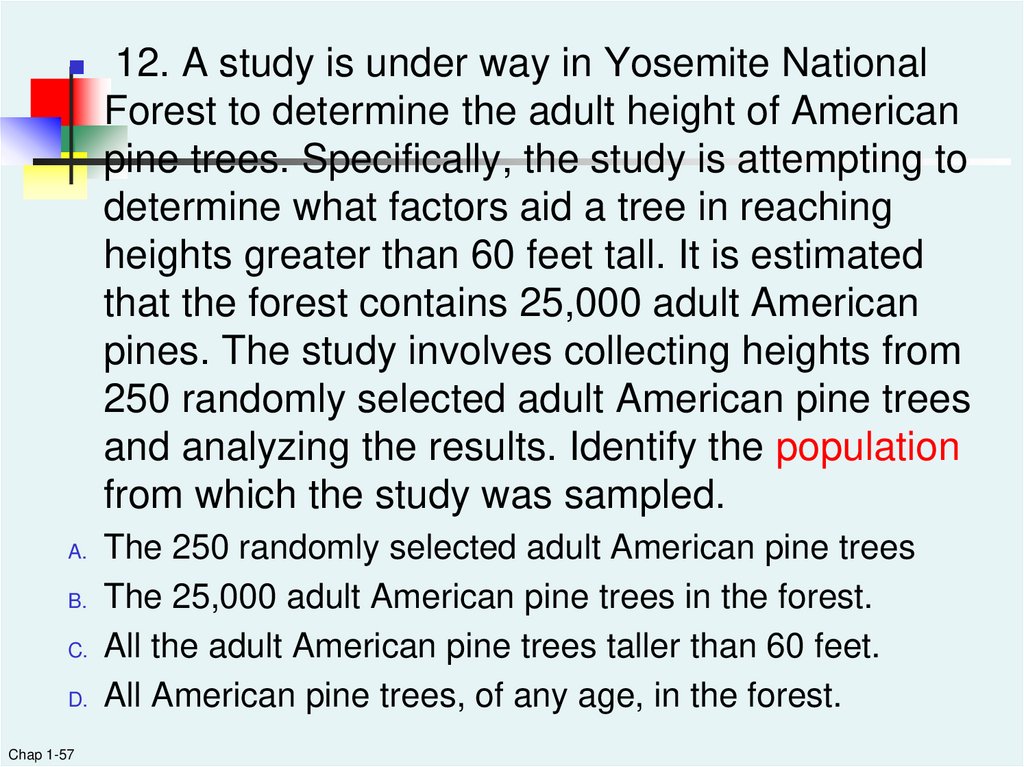
57.
12. A study is under way in Yosemite NationalForest to determine the adult height of American
pine trees. Specifically, the study is attempting to
determine what factors aid a tree in reaching
heights greater than 60 feet tall. It is estimated
that the forest contains 25,000 adult American
pines. The study involves collecting heights from
250 randomly selected adult American pine trees
and analyzing the results. Identify the population
from which the study was sampled.
A.
The 250 randomly selected adult American pine trees
The 25,000 adult American pine trees in the forest.
All the adult American pine trees taller than 60 feet.
All American pine trees, of any age, in the forest.
B.
C.
D.
Chap 1-57
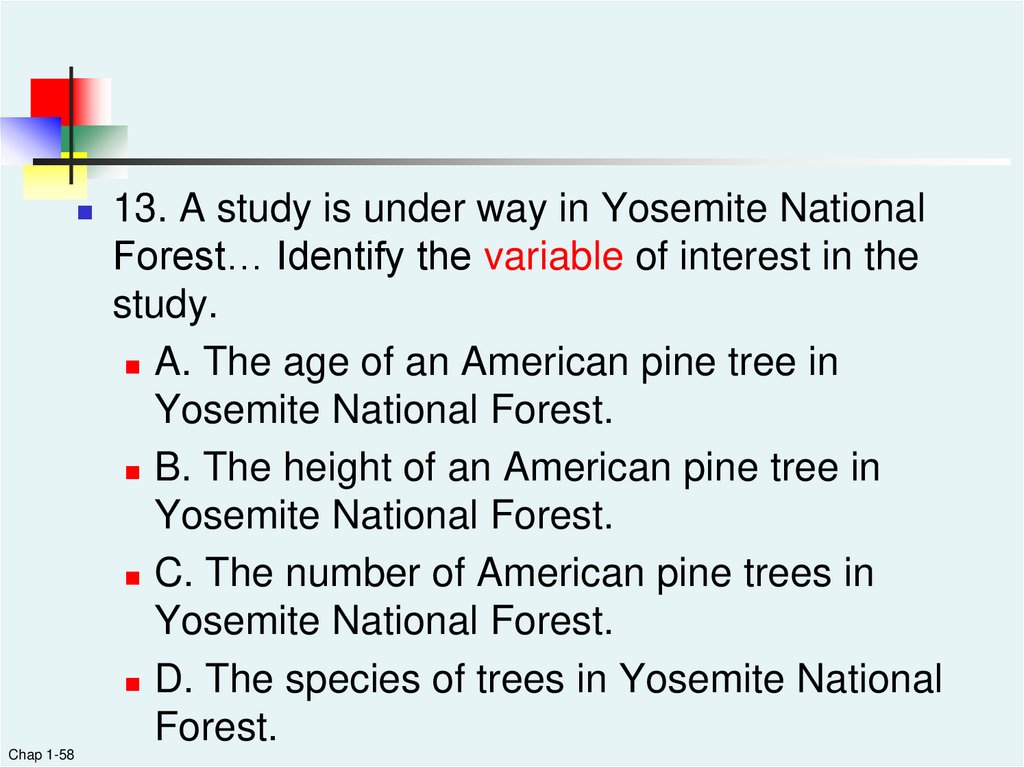
58.
Chap 1-5813. A study is under way in Yosemite National
Forest… Identify the variable of interest in the
study.
A. The age of an American pine tree in
Yosemite National Forest.
B. The height of an American pine tree in
Yosemite National Forest.
C. The number of American pine trees in
Yosemite National Forest.
D. The species of trees in Yosemite National
Forest.
59.
Chap 1-5914. Identify the sample in the study.
A. The 250 randomly selected adult American
pine trees.
B. The 25,000 adult American pine trees in
the forest.
C. All the adult American pine trees taller
than 60 feet.
D. All American pine trees, of any age, in the
forest.