 Образование
Похожие презентации:


")
Linear and real-life graph. Chartwell international school
1.
Linear and real-life graphChartwell International School
2.
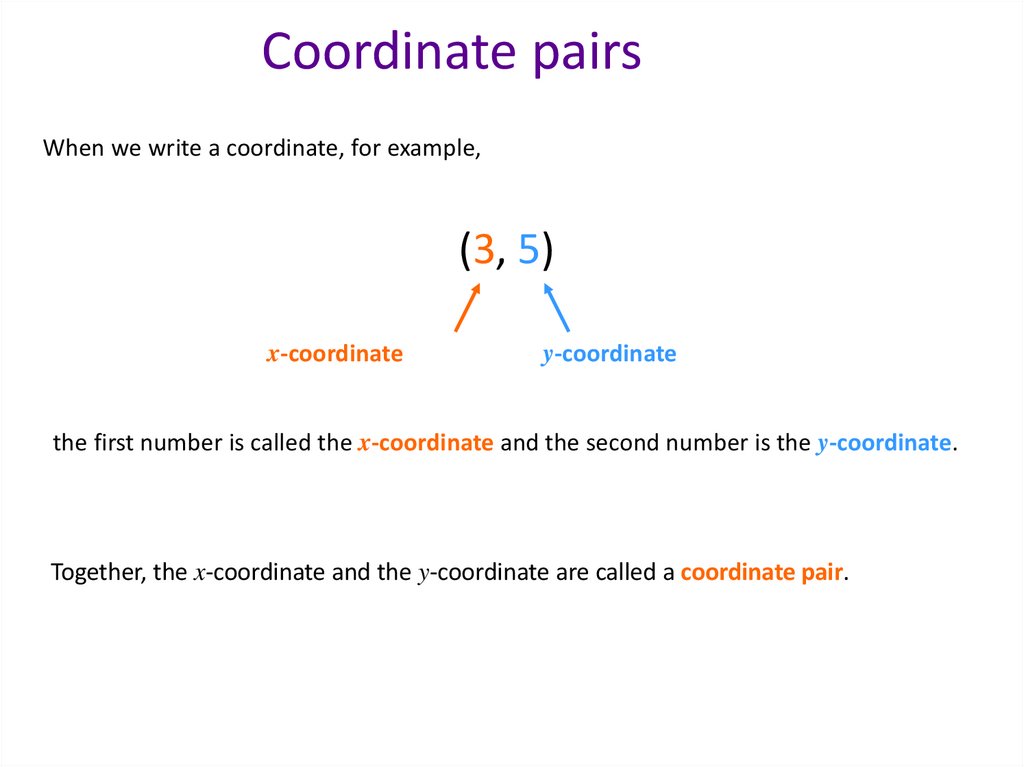
Coordinate pairsWhen we write a coordinate, for example,
(3, 5)
x-coordinate
y-coordinate
the first number is called the x-coordinate and the second number is the
called
y-coordinate.
the ycoordinate.
Together, the x-coordinate and the y-coordinate are called a coordinate pair.
3.
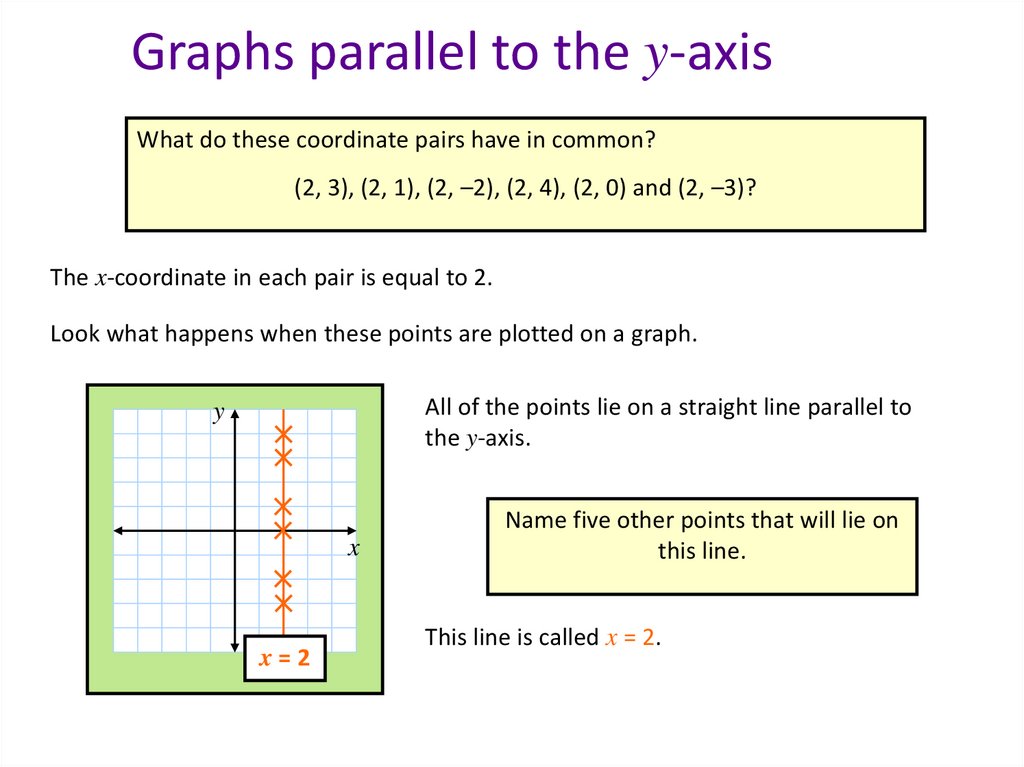
Graphs parallel to the y-axisWhat do these coordinate pairs have in common?
(2, 3), (2, 1), (2, –2), (2, 4), (2, 0) and (2, –3)?
The x-coordinate in each pair is equal to 2.
Look what happens when these points are plotted on a graph.
All of the points lie on a straight line parallel to
the y-axis.
y
x
x=2
Name five other points that will lie on
this line.
This line is called x = 2.
4.
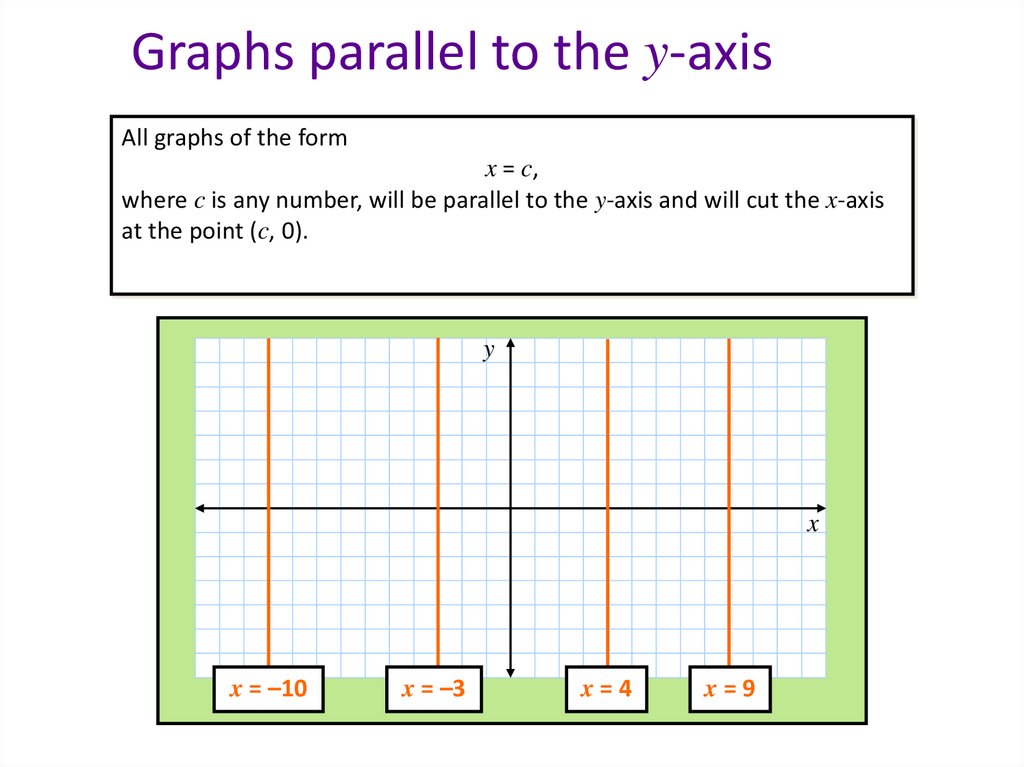
Graphs parallel to the y-axisAll graphs of the form
x = c,
where c is any number, will be parallel to the y-axis and will cut the x-axis
at the point (c, 0).
y
x
x = –10
x = –3
x=4
x=9
5.
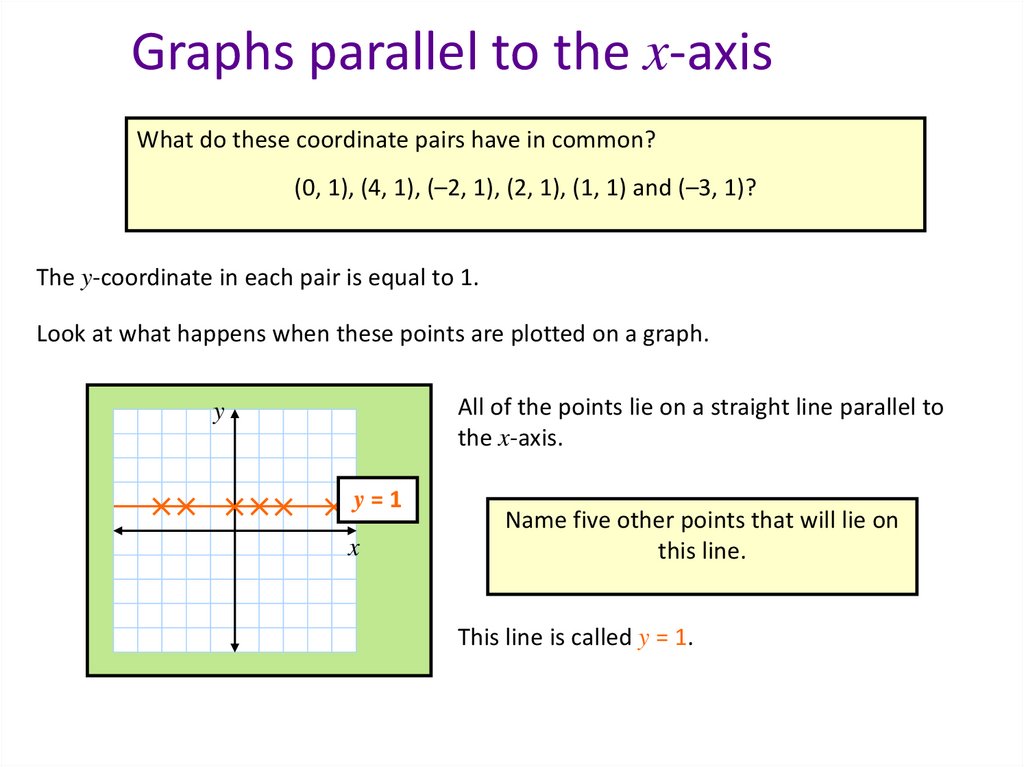
Graphs parallel to the x-axisWhat do these coordinate pairs have in common?
(0, 1), (4, 1), (–2, 1), (2, 1), (1, 1) and (–3, 1)?
The y-coordinate in each pair is equal to 1.
Look at what happens when these points are plotted on a graph.
All of the points lie on a straight line parallel to
the x-axis.
y
y=1
x
Name five other points that will lie on
this line.
This line is called y = 1.
6.
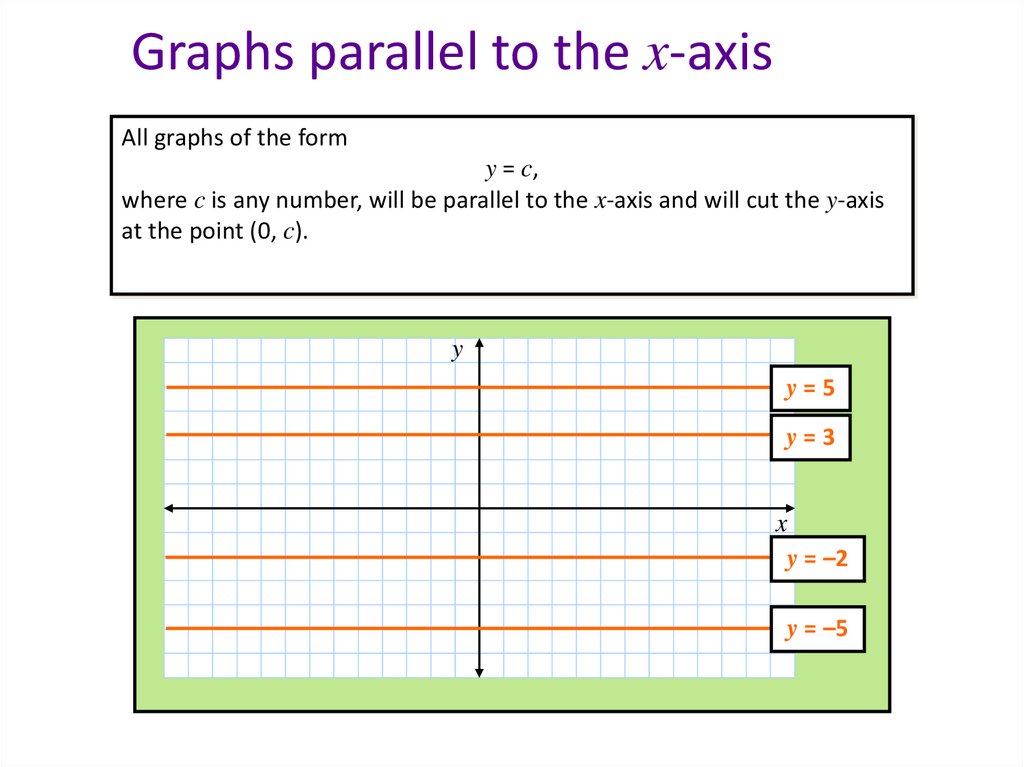
Graphs parallel to the x-axisAll graphs of the form
y = c,
where c is any number, will be parallel to the x-axis and will cut the y-axis
at the point (0, c).
y
y=5
y=3
x
y = –2
y = –5
7.
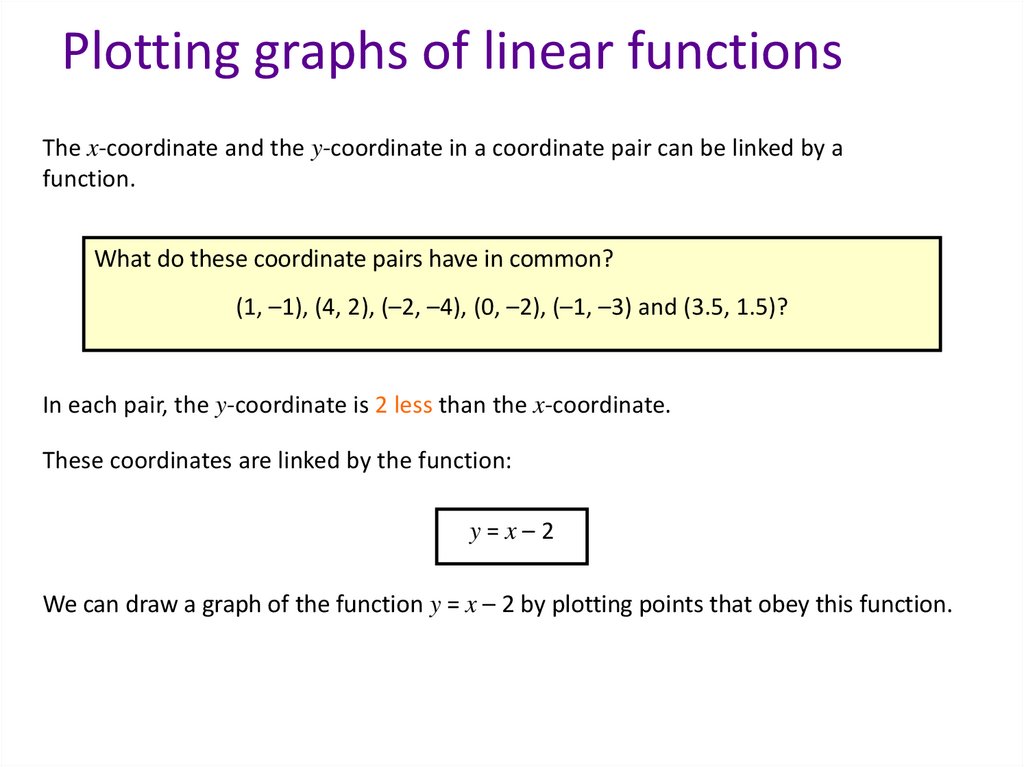
Plotting graphs of linear functionsThe x-coordinate and the y-coordinate in a coordinate pair can be linked by a
function.
What do these coordinate pairs have in common?
(1, –1), (4, 2), (–2, –4), (0, –2), (–1, –3) and (3.5, 1.5)?
In each pair, the y-coordinate is 2 less than the x-coordinate.
These coordinates are linked by the function:
y=x–2
We can draw a graph of the function y = x – 2 by plotting points that obey this function.
8.
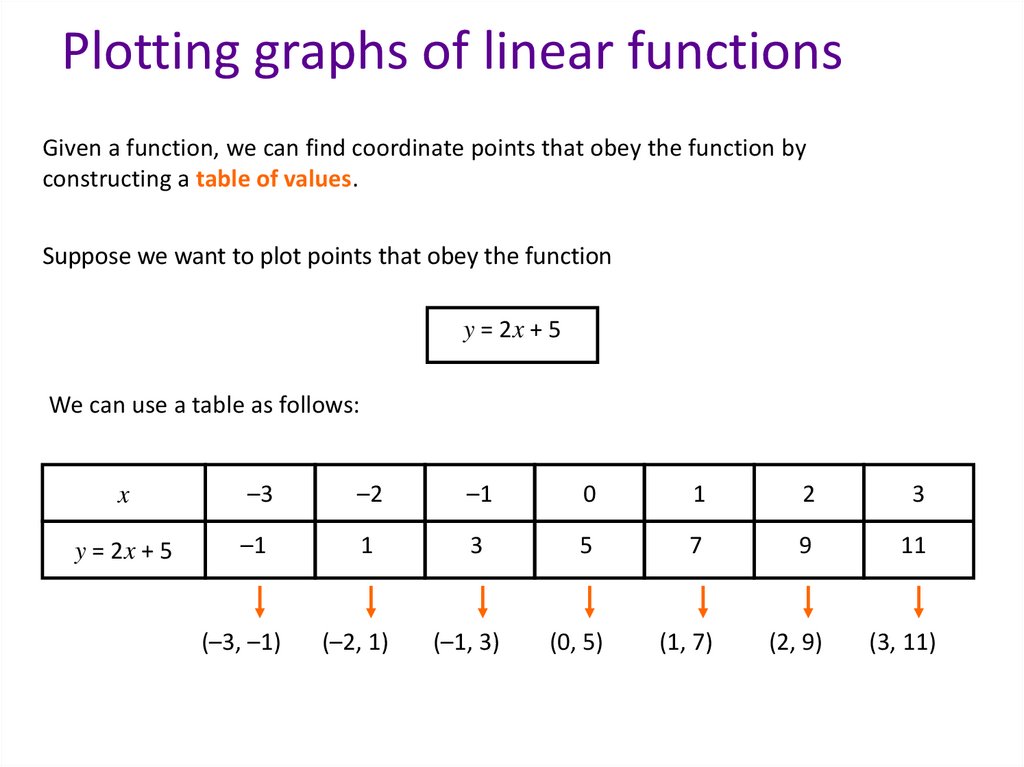
Plotting graphs of linear functionsGiven a function, we can find coordinate points that obey the function by
constructing a table of values.
Suppose we want to plot points that obey the function
y = 2x + 5
We can use a table as follows:
x
–3
–2
–1
0
1
2
3
y = 2x + 5
–1
1
3
5
7
9
11
(–3, –1)
(–2, 1)
(–1, 3)
(0, 5)
(1, 7)
(2, 9)
(3, 11)
9.
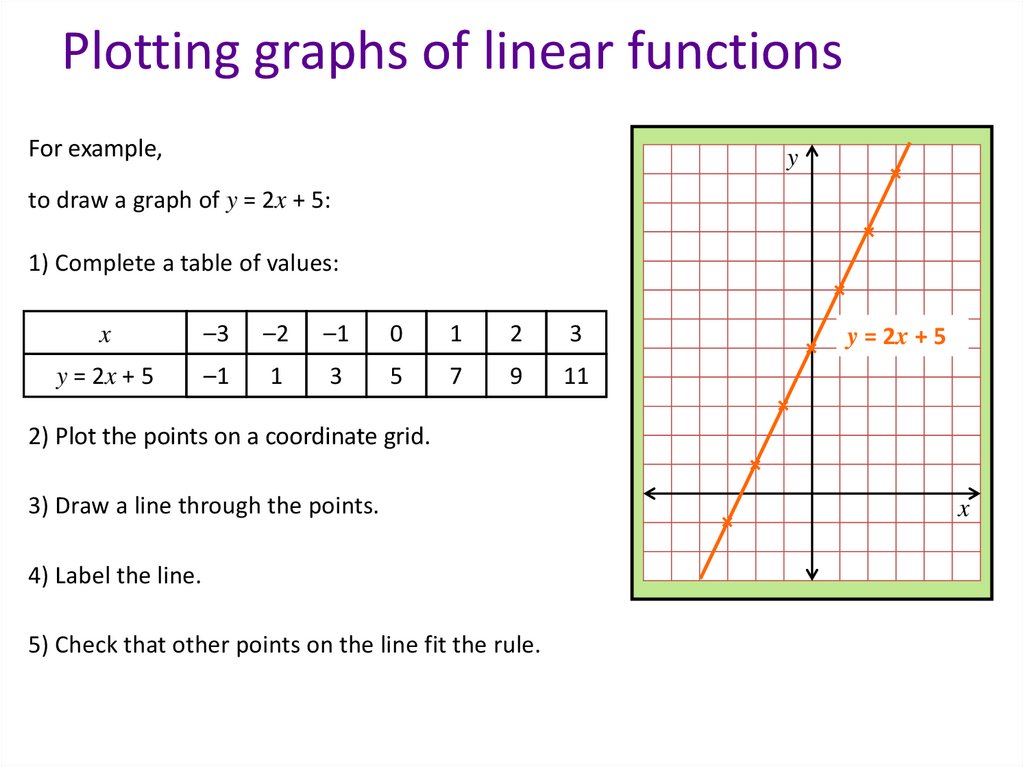
Plotting graphs of linear functionsFor example,
y
to draw a graph of y = 2x + 5:
1) Complete a table of values:
x
–3
–2
–1
0
1
2
3
y = 2x + 5
–1
1
3
5
7
9
11
y = 2x + 5
2) Plot the points on a coordinate grid.
3) Draw a line through the points.
4) Label the line.
5) Check that other points on the line fit the rule.
x
10.
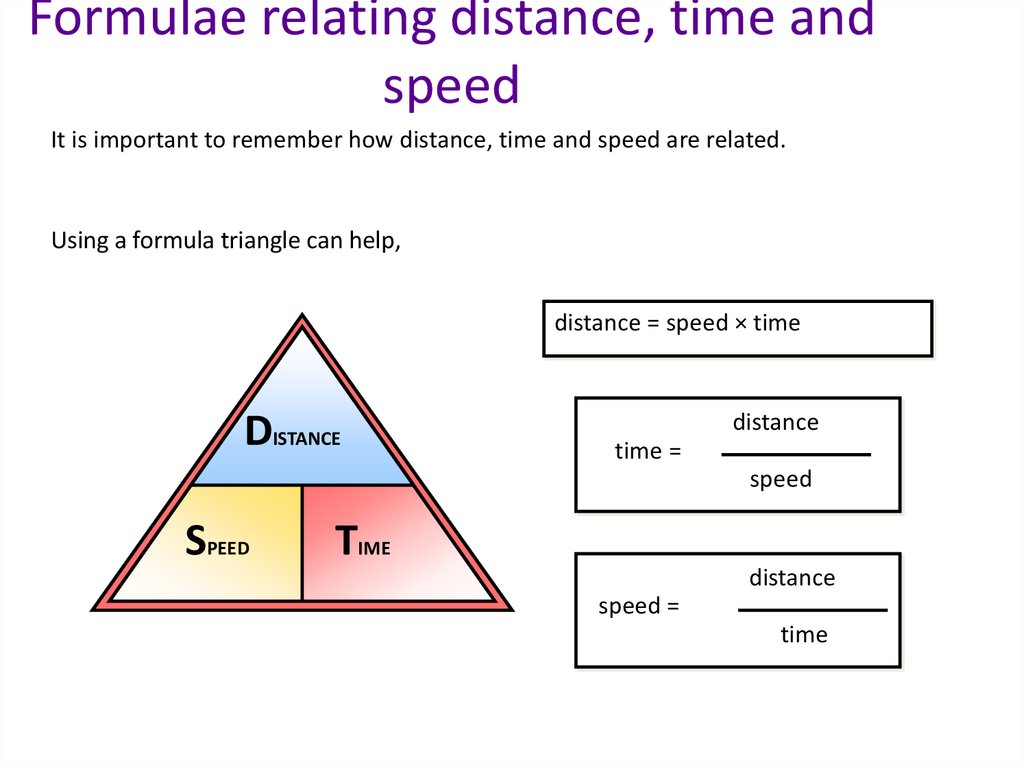
Formulae relating distance, time andspeed
It is important to remember how distance, time and speed are related.
Using a formula triangle can help,
distance = speed × time
DISTANCE
distance
time =
speed
SPEED
TIME
distance
speed =
time
11.
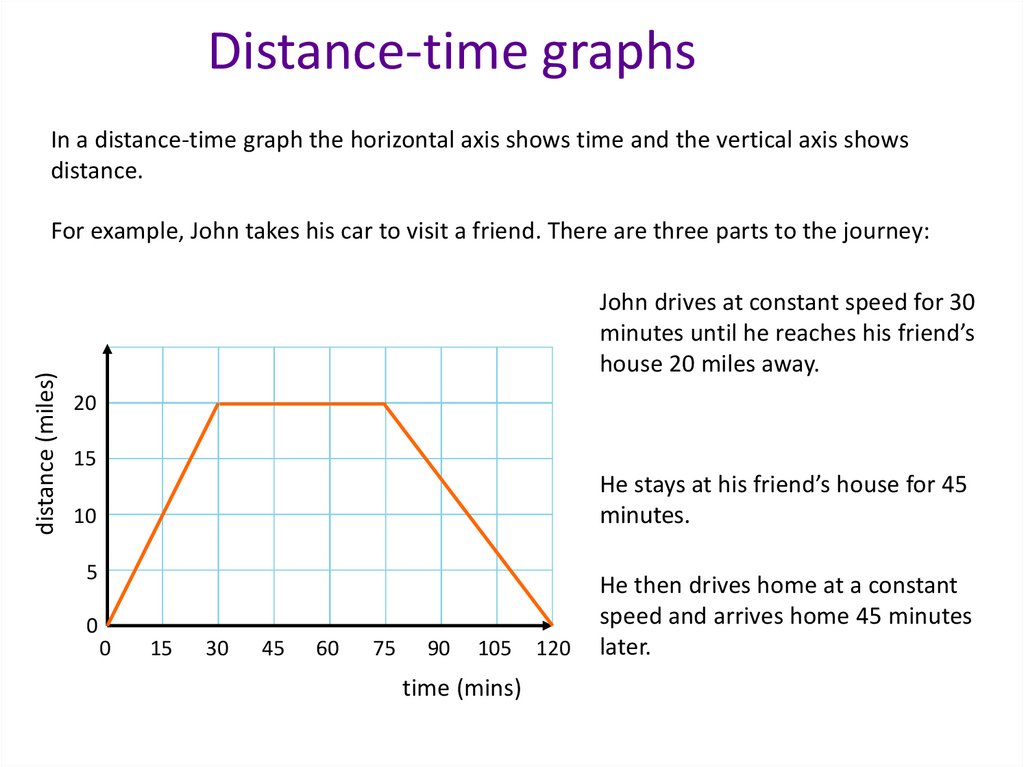
Distance-time graphsIn a distance-time graph the horizontal axis shows time and the vertical axis shows
distance.
distance (miles)
For example, John takes his car to visit a friend. There are three parts to the journey:
John drives at constant speed for 30
minutes until he reaches his friend’s
house 20 miles away.
20
15
He stays at his friend’s house for 45
minutes.
10
5
0
0
15
30
45
60
75
90
105
time (mins)
120
He then drives home at a constant
speed and arrives home 45 minutes
later.