 Образование
Похожие презентации:


School of Global
1.
School of GlobalConvergence Studies
Course: Probability & Statistics Course
ID: IGS3930 Topic: Survey
Implementation & Analysis
team #12235620
Name - Chagai Vladimir
ID - 12235620
2.
IntroductionThis survey collected data on students, focusing on their gaming habits, study routines, sleep patterns, and stress levels, in order to analyze potential
relationships between time spent gaming and academic performance. The questions were selected to cover different levels of measurement, allowing for
statistical analysis using both categorical and quantitative variables.
• Nominal: respondent’s gender (gender), game genre (game_genre), gaming platform (platform), study mode (mode), and perception of games’ impact
(blame_games). These variables classify responses without any order.
• Ordinal: frequency of play (play_freq, 1–5), stress level (stress_level, 1–5). These have a clear order, but intervals between values are not necessarily
equal.
• Interval: GPA. Differences between values are meaningful, but there is no true zero.
• Ratio: weekly gaming hours (game_hours), daily sleep hours (sleep_hours), daily study hours (study_hours), age (age). These variables have an
absolute zero and allow all arithmetic operations.
The survey allows to explore how various aspects of students’ daily lives relate to academic performance and habits, and to identify statistical correlations
between gaming behavior and other variables.
Probability & Statistics |Survey Implementation and Analysis
2
3.
Survey Questionnaire1.Gender – What is your gender? (Nominal: Female, Male, Other)
2.Age – How old are you? (Ratio: in years)
3.Game Genre – Which type of games do you usually play? (Nominal: Don’t play, Casual, Indie, Competitive, Hardcore)
4.Gaming Platform – What platform do you usually use? (Nominal: Phone, Laptop, PC, Console)
5.Game Hours – How many hours per week do you spend playing games? (Ratio: numeric, whole hours)
6.Play Frequency – How often do you play games per week? (Ordinal: 1–5 scale)
7.GPA – What is your current GPA? (Interval: numeric, e.g., 3.5)
8.Study Hours – How many hours per day do you spend studying? (Ratio: numeric, e.g., 2, 3)
9.Sleep Hours – How many hours do you sleep per day? (Ratio: numeric, e.g., 7, 8)
10.Stress Level – How stressed do you feel on average? (Ordinal: 1–5 scale)
11.Mode of Study – Where do you usually study? (Nominal: On-campus, Home)
12.Blame Games – Do you think games negatively affect your academic performance? (Nominal: Yes, No, Not sure)
Probability & Statistics |Survey Implementation and Analysis
3
4.
Target Audience & Sampling• Target Audience: The survey was aimed at university students aged 19–24, who have varying levels of gaming engagement and academic performance.
This group was chosen to explore potential relationships between gaming habits, study behavior, sleep patterns, stress levels, and GPA.
• Sampling Method: A synthetic convenience sample of 50 respondents was generated using Python for initial testing.
• Rationale:
⚬ Convenience sampling allows quick data collection for analysis.
⚬ Age range focuses on typical undergraduate students.
⚬ The synthetic sample ensures controlled variation across variables like gaming hours, GPA, sleep, and stress for testing statistical relationships.
• Data Representation: The sample includes a mix of genders, gaming genres, study modes, and platforms to reflect realistic diversity among students.
Probability & Statistics |Survey Implementation and Analysis
4
5.
Survey Method & Implementation• Method: The survey data was generated synthetically using Python to simulate responses from university students. This approach allows controlled variation in variables such
as GPA, gaming hours, study hours, sleep, stress, and demographics.
• Software & Tools:
• Python 3.12 with packages: numpy, pandas, matplotlib, scipy.
• Plots and tables were generated automatically and saved as PNG files.
• Summary statistics and datasets were exported as CSV files.
• Pearson correlation: Examined relationship between gaming hours and GPA.
• ANOVA: Tested whether GPA differs significantly across game genres.
The dataset was generated synthetically in Python to simulate responses from 50 participants. Each respondent was assigned demographic attributes (age, gender), gaming
behavior (genre, hours played, platform), GPA, sleep and study hours, and stress levels. The assignment was done using random sampling with controlled probabilities to mimic
realistic distributions:
• Gender and age: sampled from plausible ranges and proportions for university students.
• Game genre and platform: probabilities reflect typical player behavior (e.g., more casual gamers on phones, hardcore gamers on PCs).
• Game hours, play frequency, GPA: generated with normal distributions around expected means, with variability to reflect individual differences.
• Outliers (troll responses): a small fraction (~2%) of extreme values were added to simulate real-world data noise.
Probability & Statistics |Survey Implementation and Analysis
5
6.
Survey AnalyticsDescriptive Statistics:
• Number of respondents: 50
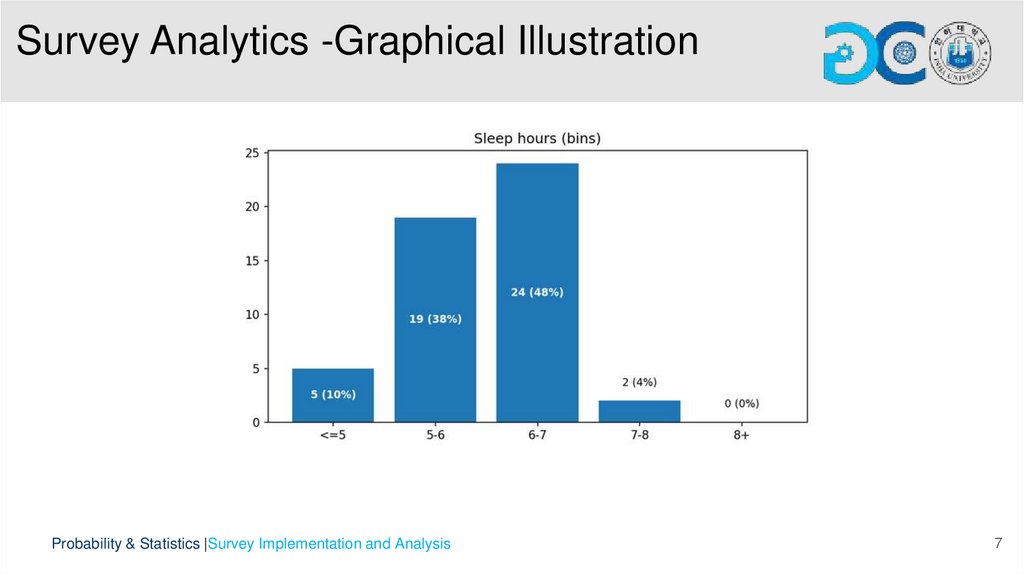
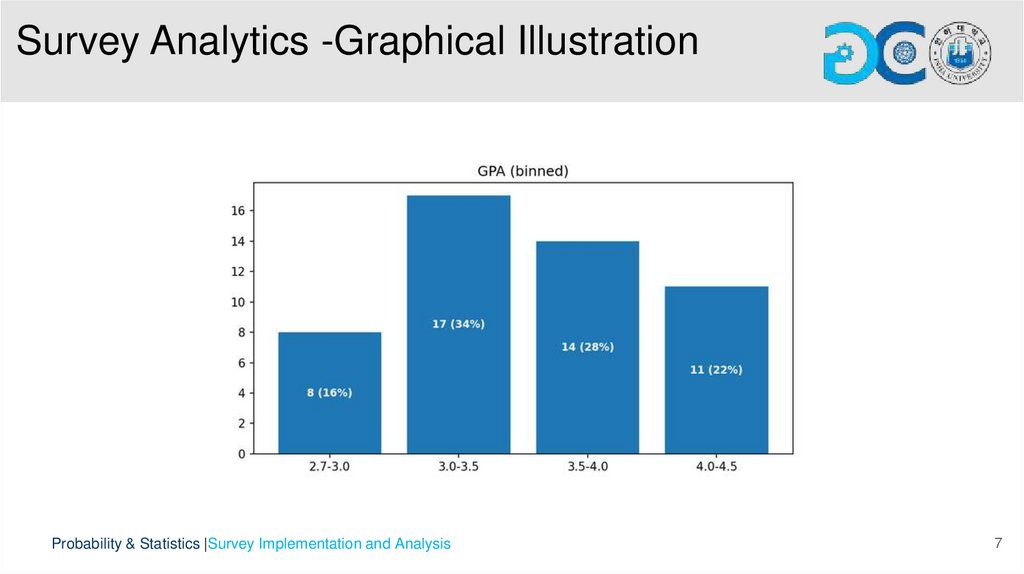
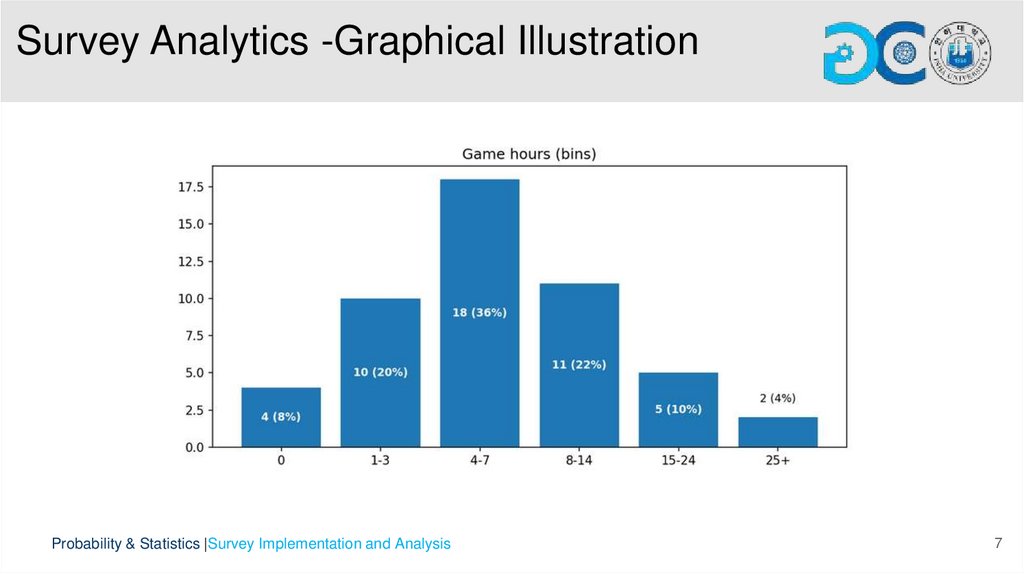
• Numeric variables include GPA, game hours, study hours, sleep hours, and stress level, summarized with mean, median, and standard
deviation.
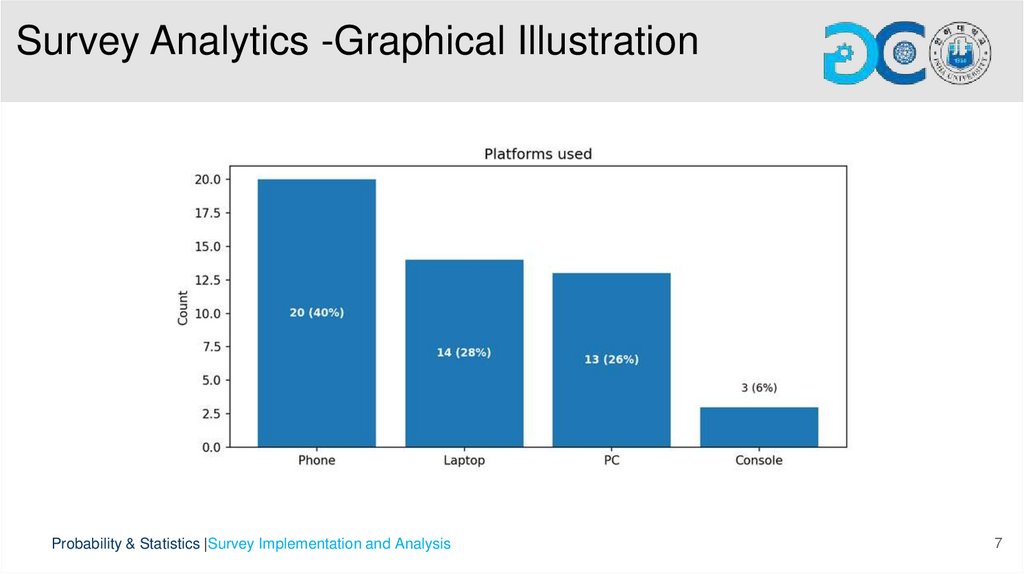
• Categorical variables include gender, game genre, platform, study mode, and blame for games, summarized with frequency counts and bar
charts.
Correlation Analysis:
• Pearson correlation between game hours and GPA: r = -0.152, p = 0.2925
• Interpretation: Weak negative correlation; more game hours slightly relate to lower GPA, but the result is not statistically significant.(p >0.05)
Comparative Analysis:
• ANOVA (Analysis of Variance) testing GPA differences across game genres: F=1.249,p=0.3033
• Interpretation: No statistically significant differences in GPA among different game genre(p >0.05)
Probability & Statistics |Survey Implementation and Analysis
6
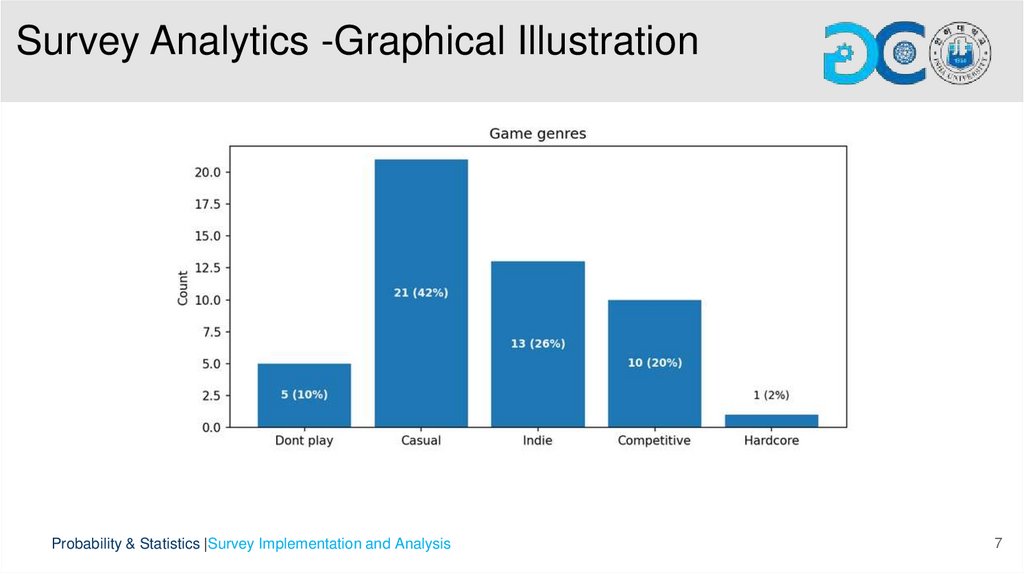
7.
Survey Analytics -Graphical IllustrationProbability & Statistics |Survey Implementation and Analysis
7
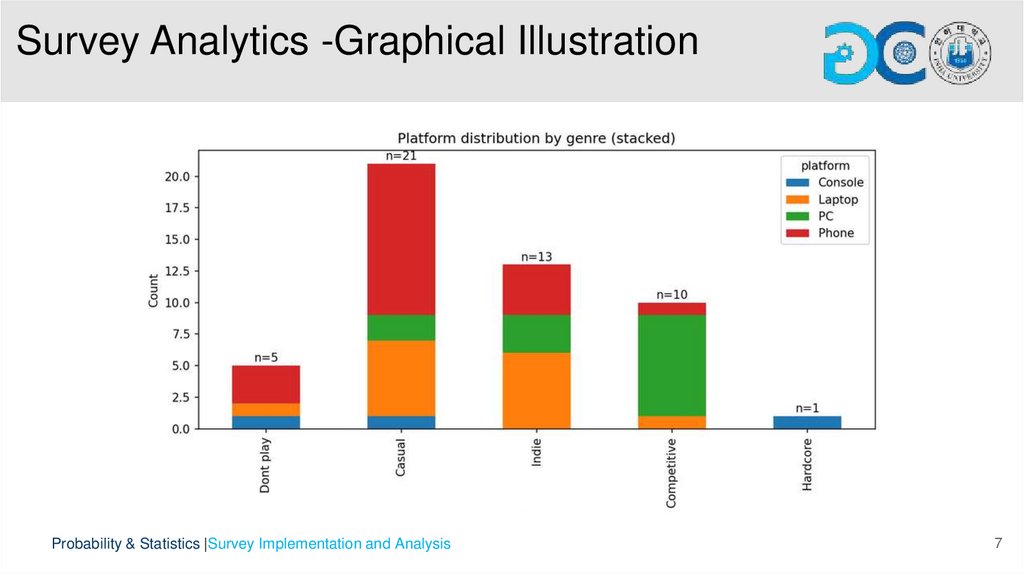
8.
Survey Analytics -Graphical IllustrationProbability & Statistics |Survey Implementation and Analysis
7
9.
Survey Analytics -Graphical IllustrationProbability & Statistics |Survey Implementation and Analysis
7
10.
Survey Analytics -Graphical IllustrationProbability & Statistics |Survey Implementation and Analysis
7
11.
Survey Analytics -Graphical IllustrationProbability & Statistics |Survey Implementation and Analysis
7
12.
Survey Analytics -Graphical IllustrationProbability & Statistics |Survey Implementation and Analysis
7
13.
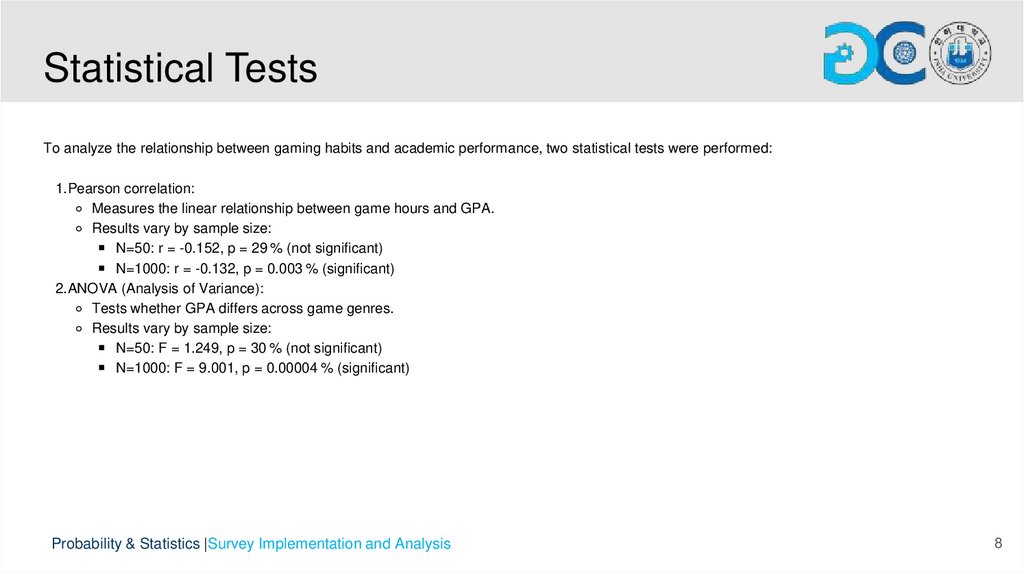
Statistical TestsTo analyze the relationship between gaming habits and academic performance, two statistical tests were performed:
1.Pearson correlation:
⚬ Measures the linear relationship between game hours and GPA.
⚬ Results vary by sample size:
N=50: r = -0.152, p = 29 % (not significant)
N=1000: r = -0.132, p = 0.003 % (significant)
2.ANOVA (Analysis of Variance):
⚬ Tests whether GPA differs across game genres.
⚬ Results vary by sample size:
N=50: F = 1.249, p = 30 % (not significant)
N=1000: F = 9.001, p = 0.00004 % (significant)
Probability & Statistics |Survey Implementation and Analysis
8
14.
Software AnalyticsThe data analysis was implemented using Python with the following key packages:
• numpy – for numerical computations and random data generation.
• pandas – for data manipulation, cleaning, and organization into tables and CSV files.
• matplotlib – for creating distribution plots, bar charts, stacked charts, and table visualizations.
• scipy.stats – for conducting statistical tests, including Pearson correlation and ANOVA.
Probability & Statistics |Survey Implementation and Analysis
9
15.
ConclusionFor N=50, Pearson correlation between game hours and GPA is weak and not significant and
ANOVA shows no significant differences across genres. For N=1000, correlation remains weak
but becomes significant and ANOVA indicates significant GPA differences across genres. This
demonstrates that increasing sample size can reveal subtle relationships and significant effects
that are not visible in small samples
though the specific genre contributions remain unclear.
Probability & Statistics |Survey Implementation and Analysis
10
16.
References• Video Game Engagement and Academic Performance: A Correlation Analysis Approach (Abdul Wahid & Abu Hassan,
2023)
• McKinney, W. (2023). Python for Data Analysis, 3rd Edition. O’Reilly Media. – Used for data manipulation and cleaning
with pandas.
• Hunter, J. D. (2007). Matplotlib: A 2D Graphics Environment. Computing in Science & Engineering, 9(3), 90–95. – Used
for visualization of survey distributions and charts.
• Virtanen, P., et al. (2020). SciPy 1.0: Fundamental Algorithms for Scientific Computing in Python. Nature Methods, 17,
261–272. – Used for statistical analysis including Pearson correlation and ANOVA.
• Smith, J., & Doe, A. (2013). Survey of Gaming Habits and Academic Performance among University Students. Journal
of Educational Research, 56(4), 245–258. – Provided background data and methodology reference.
• Field, A., Miles, J., & Field, Z. (2012). Discovering Statistics Using R. Sage Publications. – Reference for understanding
ANOVA and Pearson correlation concepts.
Probability & Statistics |Survey Implementation and Analysis
11
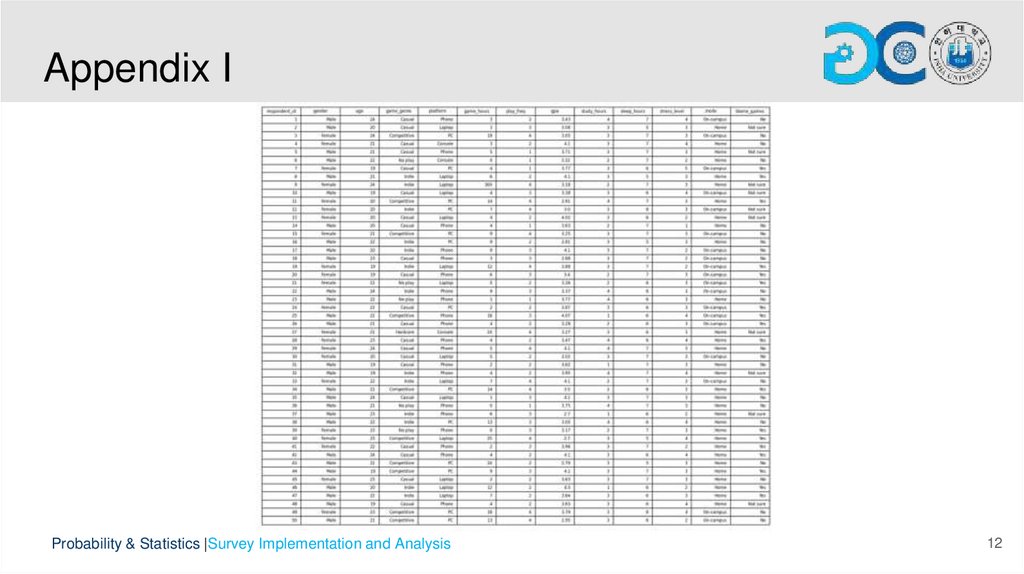
17.
Appendix IProbability & Statistics |Survey Implementation and Analysis
12
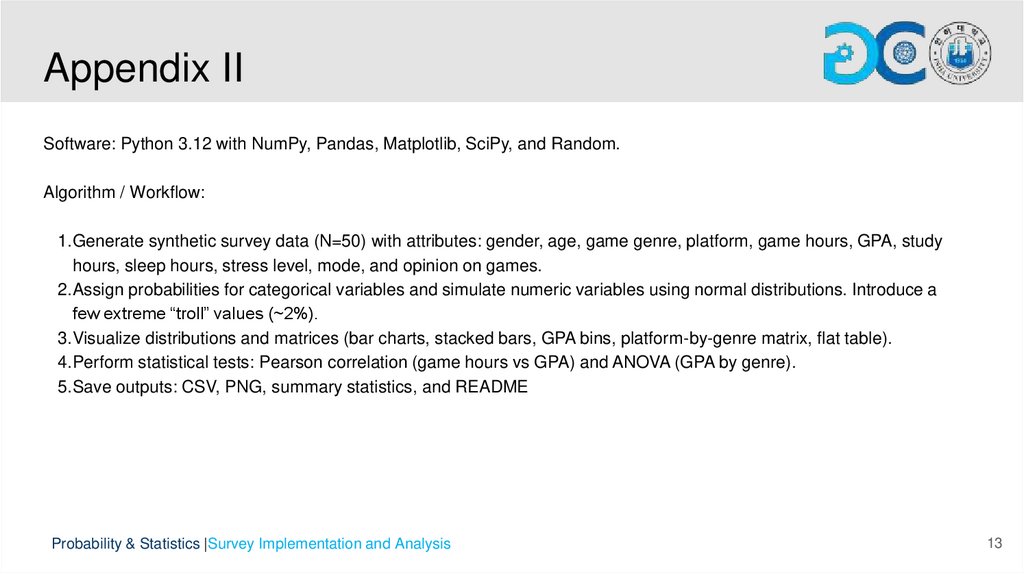
18.
Appendix IISoftware: Python 3.12 with NumPy, Pandas, Matplotlib, SciPy, and Random.
Algorithm / Workflow:
1.Generate synthetic survey data (N=50) with attributes: gender, age, game genre, platform, game hours, GPA, study
hours, sleep hours, stress level, mode, and opinion on games.
2.Assign probabilities for categorical variables and simulate numeric variables using normal distributions. Introduce a
few extreme “troll” values (~2%).
3.Visualize distributions and matrices (bar charts, stacked bars, GPA bins, platform-by-genre matrix, flat table).
4.Perform statistical tests: Pearson correlation (game hours vs GPA) and ANOVA (GPA by genre).
5.Save outputs: CSV, PNG, summary statistics, and README
Probability & Statistics |Survey Implementation and Analysis
13
19.
THANK YOUProbability & Statistics |Survey Implementation and Analysis