


 Математика
Похожие презентации:


")

")

")


Probability distributions (chapter 6)
1.
PROBABILITYDISTRIBUTION
STATISTICS FOR BUSINESS AND ECONOMICS 13e Anderson, David R 2017
Chapter 6
2.
Probability DistributionsUNIFORM
PROBABILITY
DISTRIBUTION
NORMAL
PROBABILITY
DISTRIBUTION
SAMPLE
DISTRIBUTION
SAMPLING
DISTRIBUTION WHEN
SIGMA IS KNOWN
SAMPLING
DISTRIBUTION WHEN
SIGMA IS UNKNOWN
3.
1. Uniform Probability Distribution■ Consider the random variable x representing the flight time of an
airplane traveling from Chicago to New York.
■ Suppose the flight time can be any value in the interval from 120
minutes to 140 minutes.
■ Because the random variable x can assume any value in that interval, x
is a continuous rather than a discrete random variable
4.
1. Uniform Probability Distribution■ Let us assume that sufficient actual flight data are available to
conclude that the probability of a flight time within any 1minute
interval is the same as the probability of a flight time within any other
1minute interval contained in the larger interval from 120 to 140
minutes.
■ With every 1minute interval being equally likely, the random variable
x is said to have a uniform probability distribution.
5.
1. Uniform Probability Distribution■ The probability density function, which defines the uniform distribution for the
flight time random variable, is
■ General formula:
■ For the flight time random variable a=120 and b=140
6.
1. Uniform Probability Distribution■ Graphically:
7.
1. Uniform Probability Distribution■ Consider the area under the graph of f (x) in the interval from 120 to
130. The area is rectangular, and the area of a rectangle is simply the
width multiplied by the height.
■ With the width of the interval equal to 130 − 120 = 10 and the height
equal to the value of the probability density function f (x) = 1/20,
■ we have area = width × height = 10(1/20) = 10/20 = .50.
8.
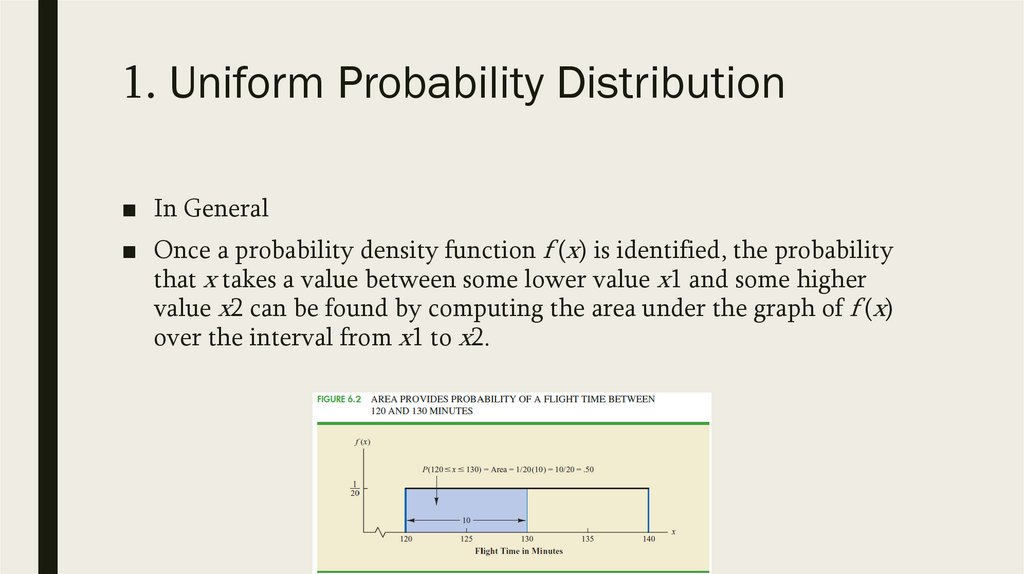
1. Uniform Probability Distribution■ In General
■ Once a probability density function f (x) is identified, the probability
that x takes a value between some lower value x1 and some higher
value x2 can be found by computing the area under the graph of f (x)
over the interval from x1 to x2.
9.
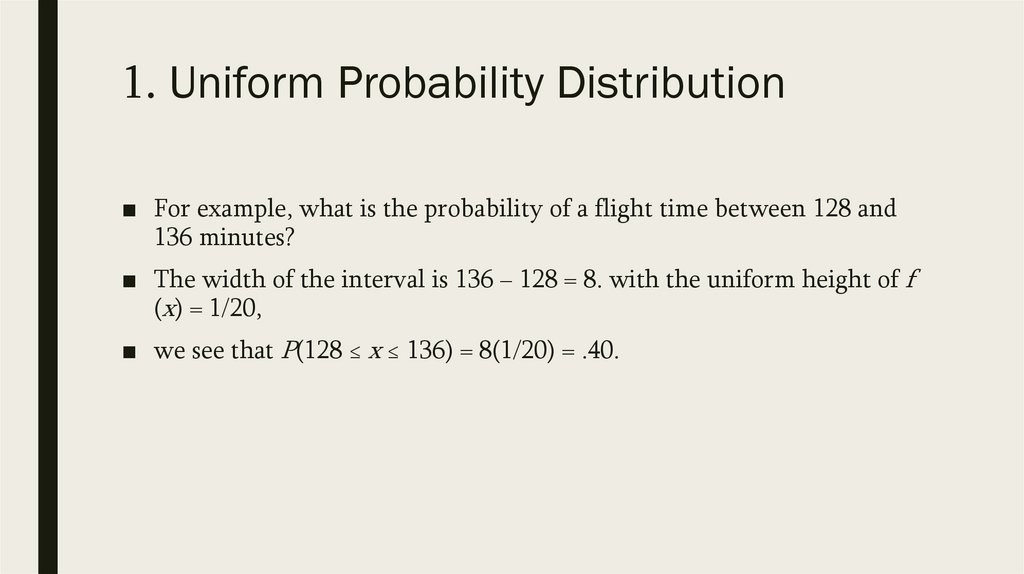
1. Uniform Probability Distribution■ For example, what is the probability of a flight time between 128 and
136 minutes?
■ The width of the interval is 136 − 128 = 8. with the uniform height of f
(x) = 1/20,
■ we see that P(128 ≤ x ≤ 136) = 8(1/20) = .40.
10.
1. Uniform Probability Distribution■ Two major differences stand out between the treatment of continuous
random variables and the treatment of their discrete counterparts.
■ 1. we no longer talk about the probability of the random variable
assuming a particular value. Instead, we talk about the probability of
the random variable assuming a value within some given interval.
11.
1. Uniform Probability Distribution■ Two major differences stand out between the treatment of continuous
random variables and the treatment of their discrete counterparts.
■ 2. The probability of a continuous random variable assuming a value
within some given interval from x1 to x2 is defined to be the area
under the graph of the probability density function between x1 and
x2. Because a single point is an interval of zero width, this implies that
the probability of a continuous random variable assuming any
particular value exactly is zero. It also means that the probability of a
continuous random variable assuming a value in any interval is the
same whether or not the endpoints are included.
12.
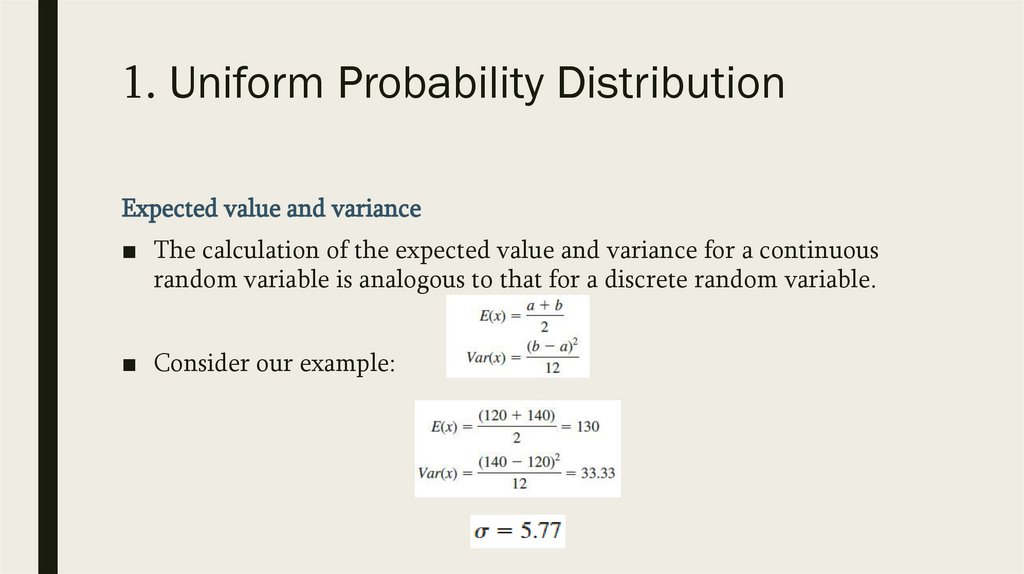
1. Uniform Probability DistributionExpected value and variance
■ The calculation of the expected value and variance for a continuous
random variable is analogous to that for a discrete random variable.
■ Consider our example:
13.
2. Normal Probability Distribution■ The most important probability distribution for describing a
continuous random variable is the normal probability distribution.
■ In such applications, the normal distribution provides a description of
the likely results obtained through sampling.
14.
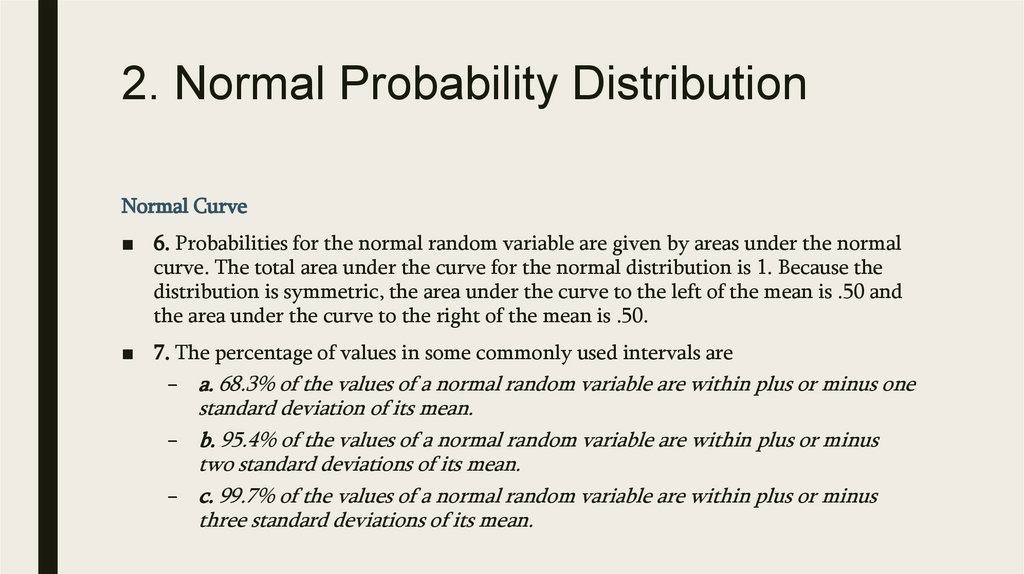
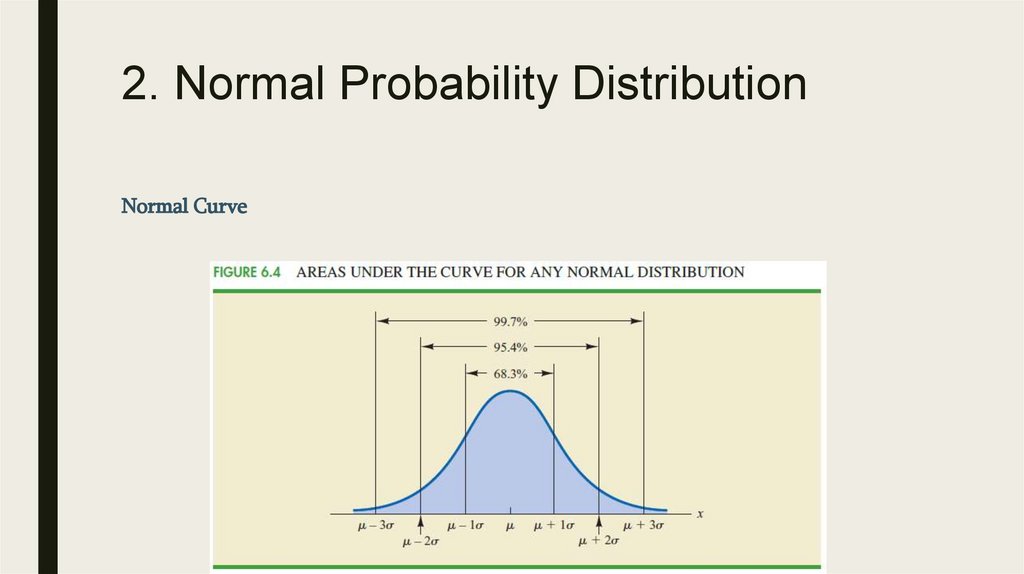
2. Normal Probability DistributionNormal Curve
■ The form, or shape, of the normal distribution is illustrated by the bell
shaped normal curve
15.
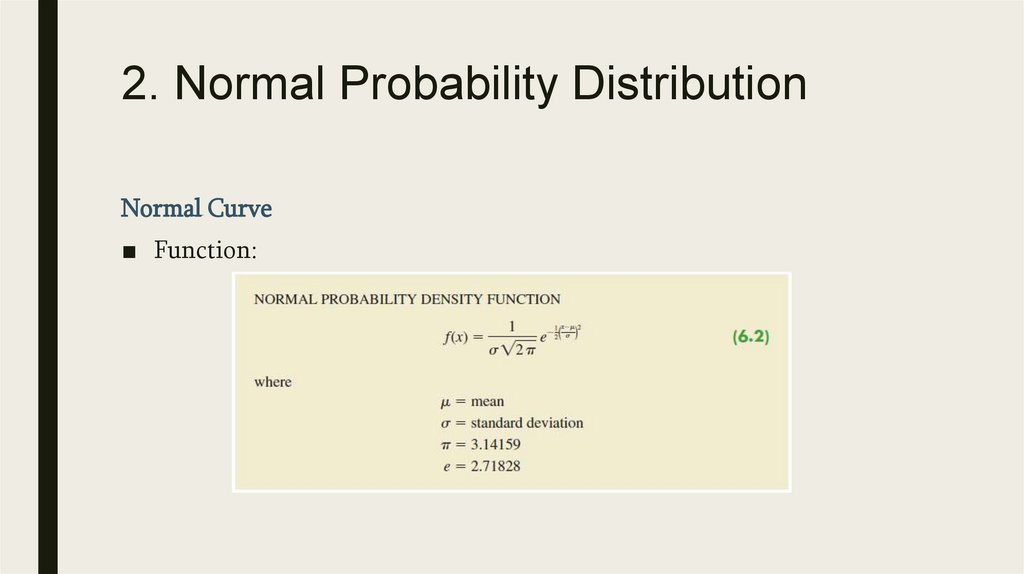
2. Normal Probability DistributionNormal Curve
■ Function:
16.
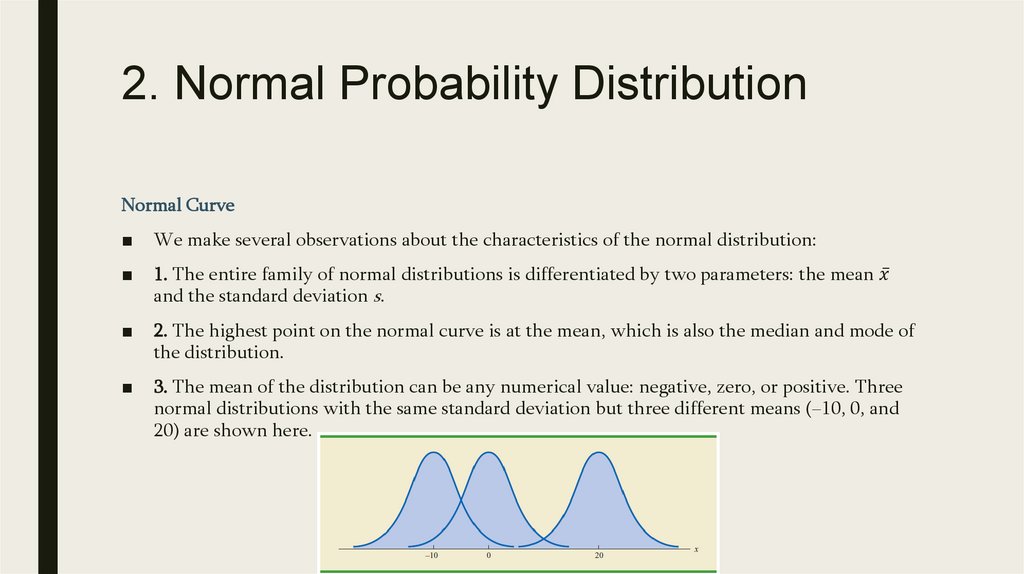
2. Normal Probability DistributionNormal Curve
■
We make several observations about the characteristics of the normal distribution:
■
1. The entire family of normal distributions is differentiated by two parameters: the mean