


 Математика
Похожие презентации:
")
")

")

")
")


Numerical descriptive measures
1.
Statistics for Managers usingMicrosoft Excel
6th Edition
Chapter 3
Numerical Descriptive Measures
Copyright ©2011 Pearson Education, Inc. publishing as Prentice Hall
3-1
2.
Learning ObjectivesIn this chapter, you learn:
To describe the properties of central tendency,
variation, and shape in numerical data
To calculate descriptive summary measures for a
population
Copyright ©2011 Pearson Education, Inc. publishing as Prentice Hall
3-2
3.
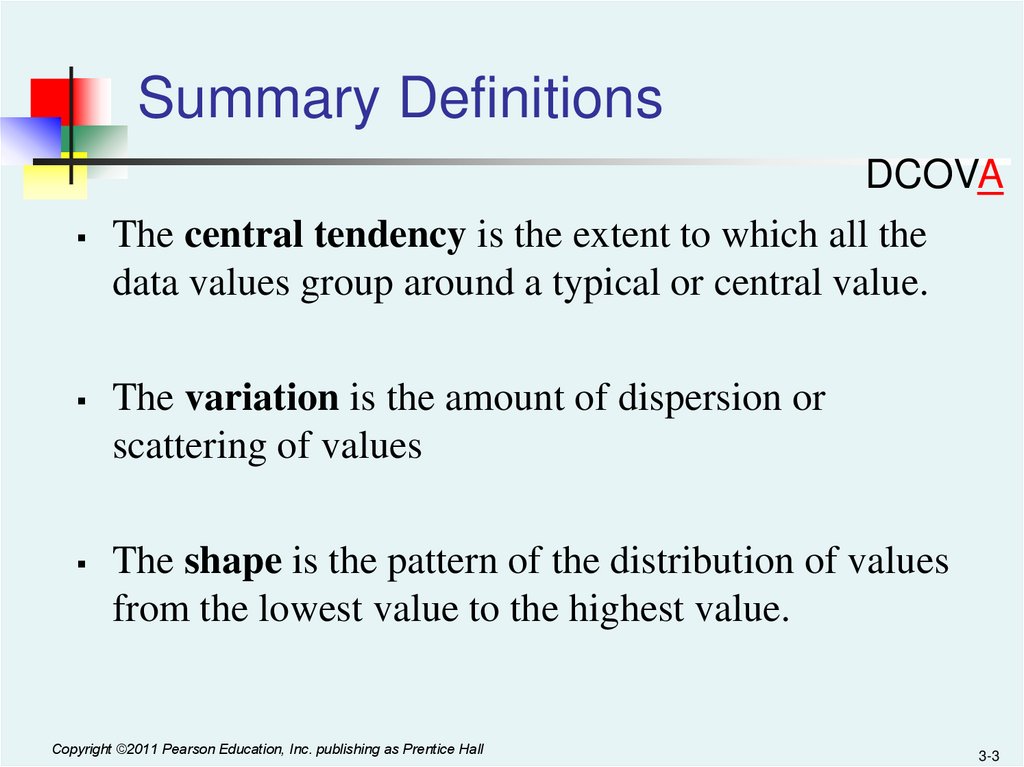
Summary DefinitionsDCOVA
The central tendency is the extent to which all the
data values group around a typical or central value.
The variation is the amount of dispersion or
scattering of values
The shape is the pattern of the distribution of values
from the lowest value to the highest value.
Copyright ©2011 Pearson Education, Inc. publishing as Prentice Hall
3-3
4.
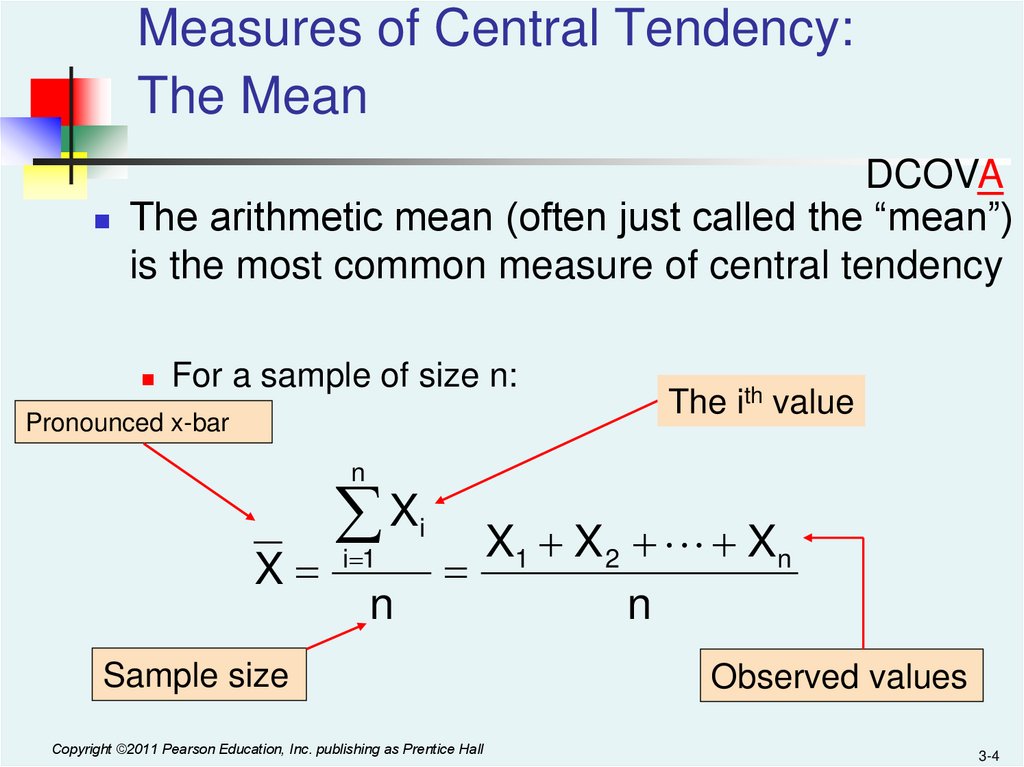
Measures of Central Tendency:The Mean
DCOVA
The arithmetic mean (often just called the “mean”)
is the most common measure of central tendency
For a sample of size n:
Pronounced x-bar
The ith value
n
X
X
i 1
n
i
X1 X 2 Xn
n
Sample size
Copyright ©2011 Pearson Education, Inc. publishing as Prentice Hall
Observed values
3-4
5.
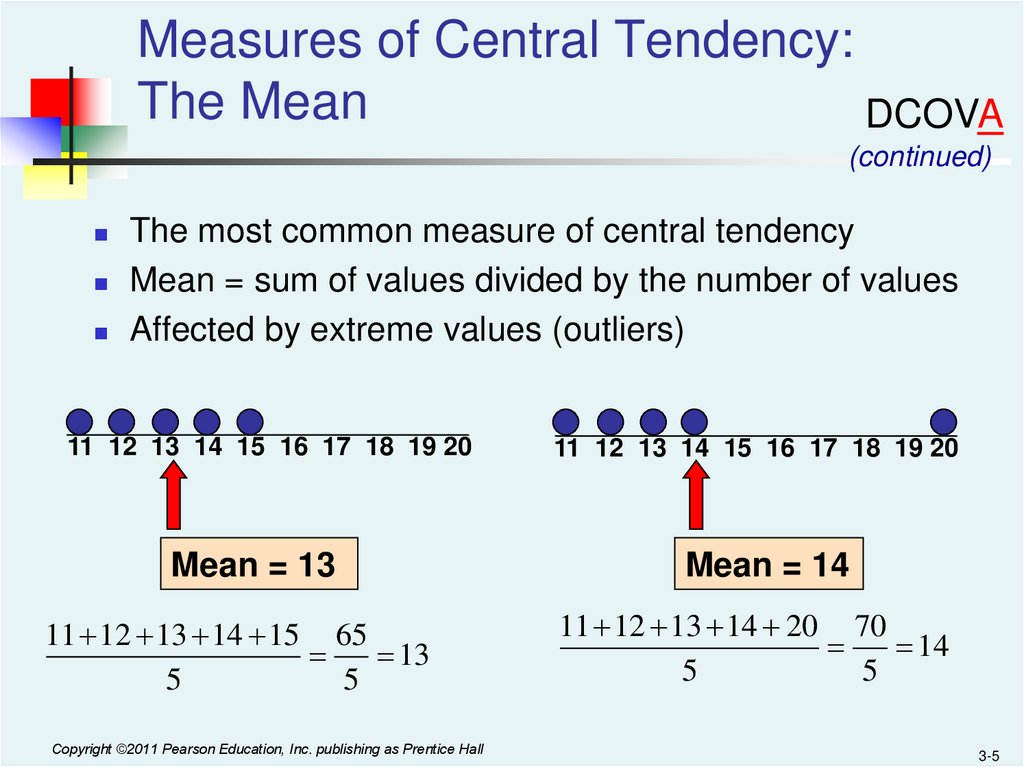
Measures of Central Tendency:The Mean
DCOVA
(continued)
The most common measure of central tendency
Mean = sum of values divided by the number of values
Affected by extreme values (outliers)
11 12 13 14 15 16 17 18 19 20
11 12 13 14 15 16 17 18 19 20
Mean = 13
Mean = 14
11 12 13 14 15 65
13
5
5
11 12 13 14 20 70
14
5
5
Copyright ©2011 Pearson Education, Inc. publishing as Prentice Hall
3-5
6.
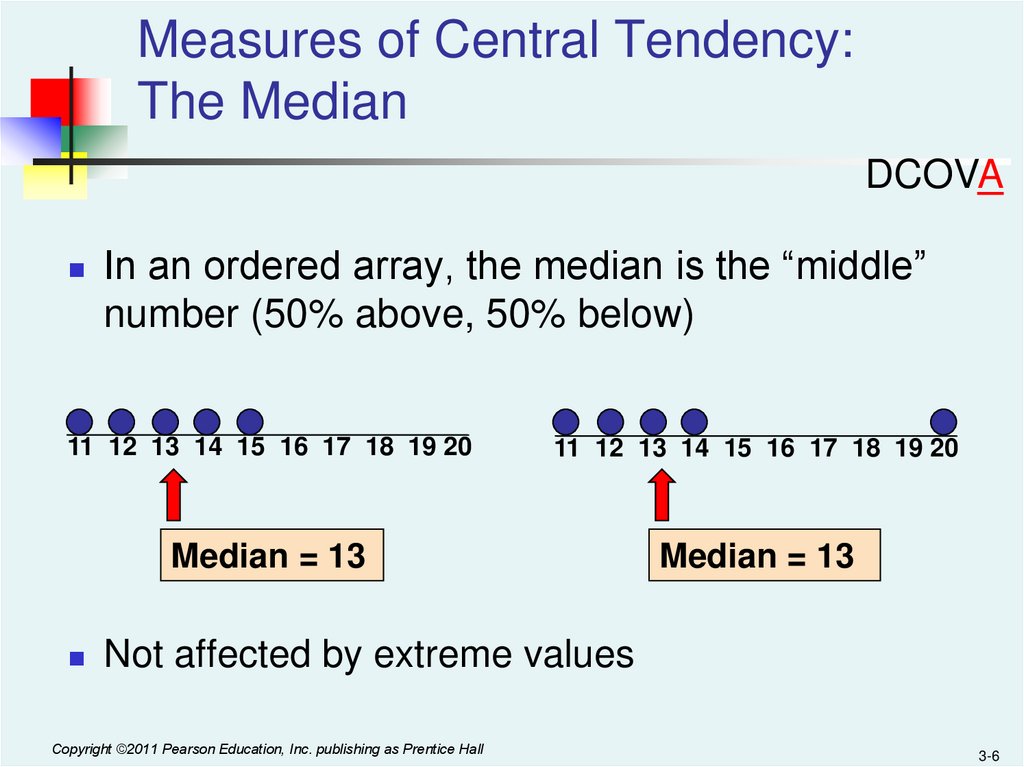
Measures of Central Tendency:The Median
DCOVA
In an ordered array, the median is the “middle”
number (50% above, 50% below)
11 12 13 14 15 16 17 18 19 20
11 12 13 14 15 16 17 18 19 20
Median = 13
Median = 13
Not affected by extreme values
Copyright ©2011 Pearson Education, Inc. publishing as Prentice Hall
3-6
7.
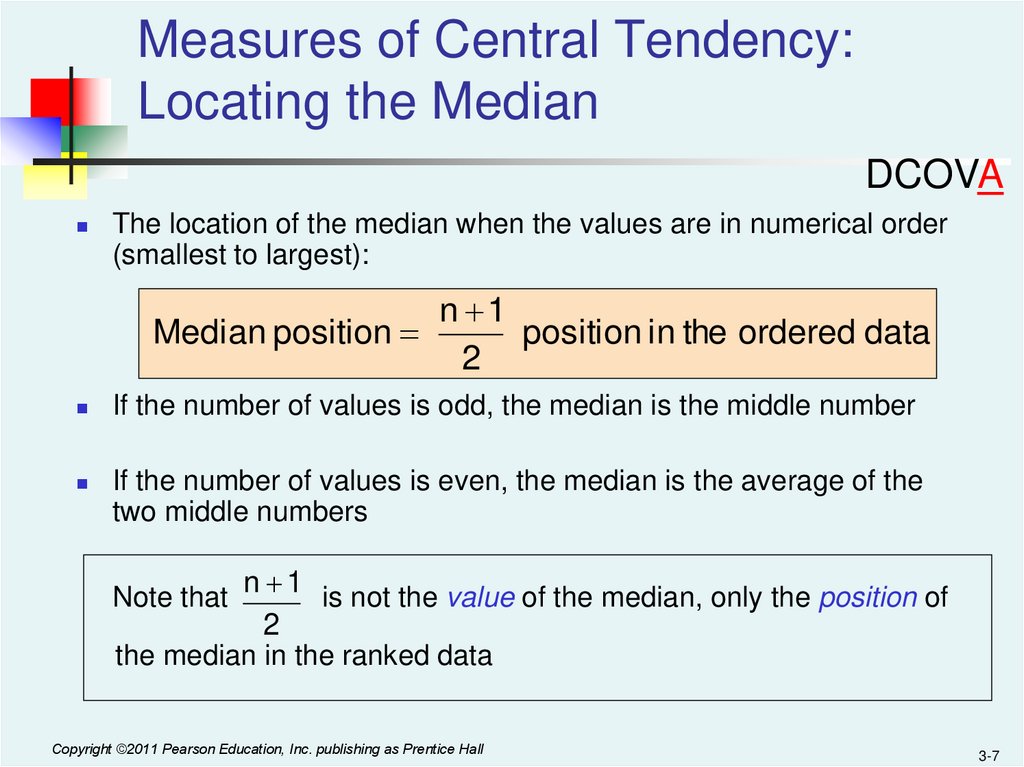
Measures of Central Tendency:Locating the Median
DCOVA
The location of the median when the values are in numerical order
(smallest to largest):
n 1
Median position
position in the ordered data
2
If the number of values is odd, the median is the middle number
If the number of values is even, the median is the average of the
two middle numbers
Note that
n 1 is not the value of the median, only the position of
2
the median in the ranked data
Copyright ©2011 Pearson Education, Inc. publishing as Prentice Hall
3-7
8.
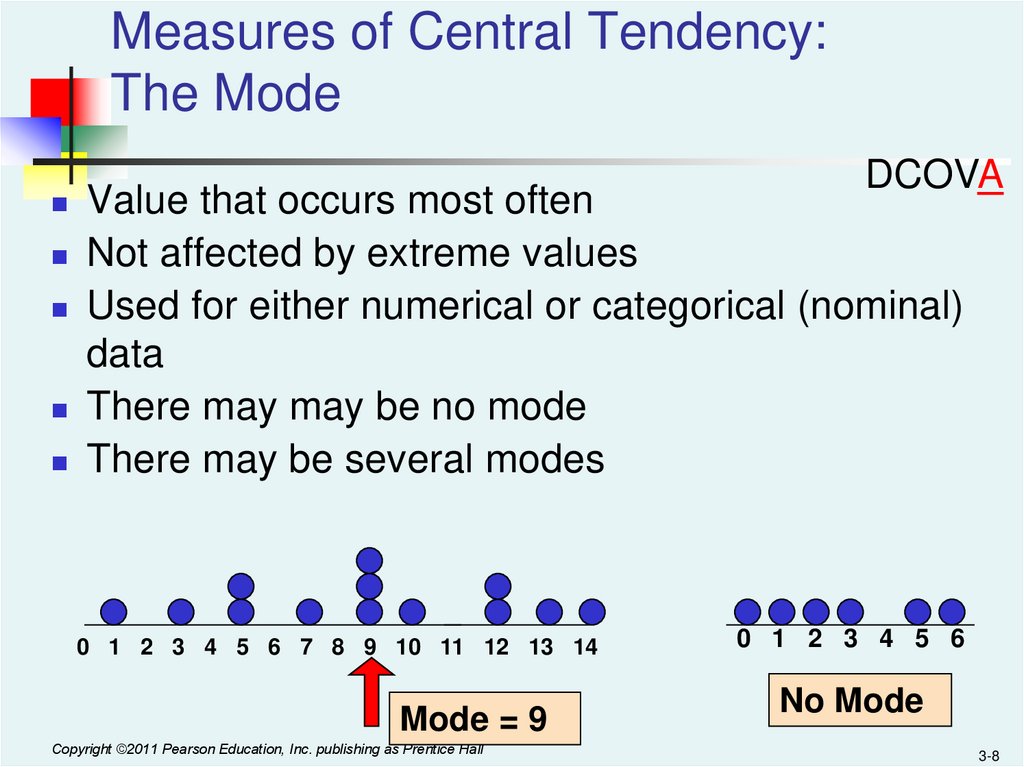
Measures of Central Tendency:The Mode
DCOVA
Value that occurs most often
Not affected by extreme values
Used for either numerical or categorical (nominal)
data
There may may be no mode
There may be several modes
0 1 2 3 4 5 6 7 8 9 10 11 12 13 14
Mode = 9
Copyright ©2011 Pearson Education, Inc. publishing as Prentice Hall
0 1 2 3 4 5 6
No Mode
3-8
9.
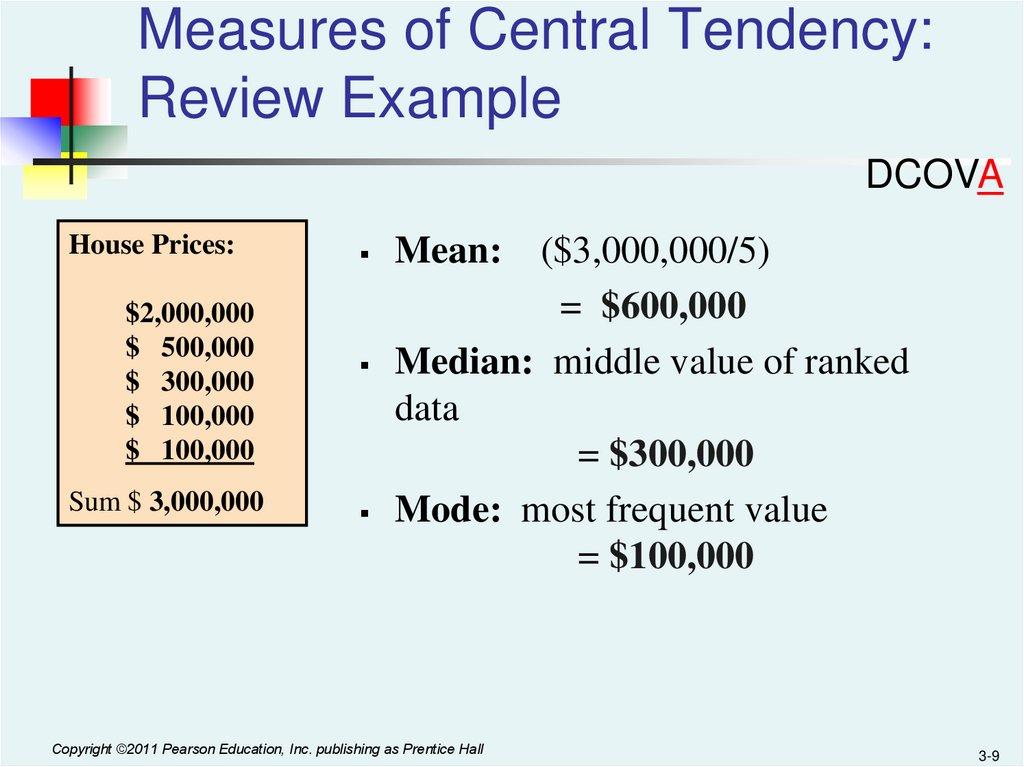
Measures of Central Tendency:Review Example
DCOVA
House Prices:
$2,000,000
$ 500,000
$ 300,000
$ 100,000
$ 100,000
Sum $ 3,000,000
($3,000,000/5)
= $600,000
Median: middle value of ranked
data
= $300,000
Mode: most frequent value
= $100,000
Mean:
Copyright ©2011 Pearson Education, Inc. publishing as Prentice Hall
3-9
10.
Measures of Central Tendency:Which Measure to Choose?
DCOVA
The mean is generally used, unless extreme values
(outliers) exist.
The median is often used, since the median is not
sensitive to extreme values. For example, median
home prices may be reported for a region; it is less
sensitive to outliers.
In some situations it makes sense to report both the
mean and the median.
Copyright ©2011 Pearson Education, Inc. publishing as Prentice Hall
3-10
11.
Measure of Central Tendency For The Rate Of ChangeOf A Variable Over Time:
The Geometric Mean & The Geometric Rate of Return
DCOVA
Geometric mean
Used to measure the rate of change of a variable over time
X G ( X1 X 2 X n )
1/ n
Geometric mean rate of return
Measures the status of an investment over time
RG [(1 R1 ) (1 R 2 ) (1 Rn )]1/ n 1
Where Ri is the rate of return in time period i
Copyright ©2011 Pearson Education, Inc. publishing as Prentice Hall
3-11
12.
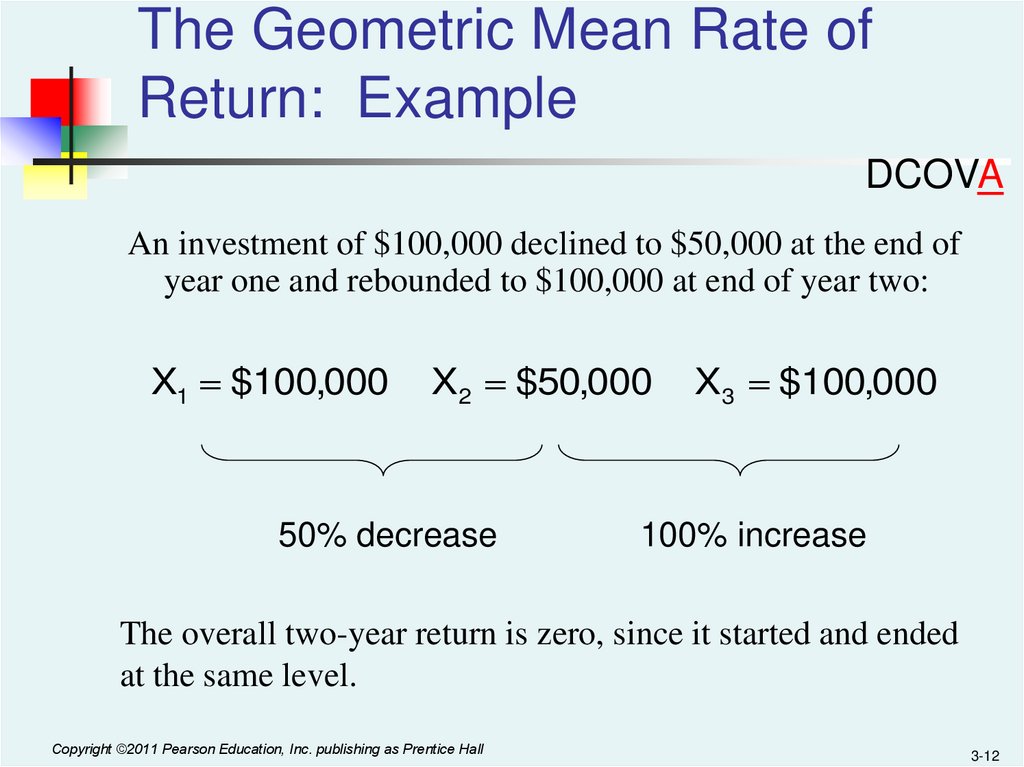
The Geometric Mean Rate ofReturn: Example
DCOVA
An investment of $100,000 declined to $50,000 at the end of
year one and rebounded to $100,000 at end of year two:
X1 $100,000
X2 $50,000
50% decrease
X3 $100,000
100% increase
The overall two-year return is zero, since it started and ended
at the same level.
Copyright ©2011 Pearson Education, Inc. publishing as Prentice Hall
3-12
13.
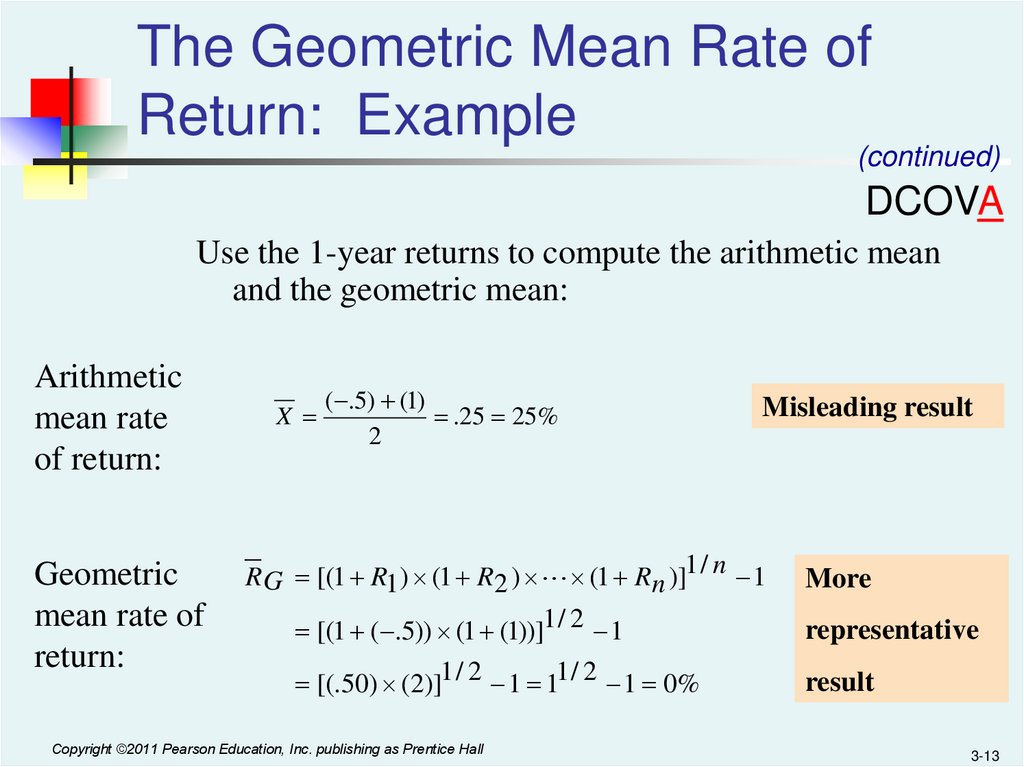
The Geometric Mean Rate ofReturn: Example
(continued)
DCOVA
Use the 1-year returns to compute the arithmetic mean
and the geometric mean:
Arithmetic
mean rate
of return:
Geometric
mean rate of
return:
X
( .5) (1)
.25 25%
2
Misleading result
R G [(1 R1 ) (1 R2 ) (1 Rn )]1 / n 1
[(1 ( .5)) (1 (1))]1 / 2 1
[(. 50) (2)]1 / 2 1 11 / 2 1 0%
Copyright ©2011 Pearson Education, Inc. publishing as Prentice Hall
More
representative
result
3-13
14.
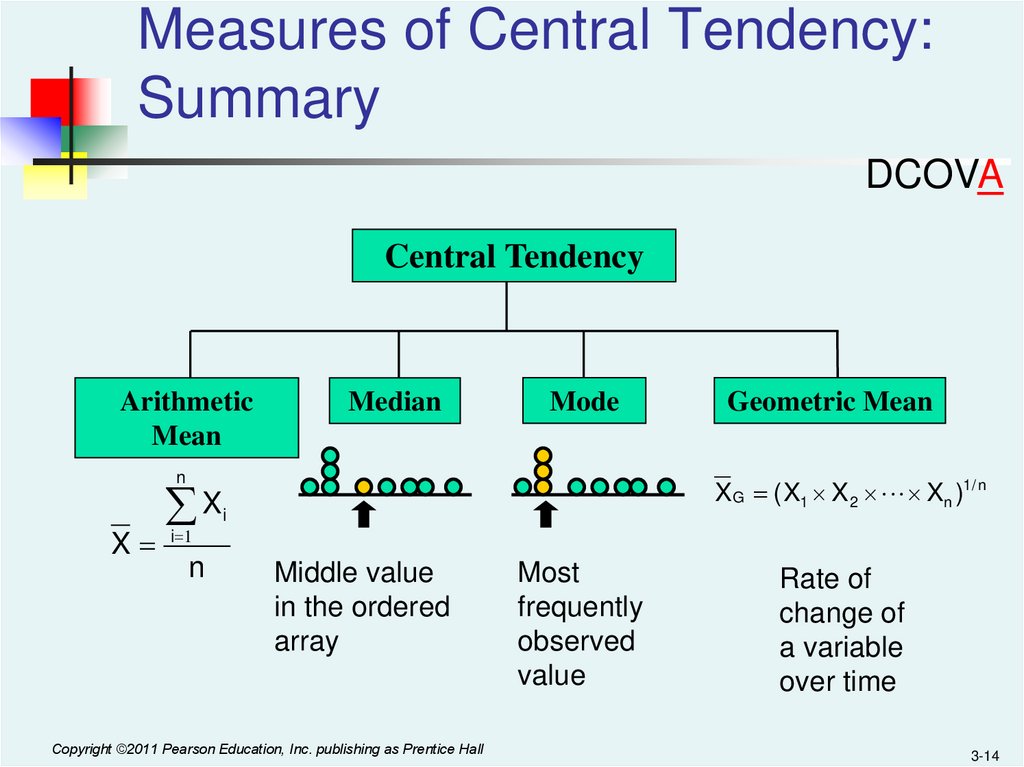
Measures of Central Tendency:Summary
DCOVA
Central Tendency
Arithmetic
Mean
Median
Mode
n
X
X i 1
n
Geometric Mean
XG ( X1 X 2 Xn )1/ n
i
Middle value
in the ordered
array
Copyright ©2011 Pearson Education, Inc. publishing as Prentice Hall
Most
frequently
observed
value
Rate of
change of
a variable
over time
3-14
15.
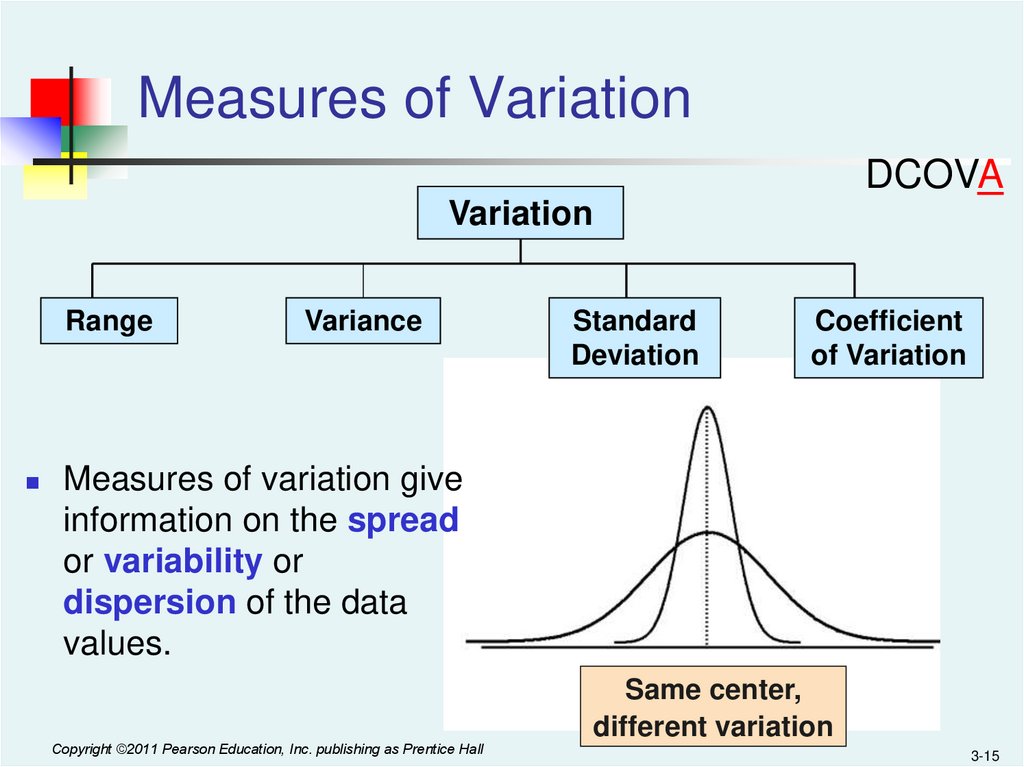
Measures of VariationDCOVA
Variation
Range
Variance
Standard
Deviation
Coefficient
of Variation
Measures of variation give
information on the spread
or variability or
dispersion of the data
values.
Copyright ©2011 Pearson Education, Inc. publishing as Prentice Hall
Same center,
different variation
3-15
16.
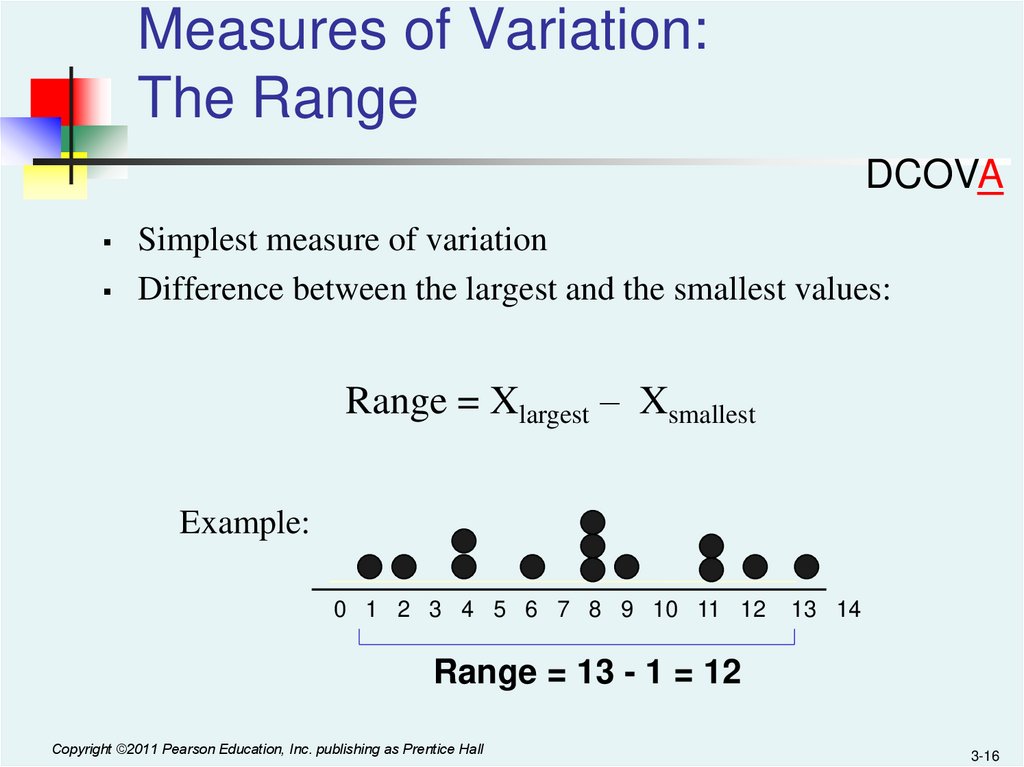
Measures of Variation:The Range
DCOVA
Simplest measure of variation
Difference between the largest and the smallest values:
Range = Xlargest – Xsmallest
Example:
0 1 2 3 4 5 6 7 8 9 10 11 12
13 14
Range = 13 - 1 = 12
Copyright ©2011 Pearson Education, Inc. publishing as Prentice Hall
3-16
17.
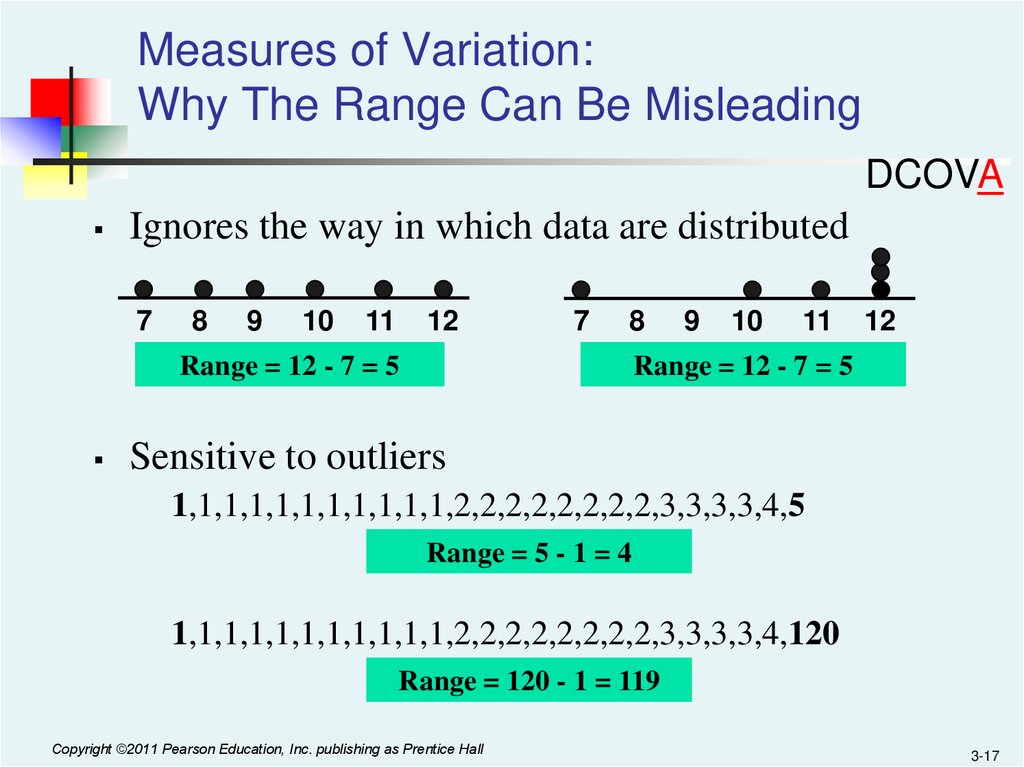
Measures of Variation:Why The Range Can Be Misleading
DCOVA
Ignores the way in which data are distributed
7
8
9
10
11
12
7
8
Range = 12 - 7 = 5
9
10
11
12
Range = 12 - 7 = 5
Sensitive to outliers
1,1,1,1,1,1,1,1,1,1,1,2,2,2,2,2,2,2,2,3,3,3,3,4,5
Range = 5 - 1 = 4
1,1,1,1,1,1,1,1,1,1,1,2,2,2,2,2,2,2,2,3,3,3,3,4,120
Range = 120 - 1 = 119
Copyright ©2011 Pearson Education, Inc. publishing as Prentice Hall
3-17
18.
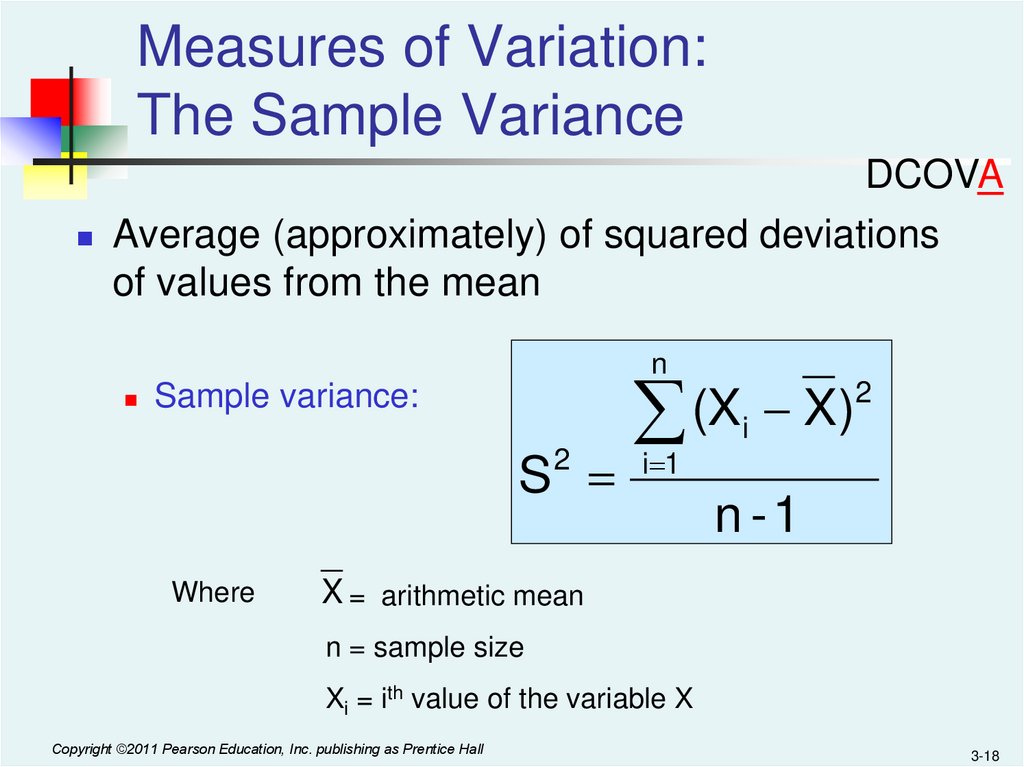
Measures of Variation:The Sample Variance
DCOVA
Average (approximately) of squared deviations
of values from the mean
n
Sample variance:
(X X)
S i 1
2
Where
2
i
n -1
X = arithmetic mean
n = sample size
Xi = ith value of the variable X
Copyright ©2011 Pearson Education, Inc. publishing as Prentice Hall
3-18
19.
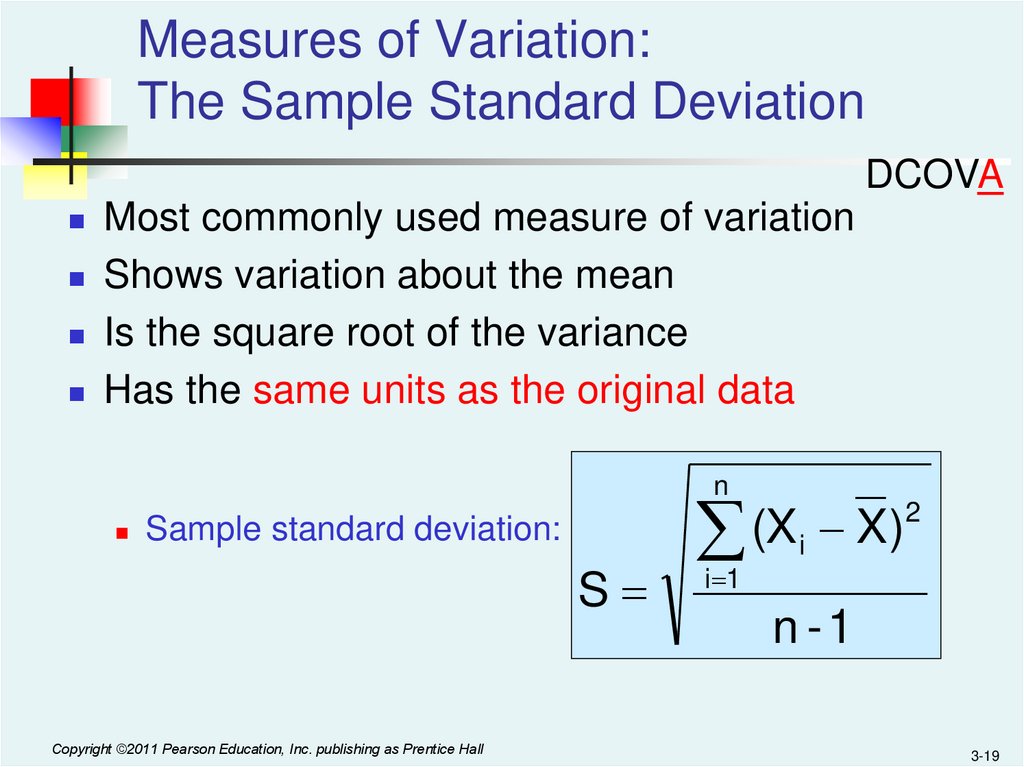
Measures of Variation:The Sample Standard Deviation
DCOVA
Most commonly used measure of variation
Shows variation about the mean
Is the square root of the variance
Has the same units as the original data
n
Sample standard deviation:
S
Copyright ©2011 Pearson Education, Inc. publishing as Prentice Hall
(X X)
i 1
2
i
n -1
3-19
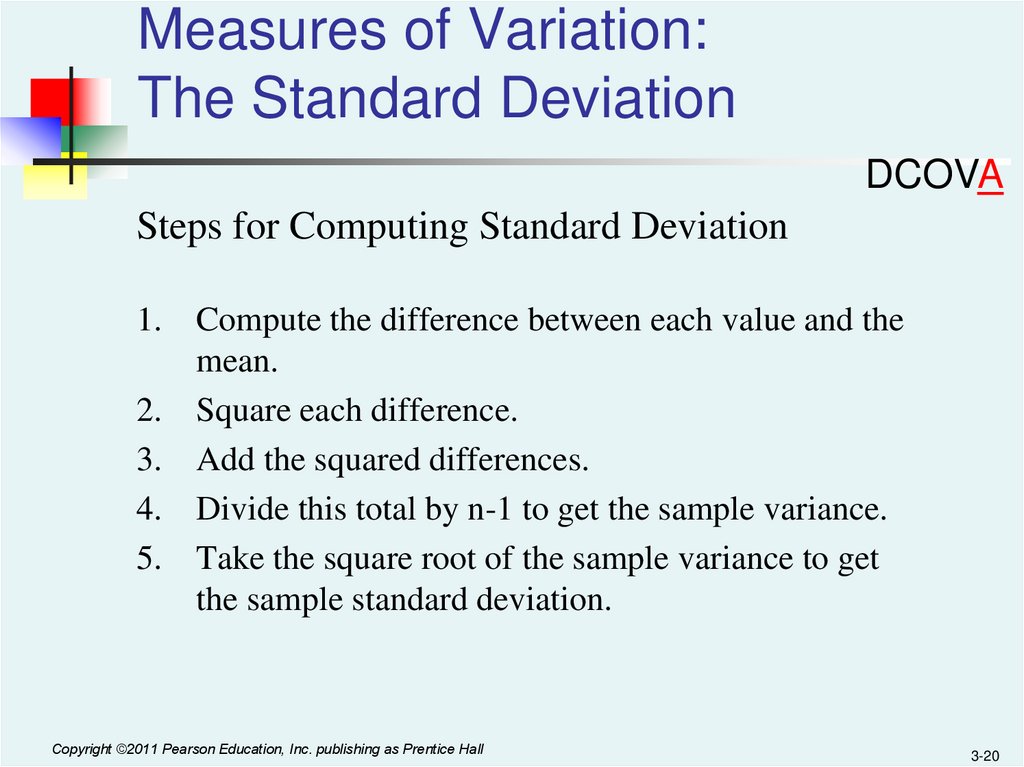
20.
Measures of Variation:The Standard Deviation
DCOVA
Steps for Computing Standard Deviation
1. Compute the difference between each value and the
mean.
2. Square each difference.
3. Add the squared differences.
4. Divide this total by n-1 to get the sample variance.
5. Take the square root of the sample variance to get
the sample standard deviation.
Copyright ©2011 Pearson Education, Inc. publishing as Prentice Hall
3-20
21.
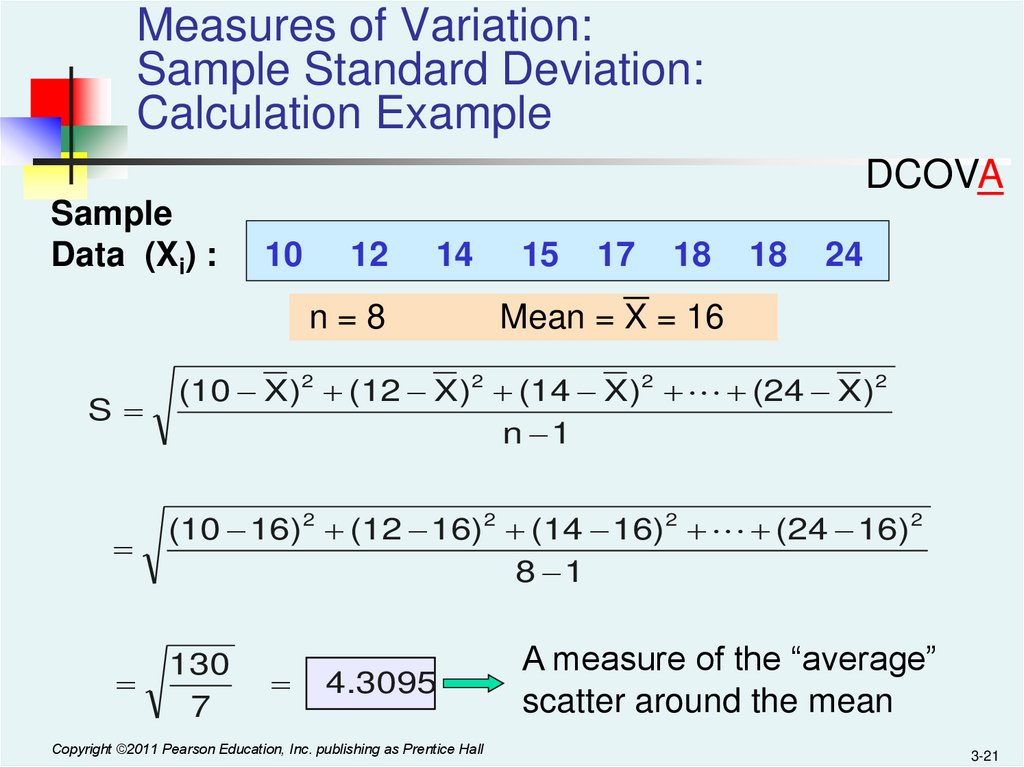
Measures of Variation:Sample Standard Deviation:
Calculation Example
DCOVA
Sample
Data (Xi) :
10
12
14
n=8
15
17
18
18
24
Mean = X = 16
S
(10 X)2 (12 X)2 (14 X)2 (24 X)2
n 1
(10 16)2 (12 16)2 (14 16)2 (24 16)2
8 1
130
7
4.3095
Copyright ©2011 Pearson Education, Inc. publishing as Prentice Hall
A measure of the “average”
scatter around the mean
3-21
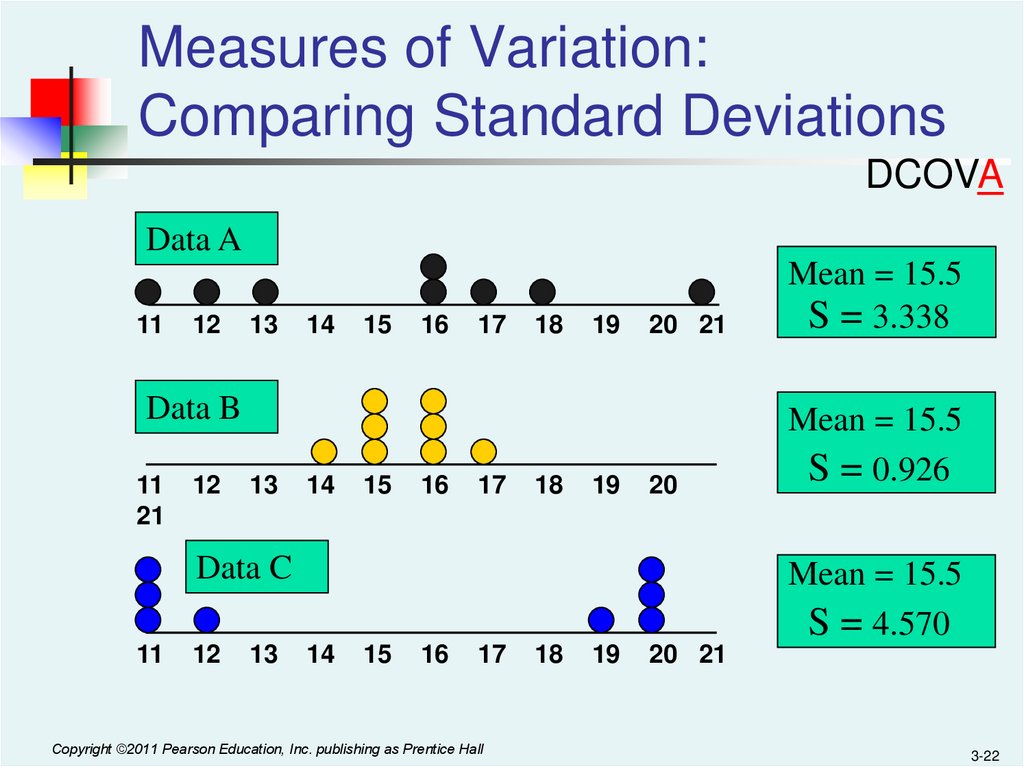
22.
Measures of Variation:Comparing Standard Deviations
DCOVA
Data A
11
12
13
14
15
16
17
18
19
20 21
Mean = 15.5
S = 3.338
20
Mean = 15.5
S = 0.926
Data B
11
21
12
13
14
15
16
17
18
19
Data C
11
12
13
Mean = 15.5
S = 4.570
14
15
16
17
Copyright ©2011 Pearson Education, Inc. publishing as Prentice Hall
18
19
20 21
3-22
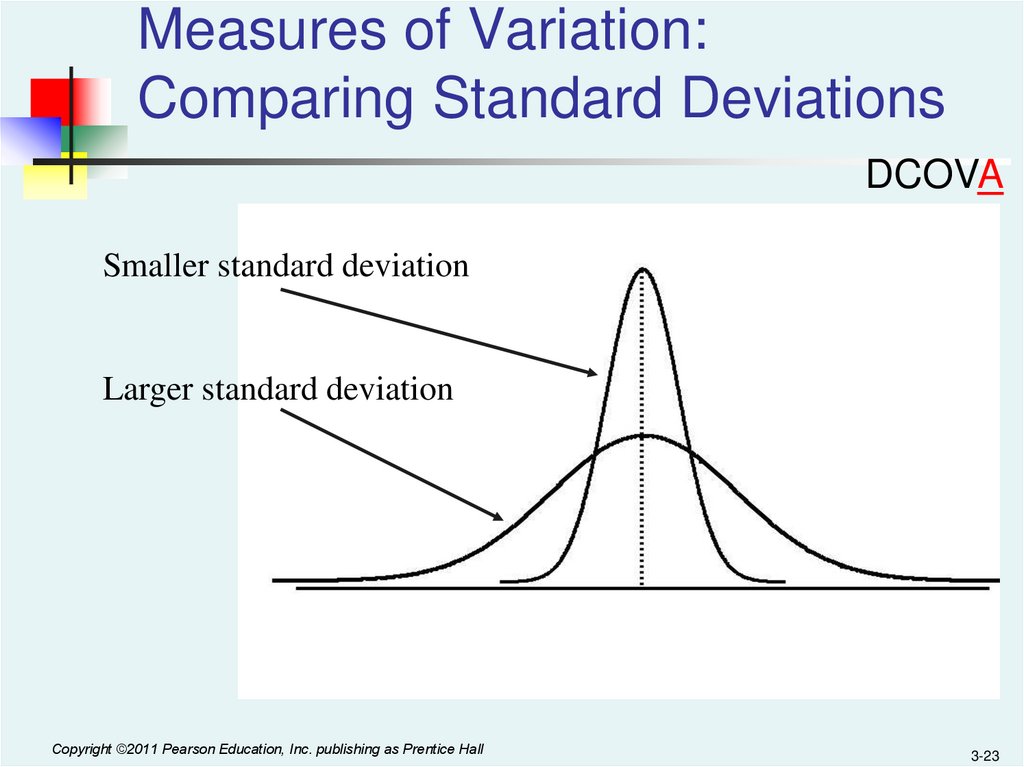
23.
Measures of Variation:Comparing Standard Deviations
DCOVA
Smaller standard deviation
Larger standard deviation
Copyright ©2011 Pearson Education, Inc. publishing as Prentice Hall
3-23
24.
Measures of Variation:Summary Characteristics
DCOVA
The more the data are spread out, the greater the
range, variance, and standard deviation.
The more the data are concentrated, the smaller the
range, variance, and standard deviation.
If the values are all the same (no variation), all these
measures will be zero.
None of these measures are ever negative.
Copyright ©2011 Pearson Education, Inc. publishing as Prentice Hall
3-24
25.
Measures of Variation:The Coefficient of Variation
DCOVA
Measures relative variation
Always in percentage (%)
Shows variation relative to mean
Can be used to compare the variability of two or
more sets of data measured in different units
S
100%
CV
X
Copyright ©2011 Pearson Education, Inc. publishing as Prentice Hall
3-25
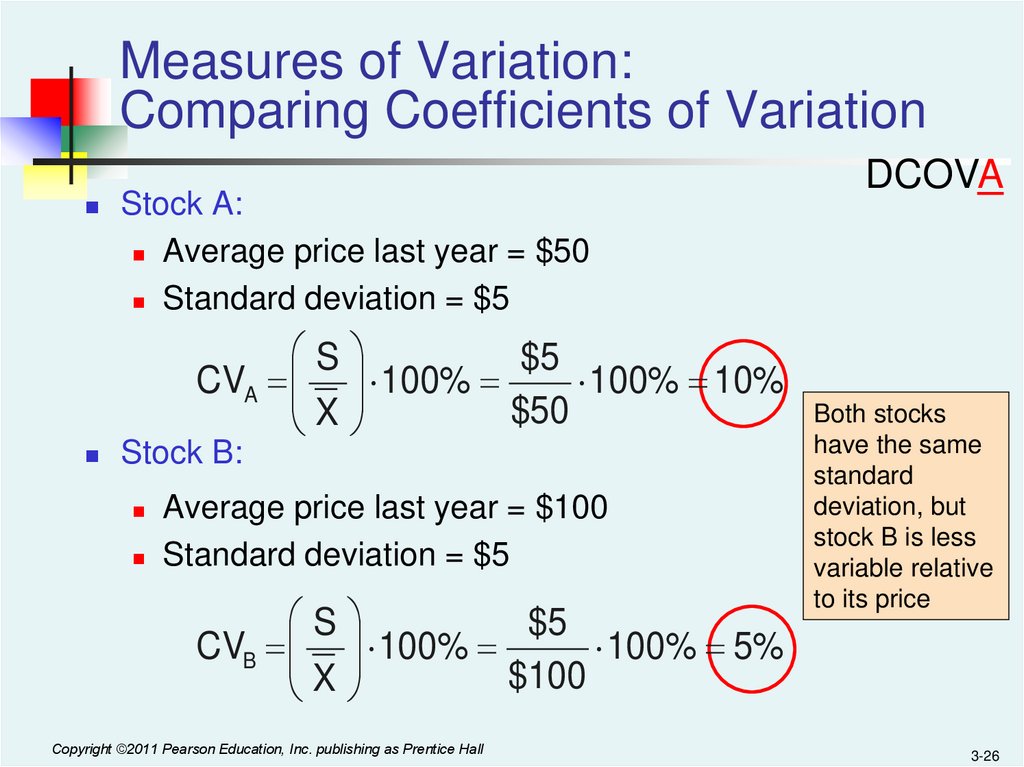
26.
Measures of Variation:Comparing Coefficients of Variation
Stock A:
Average price last year = $50
Standard deviation = $5
S
$5
CVA 100%
100% 10%
$50
X
Stock B:
Average price last year = $100
Standard deviation = $5
S
$5
CVB 100%
100% 5%
$100
X
Copyright ©2011 Pearson Education, Inc. publishing as Prentice Hall
DCOVA
Both stocks
have the same
standard
deviation, but
stock B is less
variable relative
to its price
3-26
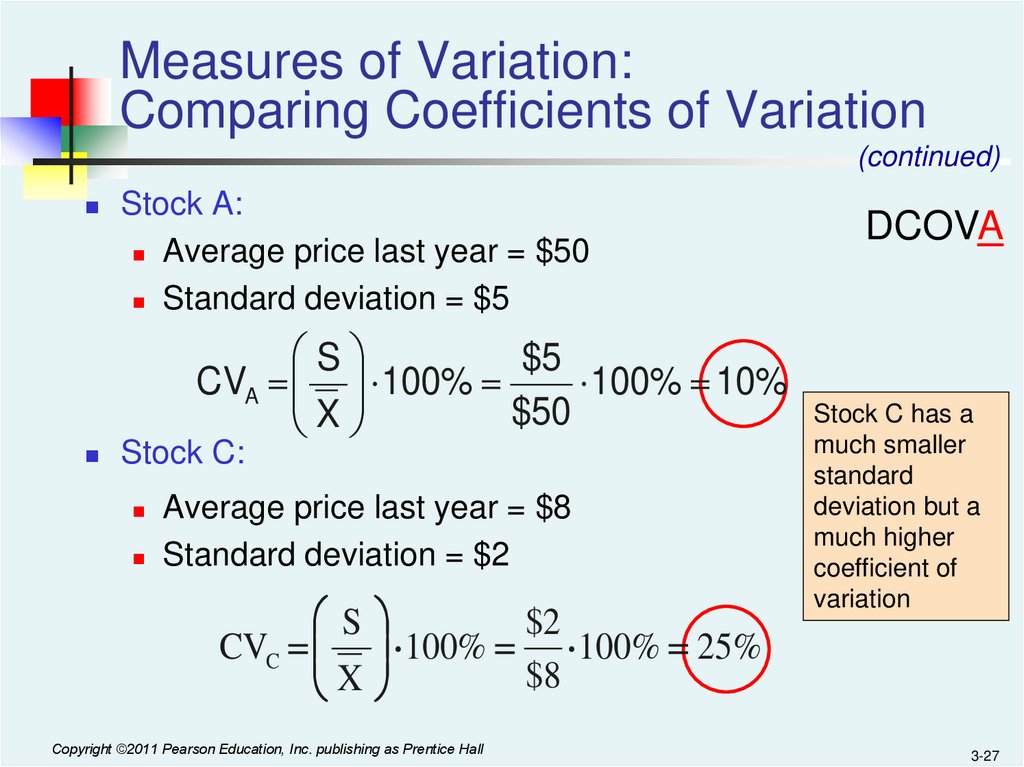
27.
Measures of Variation:Comparing Coefficients of Variation
(continued)
Stock A:
Average price last year = $50
Standard deviation = $5
DCOVA
S
$5
CVA 100%
100% 10%
Stock C has a
$50
X
much smaller
Stock C:
Average price last year = $8
Standard deviation = $2
S
$2
CVC 100% 100% 25%
$8
X
Copyright ©2011 Pearson Education, Inc. publishing as Prentice Hall
standard
deviation but a
much higher
coefficient of
variation
3-27
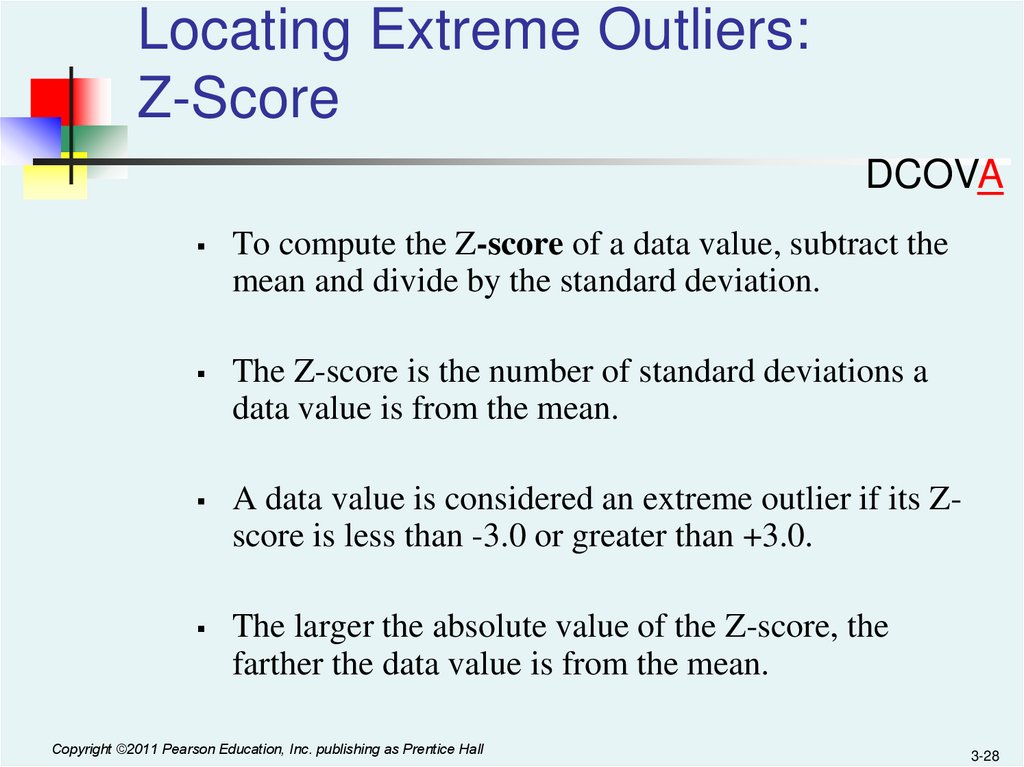
28.
Locating Extreme Outliers:Z-Score
DCOVA
To compute the Z-score of a data value, subtract the
mean and divide by the standard deviation.
The Z-score is the number of standard deviations a
data value is from the mean.
A data value is considered an extreme outlier if its Zscore is less than -3.0 or greater than +3.0.
The larger the absolute value of the Z-score, the
farther the data value is from the mean.
Copyright ©2011 Pearson Education, Inc. publishing as Prentice Hall
3-28
29.
Locating Extreme Outliers:Z-Score
DCOVA
X X
Z
S
where X represents the data value
X is the sample mean
S is the sample standard deviation
Copyright ©2011 Pearson Education, Inc. publishing as Prentice Hall
3-29
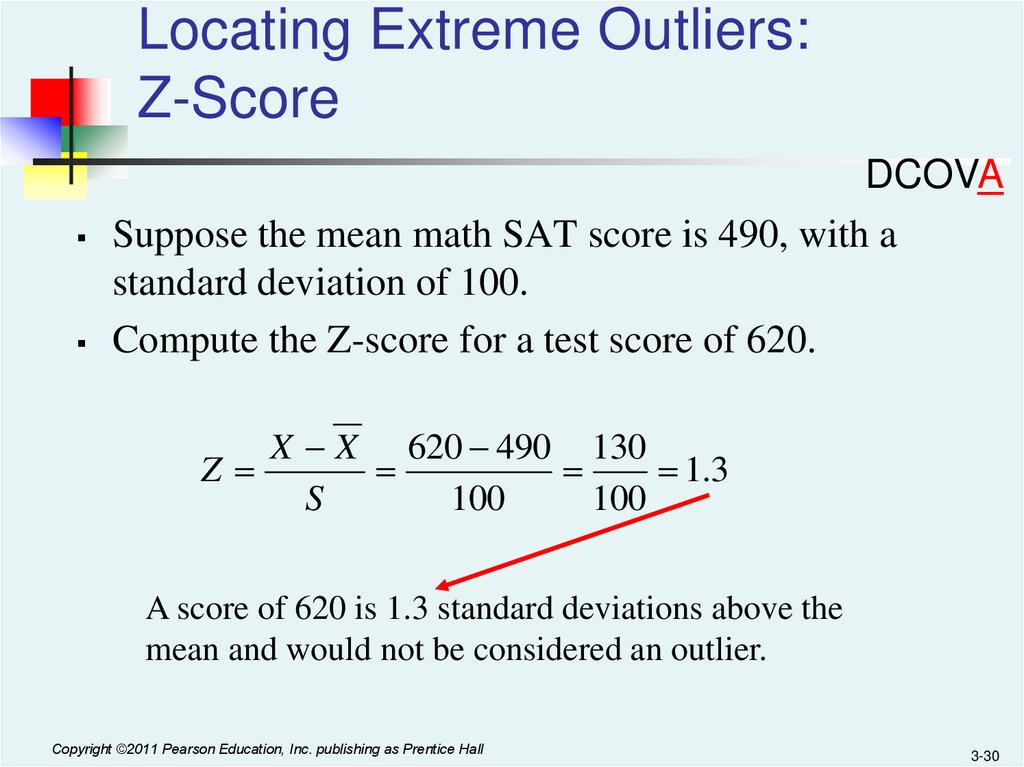
30.
Locating Extreme Outliers:Z-Score
DCOVA
Suppose the mean math SAT score is 490, with a
standard deviation of 100.
Compute the Z-score for a test score of 620.
X X 620 490 130
Z
1.3
S
100
100
A score of 620 is 1.3 standard deviations above the
mean and would not be considered an outlier.
Copyright ©2011 Pearson Education, Inc. publishing as Prentice Hall
3-30
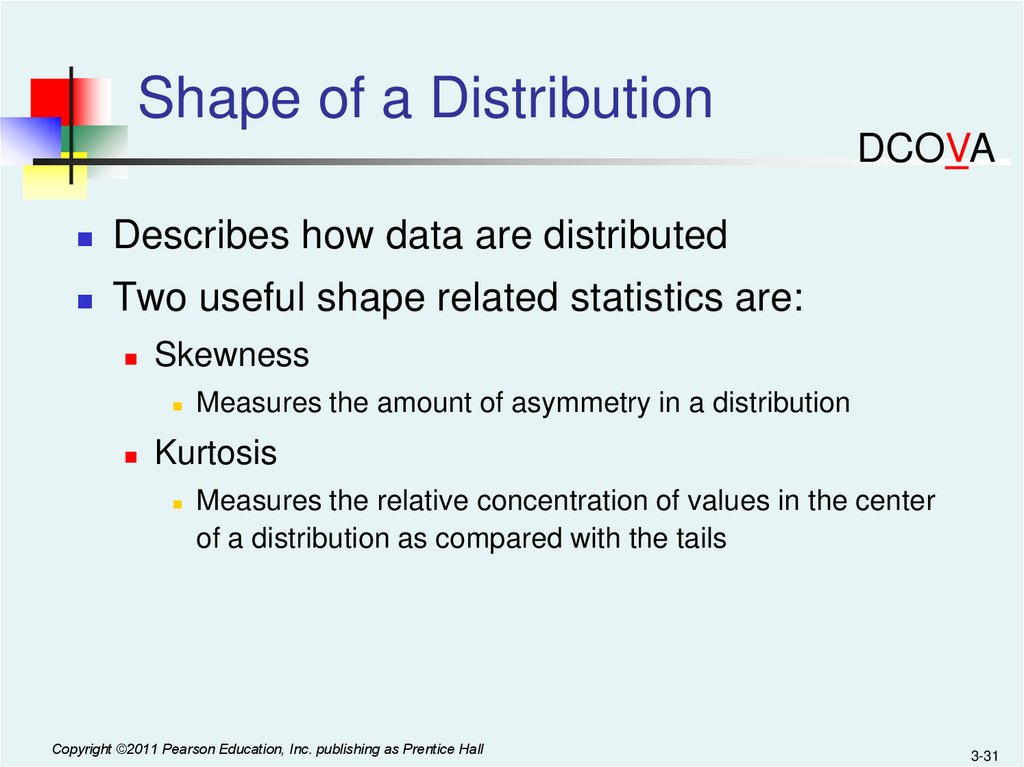
31.
Shape of a DistributionDCOVA
Describes how data are distributed
Two useful shape related statistics are:
Skewness
Measures the amount of asymmetry in a distribution
Kurtosis
Measures the relative concentration of values in the center
of a distribution as compared with the tails
Copyright ©2011 Pearson Education, Inc. publishing as Prentice Hall
3-31
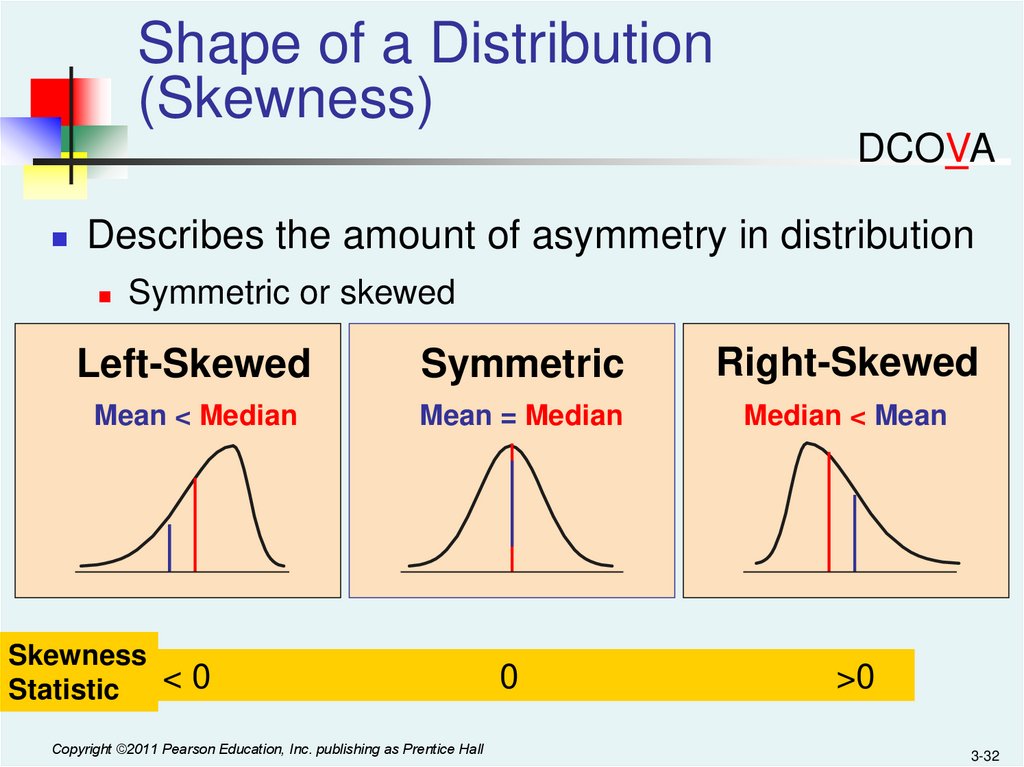
32.
Shape of a Distribution(Skewness)
DCOVA
Describes the amount of asymmetry in distribution
Symmetric or skewed
Left-Skewed
Symmetric
Right-Skewed
Mean < Median
Mean = Median
Median < Mean
0
>0
Skewness
Statistic < 0
Copyright ©2011 Pearson Education, Inc. publishing as Prentice Hall
3-32
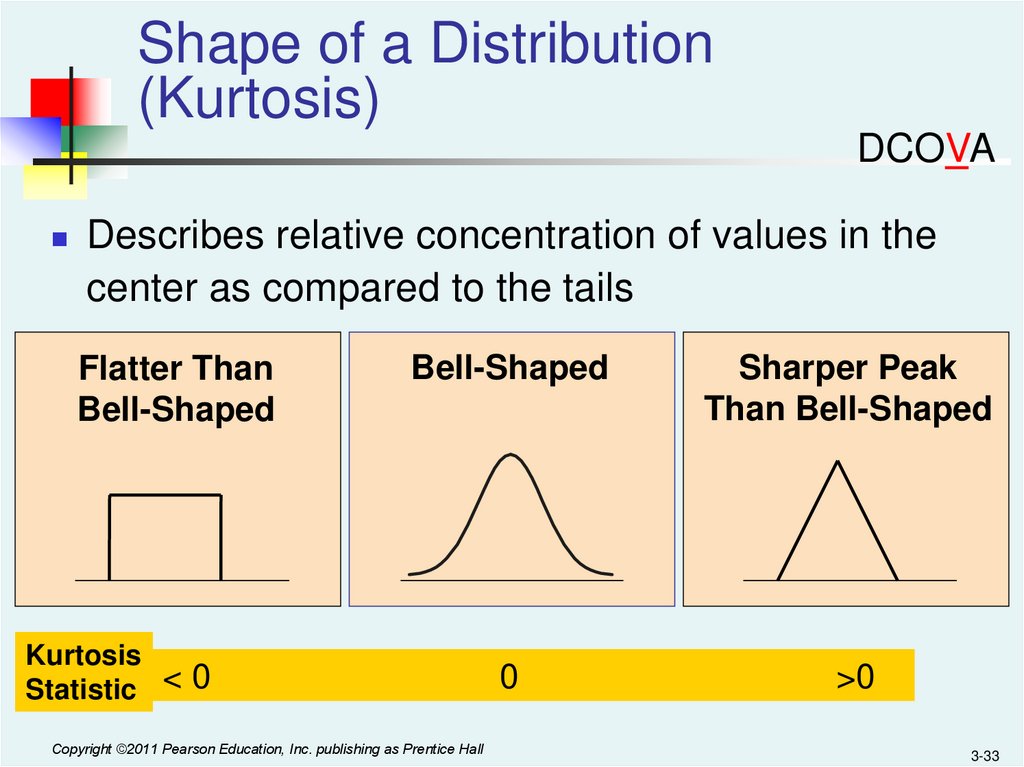
33.
Shape of a Distribution(Kurtosis)
DCOVA
Describes relative concentration of values in the
center as compared to the tails
Flatter Than
Bell-Shaped
Bell-Shaped
Sharper Peak
Than Bell-Shaped
0
>0
Kurtosis
Statistic < 0
Copyright ©2011 Pearson Education, Inc. publishing as Prentice Hall
3-33
34.
All rights reserved. No part of this publication may be reproduced, stored in a retrievalsystem, or transmitted, in any form or by any means, electronic, mechanical, photocopying,
recording, or otherwise, without the prior written permission of the publisher.
Printed in the United States of America.
Copyright ©2011 Pearson Education, Inc. publishing as Prentice Hall
3-34