 Промышленность
Похожие презентации:


Materials Science & Engineering A
1.
2.
A. Bhadeligo ct al.Materials Science & Engineering A 918 (2024) 147488
the joint or defect. A joint or defect exceeding 200 pm width is designated as wide gap blazing [15]. In WGB, the braze filler alloy is
composed of a braze alloy with MPD and additional gap filler powder
with a composition similar to that of the base material [14]. The additional alloy powder remains solid during the brazing process and serves
fundamental roles in bridging the large gap between two adjoining
surfaces, acting as a “sink” for boron, and providing capillary pressure to
attract molten braze alloy into the void [14,16]. Furthermore, Yu et al.
[17] reported that the addition of alloy powder into the braze filler alloy
improves the ductility of the wide gap brazed joints compared to joints
brazed solely with the braze alloy. In the diffusion brazing process, the
isothermal solidification occurs by solid-state diffusion of the melting
point depressant (such as boron) into the base material. However, in
case of incomplete isothermal solidification, the brazed joint exhibits the
presence of eutectic-type solidification products [18,19a .
The mechanical properties of brazed joints differ significantly from
those of the individual base materials due to the formation of heterogeneous systems with the substrate material and braze alloy, which results in a complex microstructure [20a . Research has been conducted to
investigate the mechanical properties and fracture behavior of brazed
joints. For example, Henhoeffer et a1. conducted a study on narrow gap
brazed joints of nickel-based alloys X-40 and IN738, analyzing the
high-temperature tensile properties. The as-brazed joint exhibited
higher yield strength but reduced ductility compared to the substrate
material X-40 [3]. Additionally, their investigation on fatigue properties
of narrow and wide gap brazed joints concluded that both NGB and WGB
joints exhibited poor fatigue strength and fatigue lives compared to the
substrate [21]. Similar findings were observed by Shi et a1. [9], indicating a reduction in creep and fatigue lifetime of a brazed joint of
directionally solidified DZ125 superalloy. In addition, the brazing zone
was identified as the weakest point with regard to creep and fatigue
strength at elevated temperatures. Yang et a1. further investigated the
low cycle fatigue (LCF) behavior and its fracture mechanisms of the
DZ125 brazed joint at elevated temperatures. Their findings indicated
that the brazed joint exhibited lower fatigue strength and distinct fracture mechanisms compared to the DZ125 base material [22]. Despite
these efforts, understanding fatigue crack growth (FCG) behavior and
mechanisms in brazed joints remains limited and largely unexplored.
Weiss and Grushko [23] reported the fatigue crack propagation in
brazed joint specimens as uncontrollable. A quantitative characterization of fatigue crack growth behavior in brazed joints remains unaddressed in the existing literature. A more comprehensive understanding
of this behavior is essential for the reliable prediction of the lifetime of
brazed or repaired components and can also provide important inputs to
optimize the brazing process, thereby enhancing the performance of
brazed joints. Additionally, since components made from Alloy 247DS,
such as gas turbine blades, operate in high-temperature environments,
investigating the fatigue crack growth behavior of brazed joints under
such conditions is essential to simulate real-world operating environments and to gain an understanding of how these joints perform under
elevated temperatures.
The present paper aims to address the aforementioned research gaps
and objectives in the following manner: (i) Implement the standard
high-temperature fatigue crack growth experimental technique for
brazed specimens, with required modifications such as stress intensity
factor calculations; (ii) provide a quantitative characterization of fatigue
crack growth in brazed joints of directionally solidified Ni-base alloy; (ii)
explore the influence of grain orientations on fatigue crack growth in
brazed joints at elevated temperatures; and (iv) analyze the microstructure of the brazing seam to elucidate crack growth mechanisms
under cyclic loading.
2. Materials and test methods
2.1. Materials
The base material under investigation was Alloy 247DS, a nickelbased superalloy typically employed in gas turbine blades. Table 1
presents the nominal chemical composition of Alloy 247DS used in this
study. The filler braze alloy used in the brazing process consisted of a
mixture of 75 % Alloy 247 powder and 25 % nickel diffusion braze alloy.
The Amdry BRB (Oerlikon Metco) was chosen as the nickel-based
diffusion braze alloy, and its nominal chemical composition is also
provided in Tulale 4. The Amdry BRB exhibits a solidus temperature of
1055 °C and a liquidus temperature of 1120 °C, respectively. The
blazing temperature of this braze alloy falls within the range of
1177 °C—1232 °C. A recommended diffusion cycle duration is between 2
h and 4 h [24].
2.2. Test specimen preparation
To produce the brazed joint specimens, two cylindrical base material
parts were initially fabricated from plates of Alloy 247DS of 20 mm
thickness. The base material of Alloy 247DS was solution annealed. This
base material was produced by a directional solidification (DS) casting
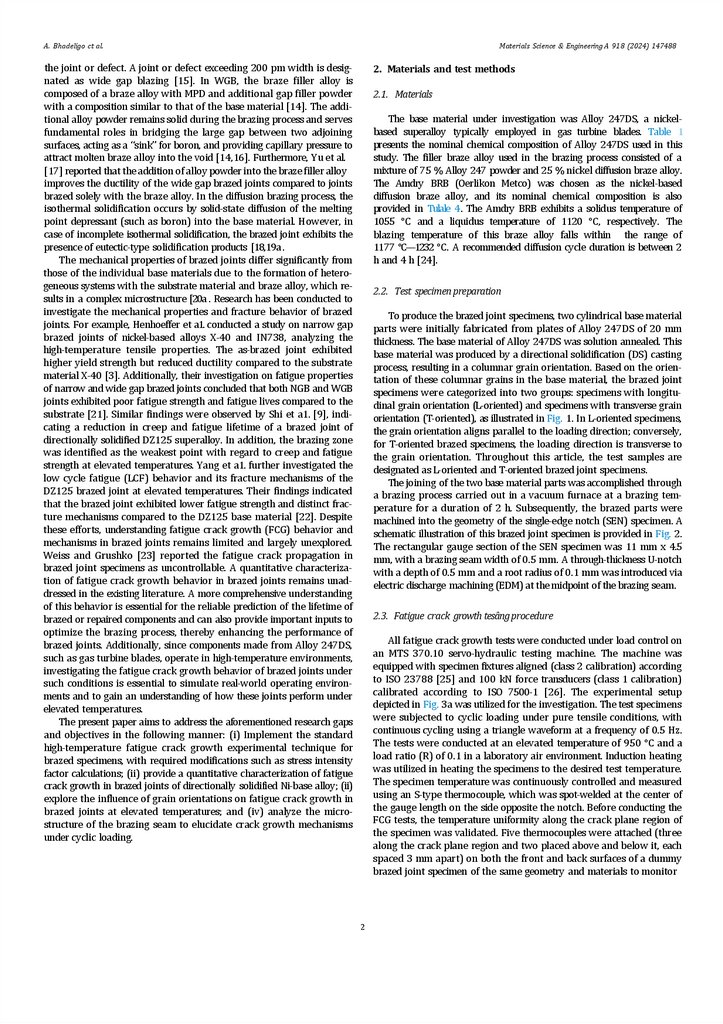
process, resulting in a columnar grain orientation. Based on the orientation of these columnar grains in the base material, the brazed joint
specimens were categorized into two groups: specimens with longitudinal grain orientation (L-oriented) and specimens with transverse grain
orientation (T-oriented), as illustrated in Fig. 1. In L-oriented specimens,
the grain orientation aligns parallel to the loading direction; conversely,
for T-oriented brazed specimens, the loading direction is transverse to
the grain orientation. Throughout this article, the test samples are
designated as L-oriented and T-oriented brazed joint specimens.
The joining of the two base material parts was accomplished through
a brazing process carried out in a vacuum furnace at a brazing temperature for a duration of 2 h. Subsequently, the brazed parts were
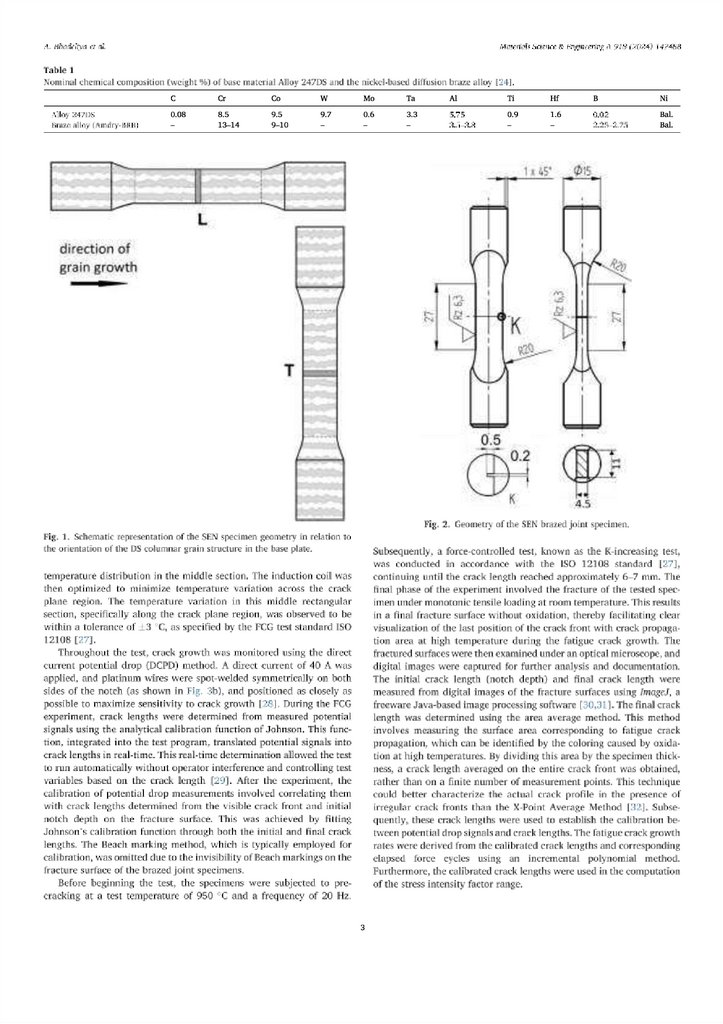
machined into the geometry of the single-edge notch (SEN) specimen. A
schematic illustration of this brazed joint specimen is provided in Fig. 2.
The rectangular gauge section of the SEN specimen was 11 mm x 4.5
mm, with a brazing seam width of 0.5 mm. A through-thickness U-notch
with a depth of 0.5 mm and a root radius of 0.1 mm was introduced via
electric discharge machining (EDM) at the midpoint of the brazing seam.
2.3. Fatigue crack growth tesâng procedure
All fatigue crack growth tests were conducted under load control on
an MTS 370.10 servo-hydraulic testing machine. The machine was
equipped with specimen fixtures aligned (class 2 calibration) according
to ISO 23788 [25] and 100 kN force transducers (class 1 calibration)
calibrated according to ISO 7500-1 [26]. The experimental setup
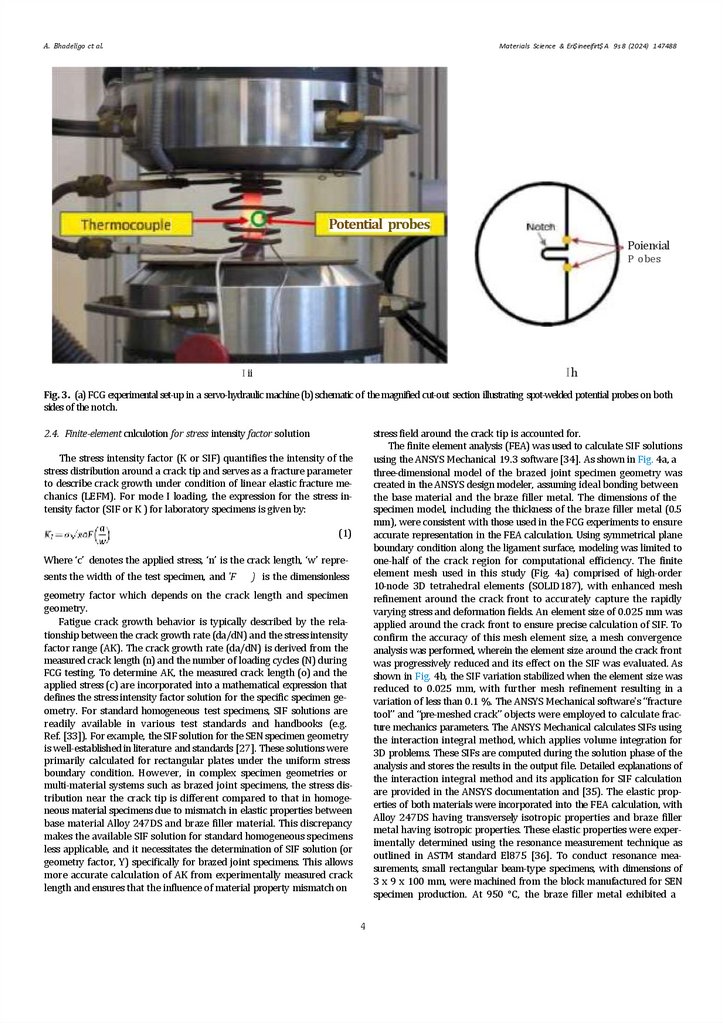
depicted in Fig. 3a was utilized for the investigation. The test specimens
were subjected to cyclic loading under pure tensile conditions, with
continuous cycling using a triangle waveform at a frequency of 0.5 Hz.
The tests were conducted at an elevated temperature of 950 °C and a
load ratio (R) of 0.1 in a laboratory air environment. Induction heating
was utilized in heating the specimens to the desired test temperature.
The specimen temperature was continuously controlled and measured
using an S-type thermocouple, which was spot-welded at the center of
the gauge length on the side opposite the notch. Before conducting the
FCG tests, the temperature uniformity along the crack plane region of
the specimen was validated. Five thermocouples were attached (three
along the crack plane region and two placed above and below it, each
spaced 3 mm apart) on both the front and back surfaces of a dummy
brazed joint specimen of the same geometry and materials to monitor
2
3.
4.
A. Bhadeligo ct al.Materials Science & Eri$ineeifirt$ A 9s 8 (2024) 147488
Potential probes
Poien‹ial
P obes
Ih
I ii
Fig. 3. (a) FCG experimental set-up in a servo-hydraulic machine (b) schematic of the magnified cut-out section illustrating spot-welded potential probes on both
sides of the notch.
2.4. Finite-element cnlculotion for stress intensity factor solution
stress field around the crack tip is accounted for.
The finite element analysis (FEA) was used to calculate SIF solutions
using the ANSYS Mechanical 19.3 software [34]. As shown in Fig. 4a, a
three-dimensional model of the brazed joint specimen geometry was
created in the ANSYS design modeler, assuming ideal bonding between
the base material and the braze filler metal. The dimensions of the
specimen model, including the thickness of the braze filler metal (0.5
mm), were consistent with those used in the FCG experiments to ensure
accurate representation in the FEA calculation. Using symmetrical plane
boundary condition along the ligament surface, modeling was limited to
one-half of the crack region for computational efficiency. The finite
element mesh used in this study (Fig. 4a) comprised of high-order
10-node 3D tetrahedral elements (SOLID187), with enhanced mesh
refinement around the crack front to accurately capture the rapidly
varying stress and deformation fields. An element size of 0.025 mm was
applied around the crack front to ensure precise calculation of SIF. To
confirm the accuracy of this mesh element size, a mesh convergence
analysis was performed, wherein the element size around the crack front
was progressively reduced and its effect on the SIF was evaluated. As
shown in Fig. 4b, the SIF variation stabilized when the element size was
reduced to 0.025 mm, with further mesh refinement resulting in a
variation of less than 0.1 %. The ANSYS Mechanical software's “fracture
tool” and “pre-meshed crack” objects were employed to calculate fracture mechanics parameters. The ANSYS Mechanical calculates SIFs using
the interaction integral method, which applies volume integration for
3D problems. These SIFs are computed during the solution phase of the
analysis and stores the results in the output file. Detailed explanations of
the interaction integral method and its application for SIF calculation
are provided in the ANSYS documentation and [35). The elastic properties of both materials were incorporated into the FEA calculation, with
Alloy 247DS having transversely isotropic properties and braze filler
metal having isotropic properties. These elastic properties were experimentally determined using the resonance measurement technique as
outlined in ASTM standard El875 [36]. To conduct resonance measurements, small rectangular beam-type specimens, with dimensions of
3 x 9 x 100 mm, were machined from the block manufactured for SEN
specimen production. At 950 °C, the braze filler metal exhibited a
The stress intensity factor (K or SIF) quantifies the intensity of the
stress distribution around a crack tip and serves as a fracture parameter
to describe crack growth under condition of linear elastic fracture mechanics (LEFM). For mode I loading, the expression for the stress intensity factor (SIF or K ) for laboratory specimens is given by:
(1)
Where ‘c’ denotes the applied stress, ‘n’ is the crack length, ‘w’ represents the width of the test specimen, and 'F
) is the dimensionless
geometry factor which depends on the crack length and specimen
geometry.
Fatigue crack growth behavior is typically described by the relationship between the crack growth rate (da/dN) and the stress intensity
factor range (AK). The crack growth rate (da/dN) is derived from the
measured crack length (n) and the number of loading cycles (N) during
FCG testing. To determine AK, the measured crack length (o) and the
applied stress (c) are incorporated into a mathematical expression that
defines the stress intensity factor solution for the specific specimen geometry. For standard homogeneous test specimens, SIF solutions are
readily available in various test standards and handbooks (e.g.
Ref. [33]). For example, the SIF solution for the SEN specimen geometry
is well-established in literature and standards [27]. These solutions were
primarily calculated for rectangular plates under the uniform stress
boundary condition. However, in complex specimen geometries or
multi-material systems such as brazed joint specimens, the stress distribution near the crack tip is different compared to that in homogeneous material specimens due to mismatch in elastic properties between
base material Alloy 247DS and braze filler material. This discrepancy
makes the available SIF solution for standard homogeneous specimens
less applicable, and it necessitates the determination of SIF solution (or
geometry factor, Y) specifically for brazed joint specimens. This allows
more accurate calculation of AK from experimentally measured crack
length and ensures that the influence of material property mismatch on
4
5.
A. Bhadeliya ct al.Materials Science & EnfineeringA 918 (2024) 147488
Elemant sJzesreuna crack rront (mm)
(h t
§g$gg
L-alien\ed brazed joint
Z•0nente€I b azed jont
E
E
2&0
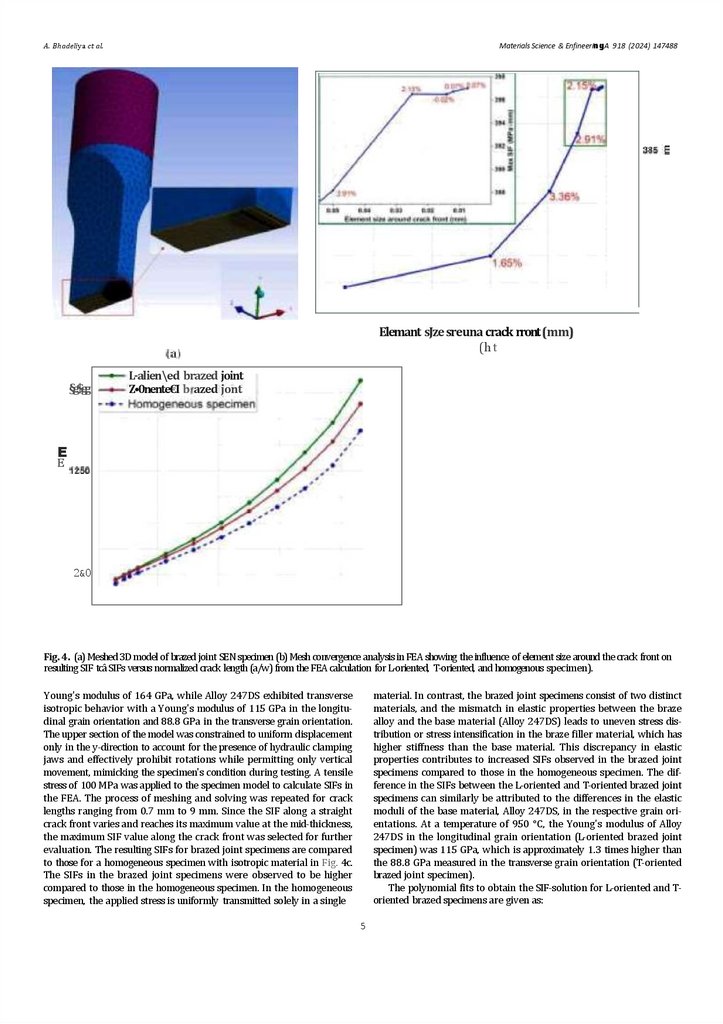
Fig. 4. (a) Meshed 3D model of brazed joint SEN specimen (b) Mesh convergence analysis in FEA showing the influence of element size around the crack front on
resulting SIF tcâ SIFs versus normalized crack length (a/w) from the FEA calculation for L-oriented, T-oriented, and homogenous specimen).
Young's modulus of 164 GPa, while Alloy 247DS exhibited transverse
isotropic behavior with a Young's modulus of 115 GPa in the longitudinal grain orientation and 88.8 GPa in the transverse grain orientation.
The upper section of the model was constrained to uniform displacement
only in the y-direction to account for the presence of hydraulic clamping
jaws and effectively prohibit rotations while permitting only vertical
movement, mimicking the specimen's condition during testing. A tensile
stress of 100 MPa was applied to the specimen model to calculate SIFs in
the FEA. The process of meshing and solving was repeated for crack
lengths ranging from 0.7 mm to 9 mm. Since the SIF along a straight
crack front varies and reaches its maximum value at the mid-thickness,
the maximum SIF value along the crack front was selected for further
evaluation. The resulting SIFs for brazed joint specimens are compared
to those for a homogeneous specimen with isotropic material in Fig. 4c.
The SIFs in the brazed joint specimens were observed to be higher
compared to those in the homogeneous specimen. In the homogeneous
specimen, the applied stress is uniformly transmitted solely in a single
material. In contrast, the brazed joint specimens consist of two distinct
materials, and the mismatch in elastic properties between the braze
alloy and the base material (Alloy 247DS) leads to uneven stress distribution or stress intensification in the braze filler material, which has
higher stiffness than the base material. This discrepancy in elastic
properties contributes to increased SIFs observed in the brazed joint
specimens compared to those in the homogeneous specimen. The difference in the SIFs between the L-oriented and T-oriented brazed joint
specimens can similarly be attributed to the differences in the elastic
moduli of the base material, Alloy 247DS, in the respective grain orientations. At a temperature of 950 °C, the Young's modulus of Alloy
247DS in the longitudinal grain orientation (L-oriented brazed joint
specimen) was 115 GPa, which is approximately 1.3 times higher than
the 88.8 GPa measured in the transverse grain orientation (T-oriented
brazed joint specimen).
The polynomial fits to obtain the SIF-solution for L-oriented and Toriented brazed specimens are given as:
5
6.
7.
A. Bhadeligo ct al.Materials Science & Eri$ineeifirt$ A 9s 8 (2024) 147488
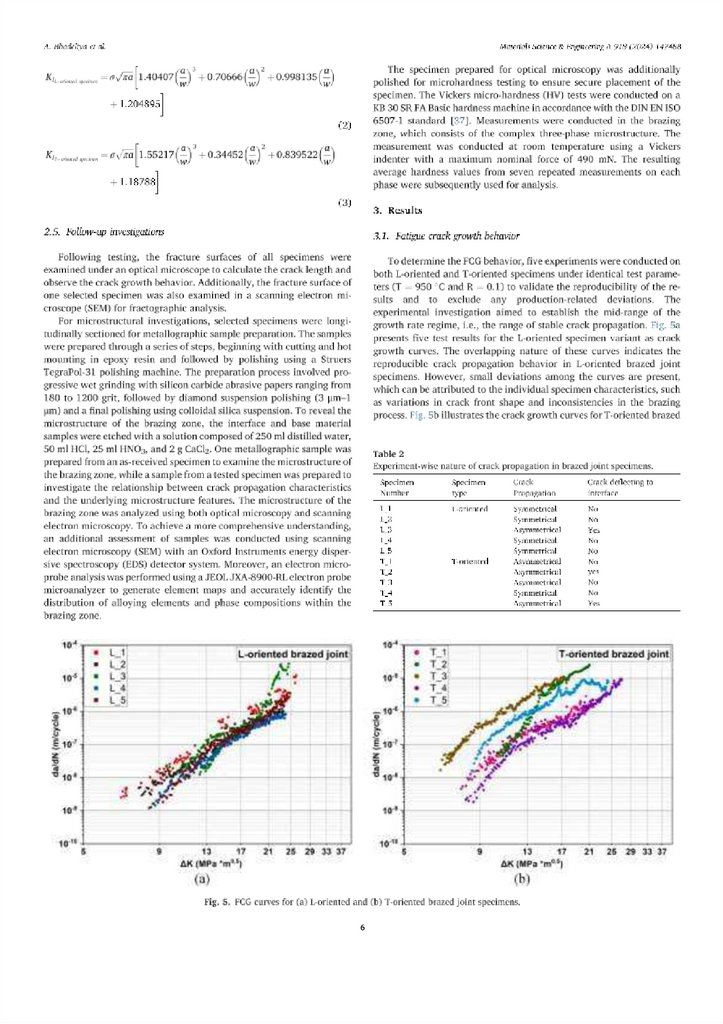
joint specimens. While stable crack propagation is evident, there is
notable scatter among the crack growth curves of different specimens.
These deviations are influenced by distinct crack growth behavior,
which can be understood by examining the respective fracture surfaces
as detailed further in Section 3.2. As presented in Table 2, the facture
surfaces of specimens T_1, T_2, T_3, and T_5 exhibited asymmetrical
crack propagation and/or deflection of the crack to the interface between the braze alloy and base material Alloy 247DS. Consequently, the
fatigue crack growth curve of specimen T_4 is considered more representative and is primarily used for subsequent analysis. The deviation in
these results highlights the complexity of the crack growth behavior in
brazed joints, indicating the contribution of potential microstructural
effects in the observed variability.
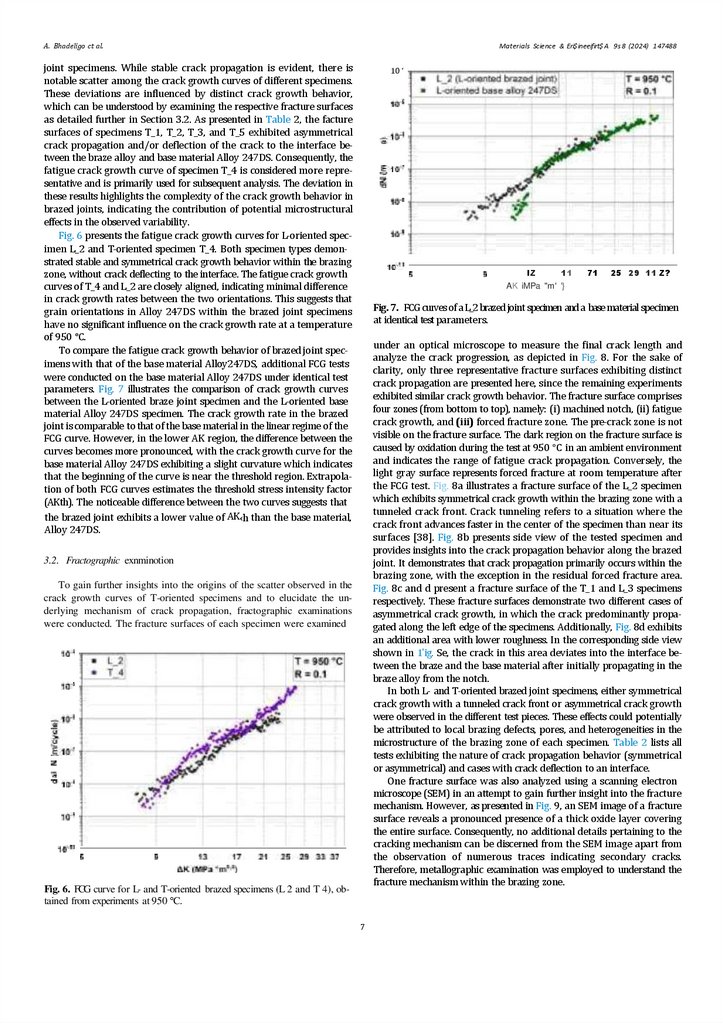
Fig. 6 presents the fatigue crack growth curves for L-oriented specimen L_2 and T-oriented specimen T_4. Both specimen types demonstrated stable and symmetrical crack growth behavior within the brazing
zone, without crack deflecting to the interface. The fatigue crack growth
curves of T_4 and L_2 are closely aligned, indicating minimal difference
in crack growth rates between the two orientations. This suggests that
grain orientations in Alloy 247DS within the brazed joint specimens
have no significant influence on the crack growth rate at a temperature
of 950 °C.
To compare the fatigue crack growth behavior of brazed joint specimens with that of the base material Alloy247DS, additional FCG tests
were conducted on the base material Alloy 247DS under identical test
parameters. Fig. 7 illustrates the comparison of crack growth curves
between the L-oriented braze joint specimen and the L-oriented base
material Alloy 247DS specimen. The crack growth rate in the brazed
joint is comparable to that of the base material in the linear regime of the
FCG curve. However, in the lower AK region, the difference between the
curves becomes more pronounced, with the crack growth curve for the
base material Alloy 247DS exhibiting a slight curvature which indicates
that the beginning of the curve is near the threshold region. Extrapolation of both FCG curves estimates the threshold stress intensity factor
(AKth). The noticeable difference between the two curves suggests that
the brazed joint exhibits a lower value of AK‹h than the base material,
Alloy 247DS.
10 ‘
IZ
11
71
25 29 11 Z?
AK iMPa "m' '}
Fig. 7. FCG curves of a L_2 brazedjoint specimen and a base material specimen
at identical test parameters.
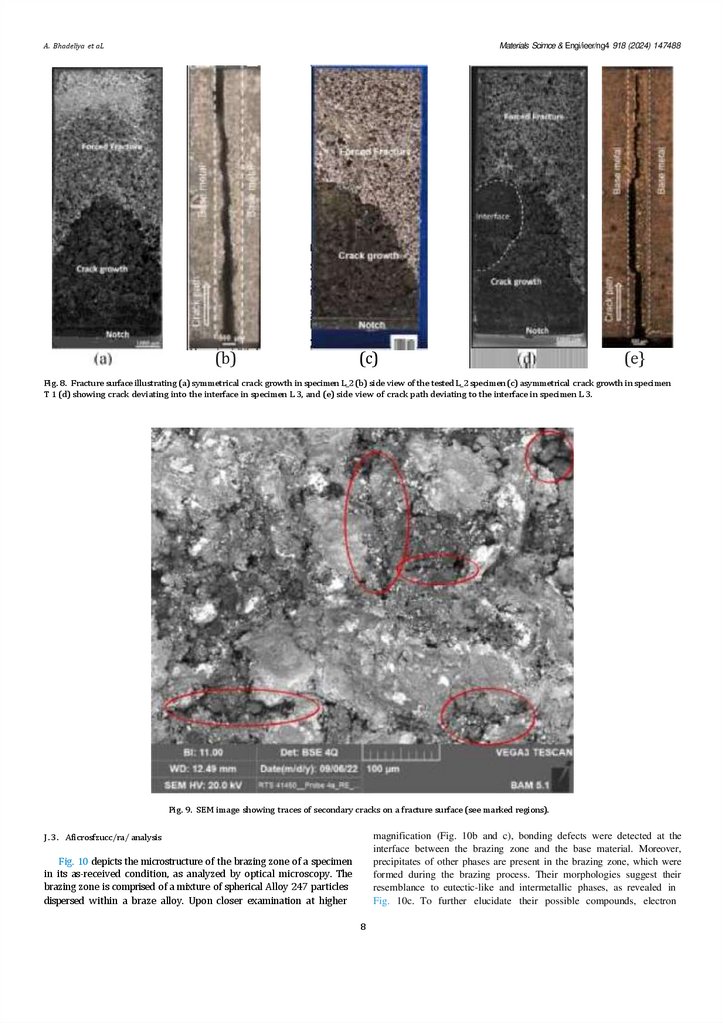
under an optical microscope to measure the final crack length and
analyze the crack progression, as depicted in Fig. 8. For the sake of
clarity, only three representative fracture surfaces exhibiting distinct
crack propagation are presented here, since the remaining experiments
exhibited similar crack growth behavior. The fracture surface comprises
four zones (from bottom to top), namely: (i) machined notch, (ii) fatigue
crack growth, and (iii) forced fracture zone. The pre-crack zone is not
visible on the fracture surface. The dark region on the fracture surface is
caused by oxidation during the test at 950 °C in an ambient environment
and indicates the range of fatigue crack propagation. Conversely, the
light gray surface represents forced fracture at room temperature after
the FCG test. Fig. 8a illustrates a fracture surface of the L_2 specimen
which exhibits symmetrical crack growth within the brazing zone with a
tunneled crack front. Crack tunneling refers to a situation where the
crack front advances faster in the center of the specimen than near its
surfaces [38]. Fig. 8b presents side view of the tested specimen and
provides insights into the crack propagation behavior along the brazed
joint. It demonstrates that crack propagation primarily occurs within the
brazing zone, with the exception in the residual forced fracture area.
Fig. 8c and d present a fracture surface of the T_1 and L_3 specimens
respectively. These fracture surfaces demonstrate two different cases of
asymmetrical crack growth, in which the crack predominantly propagated along the left edge of the specimens. Additionally, Fig. 8d exhibits
an additional area with lower roughness. In the corresponding side view
shown in 1'ig. Se, the crack in this area deviates into the interface between the braze and the base material after initially propagating in the
braze alloy from the notch.
In both L- and T-oriented brazed joint specimens, either symmetrical
crack growth with a tunneled crack front or asymmetrical crack growth
were observed in the different test pieces. These effects could potentially
be attributed to local brazing defects, pores, and heterogeneities in the
microstructure of the brazing zone of each specimen. Table 2 lists all
tests exhibiting the nature of crack propagation behavior (symmetrical
or asymmetrical) and cases with crack deflection to an interface.
One fracture surface was also analyzed using a scanning electron
microscope (SEM) in an attempt to gain further insight into the fracture
mechanism. However, as presented in Fig. 9, an SEM image of a fracture
surface reveals a pronounced presence of a thick oxide layer covering
the entire surface. Consequently, no additional details pertaining to the
cracking mechanism can be discerned from the SEM image apart from
the observation of numerous traces indicating secondary cracks.
Therefore, metallographic examination was employed to understand the
fracture mechanism within the brazing zone.
3.2. Fractographic exnminotion
To gain further insights into the origins of the scatter observed in the
crack growth curves of T-oriented specimens and to elucidate the underlying mechanism of crack propagation, fractographic examinations
were conducted. The fracture surfaces of each specimen were examined
Fig. 6. FCG curve for L- and T-oriented brazed specimens (L 2 and T 4), obtained from experiments at 950 °C.
7
8.
A. Bhadeliya et aLMaterials Scimce & Engi/ieer/ng4 918 (2024) 147488
(b)
(c)
(e}
Fig. 8. Fracture surface illustrating (a) symmetrical crack growth in specimen L_2 (b) side view of the tested L_2 specimen (c) asymmetrical crack growth in specimen
T 1 (d) showing crack deviating into the interface in specimen L 3, and (e) side view of crack path deviating to the interface in specimen L 3.
Pig. 9. SEM image showing traces of secondary cracks on a fracture surface (see marked regions).
J . 3 . Aficrosfzucc/ra/ analysis
magnification (Fig. 10b and c), bonding defects were detected at the
interface between the brazing zone and the base material. Moreover,
precipitates of other phases are present in the brazing zone, which were
formed during the brazing process. Their morphologies suggest their
resemblance to eutectic-like and intermetallic phases, as revealed in
Fig. 10c. To further elucidate their possible compounds, electron
Fig. 10 depicts the microstructure of the brazing zone of a specimen
in its as-received condition, as analyzed by optical microscopy. The
brazing zone is comprised of a mixture of spherical Alloy 247 particles
dispersed within a braze alloy. Upon closer examination at higher
8