


")


")


")

")


 Математика
Похожие презентации:
 when is known and n (large)")

")


")
")


Confidence interval estimation
1. Confidence Interval Estimation
12. Types of Estimates
• Point Estimate– A single number used to estimate an unknown
population parameter
• Interval Estimate
– A range of values used to estimate a population
parameter
– Characteristics
• Better idea of reliability of estimate
• Decision making is facilitated
2
3. Point Estimates
Estimate PopulationParameters …
Mean
Standard
deviation
Variance
Difference
σ
1 2
2
with Sample
Statistics
X
S
S2
X1 X 2
3
4. Point and Interval Estimates
• A point estimate is a single number,• a confidence interval provides additional
information about variability
Lower
Confidence
Limit
Point Estimate
Upper
Confidence
Limit
Width of
confidence interval
4
5. Confidence Interval Estimate
• An interval gives a range of values:– Takes into consideration the variation in sample
statistics from sample to sample
– Based on observation from 1 sample
– Gives information about closeness to unknown
population parameters
– Stated in terms of level of confidence
• Can never be 100% confident
5
6. Confidence Level, (1-)
Confidence Level, (1- )• Suppose confidence level γ = 95%
• Also written γ =(1 - ) = .95
• Where is the risk of being wrong
• A relative frequency interpretation:
– In the long run, 95% of all the confidence
intervals that can be constructed will contain
the unknown parameter
• A specific interval either will contain or
will not contain the true parameter
– No probability involved in a specific interval
6
7. Estimation Process
Random SamplePopulation
(mean, μ, is
unknown)
Mean
x = 50
I am 95%
confident that
μ is between
40 & 60.
Sample
7
8. General Formula
• The general formula for allconfidence intervals is:
Point Estimate (Critical Value)(Standard Error)
8
9. Confidence Intervals
ConfidenceIntervals
Population
Mean
σ Known
σ Unknown
9
10. Confidence Interval for μ (σ Known)
• Assumptions– Population standard deviation σ is known
– Population is normally distributed
– If population is not normal, use large
sample
• Confidence interval estimate for μ
Critical
Value
x z α/2
σ
n
Standar
d error
10
11. Finding the Critical Value
ConfidenceLevel
γ
80%
90%
95%
98%
99%
99.8%
99.9%
Confidence
Coefficient,
z value,
.80
.90
.95
.98
.99
.998
.999
1.28
1.645
1.96
2.33
2.57
3.08
3.27
1
z /2
11
12. Finding the Critical Value
• Consider a 95% confidence interval:1 .95
α
.025
2
z α/2 1.96
α
.025
2
z units:
z.025= -1.96
x units:
Lower
Confidence
Limit
0
Point Estimate
z.025= 1.96
Upper
Confidence
Limit
12
13. Margin of Error
• Margin of Error (e): the amountadded and subtracted to the point
estimate to form the confidence
interval
Example: Margin of error for estimating μ, σ known:
x z /2
σ
n
e z /2
σ
n
13
14. Factors Affecting Margin of Error
e z /2σ
n
Intervals Extend from
X - Z
x
to X + Z
x
• Data variation, σ :
e
as σ
• Sample size, n :
e
as n
• Level of confidence, 1 - :
e
if γ =1 -
14
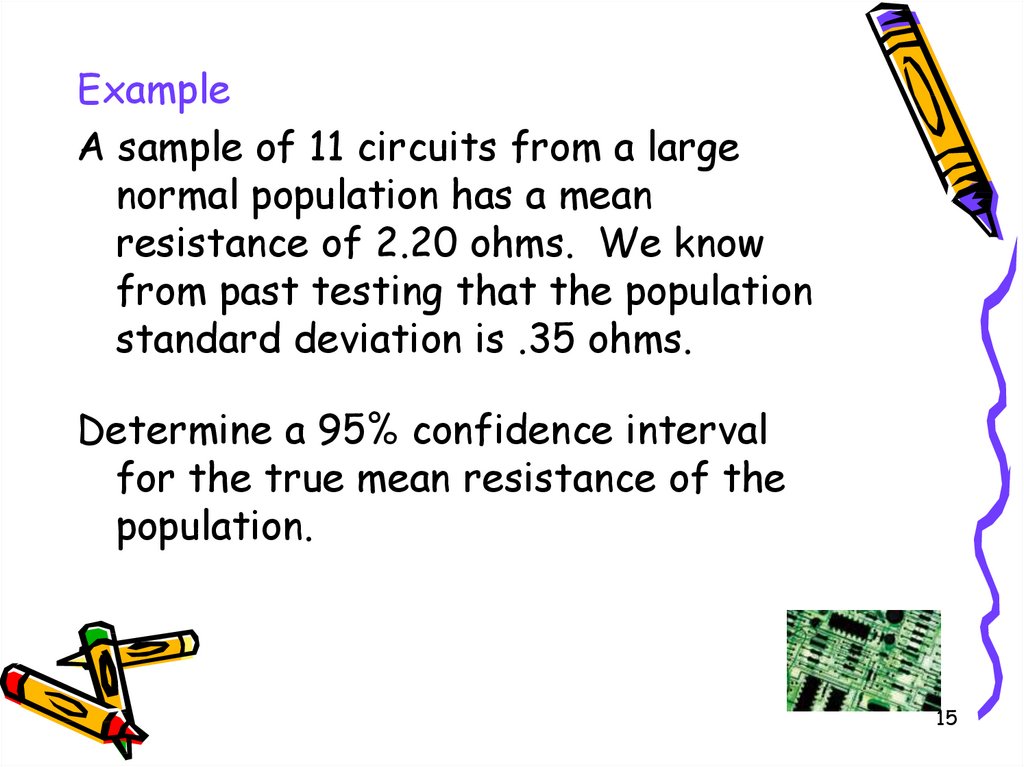
15.
ExampleA sample of 11 circuits from a large
normal population has a mean
resistance of 2.20 ohms. We know
from past testing that the population
standard deviation is .35 ohms.
Determine a 95% confidence interval
for the true mean resistance of the
population.
15
16. Solution –
To get a Z value use theNORMSINV function
with
p=γ+ alpha/2
x z /2
σ
n
for 95% confidence use
0.975
=
NORMSINV(0,975)
2.20 1.96 (.35/ 11) =NORM.S.INV(0,975)
Result =1.96
2.20 .2068
( 1.9932 .; 2.4068 )
16
17. Interpretation
• We are γ=95% confident that thetrue mean resistance is between
1.9932 and 2.4068 ohms
17
18. Confidence Interval for μ (σ Unknown)
• If the population standard deviation σis unknown, we can substitute the
sample standard deviation, s as an
estimate
In these case the t-distribution is used
instead of the normal distribution
18
19. Student’s t Distribution
Note: tNormal as n increases
Standard
Normal
(t with df > 30)
t (df = 13)
t-distributions are bellshaped and symmetric, but
have ‘fatter’ tails than the
normal
t (df = 5)
0
t
19
20. Confidence Interval for μ (σ Unknown)
• Assumptions– Population standard deviation is unknown
– Population is not highly skewed
– Population is normally distributed or the sample
size is large (>30)
• Use Student’s t Distribution
20
21.
• Confidence Interval Estimate:x t
s
n
• where t is the critical value of the t-distribution
with n-1 degrees of freedom and an area of α/2
in each tail)
21
22. Define t from equation
Define t from equationP T t
– Confidence Coefficient.
t - obtain with using Excel function TINV.
t
= TINV(1- γ; n-1)
=T.INV.2T (1- γ; n-1)
22
23. Example
A random sample of n = 25 has X = 50 andS = 8. Form 95% confidence interval for μ
– degrees of freedom = n – 1 = 24,
– =0,95.
23
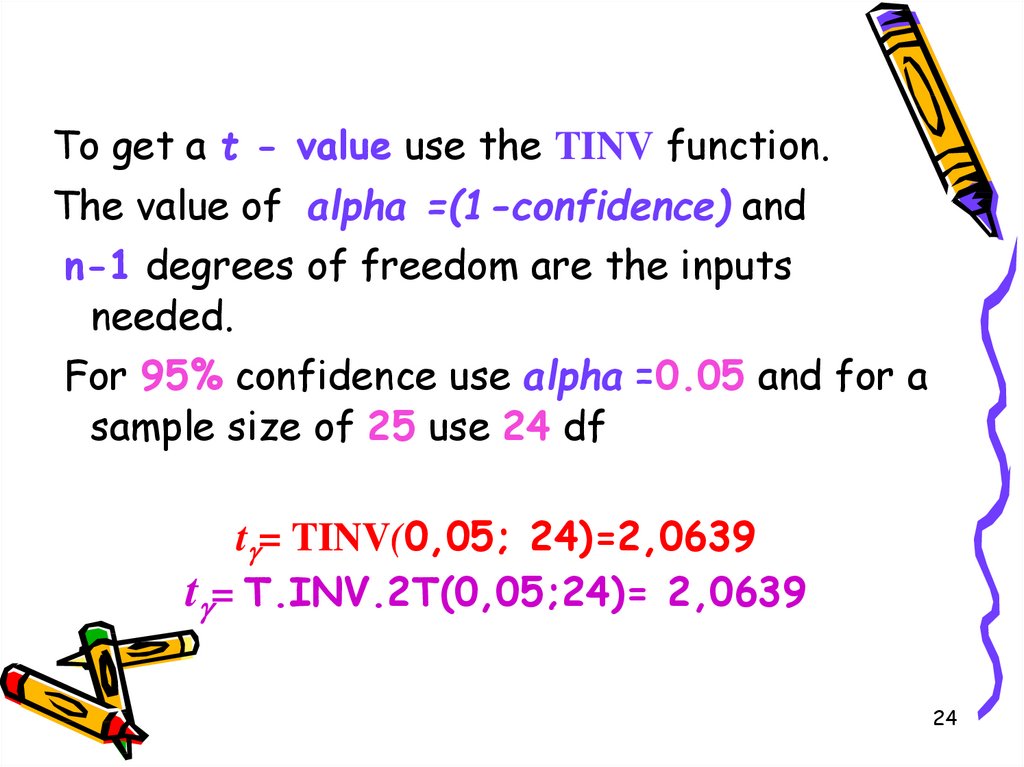
24.
To get a t - value use the TINV function.The value of alpha =(1-confidence) and
n-1 degrees of freedom are the inputs
needed.
For 95% confidence use alpha =0.05 and for a
sample size of 25 use 24 df
t = TINV(0,05; 24)=2,0639
t = T.INV.2T(0,05;24)= 2,0639
24
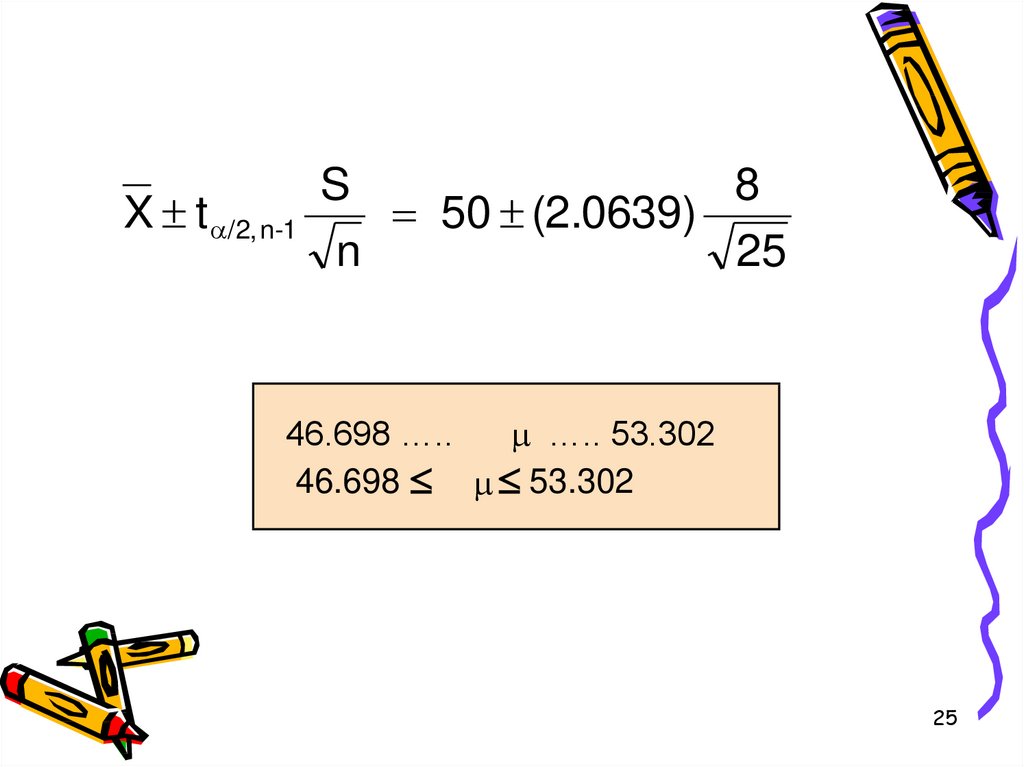
25.
X t /2, n-1S
8
50 (2.0639)
n
25
46.698 …..
….. 53.302
46.698 53.302
25
26. Confidence Interval on the Variance and Standard Deviation of a Normal Distribution
Definition26
27. Confidence Interval on the Variance and Standard Deviation of a Normal Distribution
Probability densityfunctions of several 2
distributions.
27
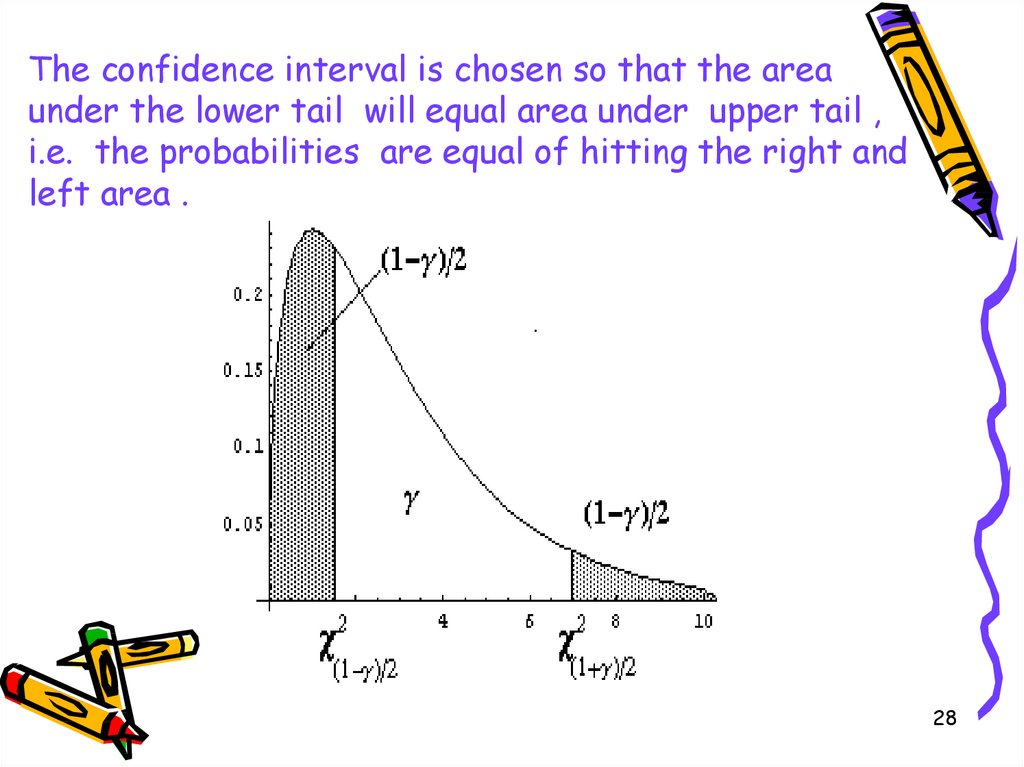
28.
The confidence interval is chosen so that the areaunder the lower tail will equal area under upper tail ,
i.e. the probabilities are equal of hitting the right and
left area .
28
29. Confidence Interval on the Variance and Standard Deviation of a Normal Distribution
n 1SP
2
2
n 1S
2
1
29
30.
where is the critical value of thedistribution with n-1 degrees of freedom
and a1= (1 ) 2 ;
2
2
1
is the critical value of the distribution
with n-1 d.f. and a2= (1 ) 2 .
2
2
2
30
31.
We can use 2 –Table for solving nextequation
P
2
2
q
q
Or EXCEL function CHIINV (q; n-1),
=CHISQ.INV.RT(q;n-1).
31
32. EXAMPLE
According to the 20 measurementsfound standard deviation S = 0,12. Find
precision measurements with reliability
0.98.
32
33.
With using CHIINV (q; n-1) we obtain 12 і22 .
For degrees of freedom n - 1=19 and
probability α2=(1-0,98)/2=0,01 define
22 =36,2,
after that for n - 1=19 and probability
α1=(1+0,98)/2=0,99 define 12 =7,63.
22 = CHIINV(0,01; 19)=36,2 ;
=CHISQ.INV.RT(0,01;19).
12 = CHIINV(0,99;19)=7,63.
=CHISQ.INV.RT(0,01;19).
33
34.
calculate20 1 * 0,12 4,36 * 0,12
0,09;
6,06
36,2
20 1 * 0,12 4,36 * 0,12
0,19.
2,76
7,63
Confidence Interval for σ is (0,09;0,19).
34